. 2022 Mar 15;14(6):1504.
doi: 10.3390/cancers14061504.

Divergent Metabolic Effects of Metformin Merge to Enhance Eicosapentaenoic Acid Metabolism and Inhibit Ovarian Cancer In Vivo

Affiliations

Divergent Metabolic Effects of Metformin Merge to Enhance Eicosapentaenoic Acid Metabolism and Inhibit Ovarian Cancer In Vivo

Mary P Udumula et al. Cancers (Basel). .

Abstract

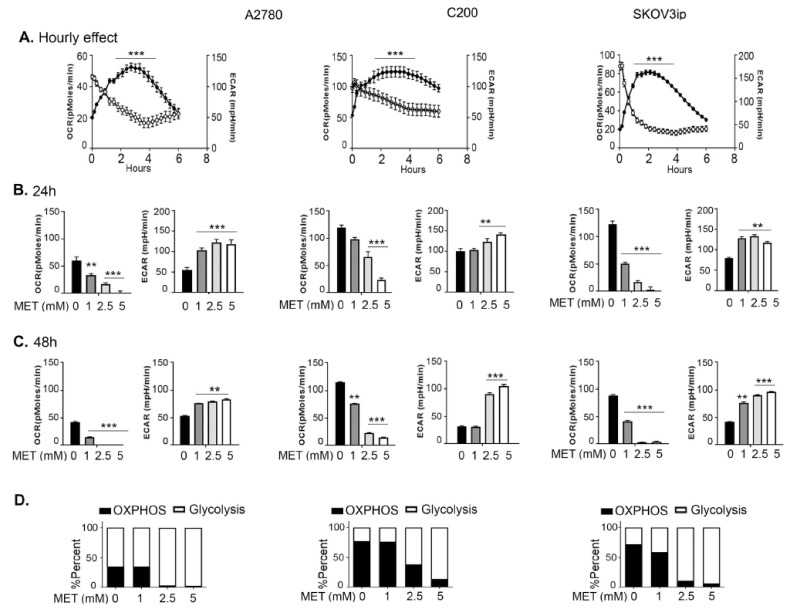
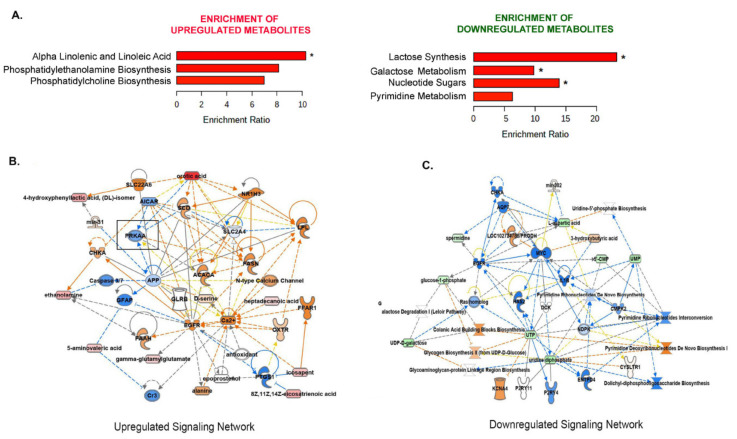
Metformin is being actively repurposed for the treatment of gynecologic malignancies including ovarian cancer. We investigated if metformin induces analogous metabolic changes across ovarian cancer cells. Functional metabolic analysis showed metformin caused an immediate and sustained decrease in oxygen consumption while increasing glycolysis across A2780, C200, and SKOV3ip cell lines. Untargeted metabolomics showed metformin to have differential effects on glycolysis and TCA cycle metabolites, while consistent increased fatty acid oxidation intermediates were observed across the three cell lines. Metabolite set enrichment analysis showed alpha-linolenic/linoleic acid metabolism as being most upregulated. Downstream mediators of the alpha-linolenic/linoleic acid metabolism, eicosapentaenoic acid (EPA) and docosahexaenoic acid (DHA), were abundant in all three cell lines. EPA was more effective in inhibiting SKOV3 and CaOV3 xenografts, which correlated with inhibition of inflammatory markers and indicated a role for EPA-derived specialized pro-resolving mediators such as Resolvin E1. Thus, modulation of the metabolism of omega-3 fatty acids and their anti-inflammatory signaling molecules appears to be one of the common mechanisms of metformin's antitumor activity. The distinct metabolic signature of the tumors may indicate metformin response and aid the preclinical and clinical interpretation of metformin therapy in ovarian and other cancers.

Keywords: DHA; EPA; metabolomics; metformin; omega-3 fatty acids; ovarian cancer.


Conflict of interest statement

The authors declare no conflict of interest.

Figures

Figure 1
Figure 1
Metformin induces sustained effects on cellular bioenergetics. Cell lines were subjected to increasing metformin (MET) concentrations for increasing time periods and cellular bioenergetics were measured. Basal OCR (oxygen consumption rate) and ECAR (extracellular acidification rate) changes in A2780, C200, and SKOV3ip cells (A) after immediate 5 mM metformin exposure, open circles represent OCR and closed circles represent ECAR; (B) after 24 h of indicated metformin exposure; (C) after 48 h of indicated metformin exposure. (D) Bioenergetic profile of the cell lines representing the percent ratio of OCR and ECAR being conducted by each cell line at 24 h of indicated metformin exposure. For all graphs, ** p ≤ 0.01, and *** p ≤ 0.001, metformin treated compared to untreated.
Figure 2
Figure 2
Effect of metformin on glycolysis cycle intermediates is cell-line specific. Selective analysis of glycolysis metabolites from the untargeted metabolomics was performed in untreated control (C) and 10 mM metformin (M)-treated cells. (A) Heatmap showing alterations in glycolysis cycle metabolites in A2780, C200, and SKOV3ip cells. Scaled metabolite intensity graphs showing levels of (B) glucose, (C) glucose-6-phosphate (glucose 6-P), (D) fructose 6-phosphate (fructose 6-P), (E) fructose 1,6-bisphosphate (fructose 1,6-biP), (F) 3-phosphoglycerate, (G) pyruvate, and (H) lactate in A2780, C200, and SKOV3ip cells in response to metformin (10 mM). For all box-plot graphs, * p ≤ 0.05, NS = p non-significant, # q ≤ 0.05, ns = q non-significant when metformin treated compared to control. (I) mRNA expression of glucose transporter (GLUT-1) in metformin (10 mM) ** p ≤ 0.01 and *** p ≤ 0.001, metformin treated compared to untreated.
Figure 3
Figure 3
Effect of metformin on TCA cycle intermediates is cell-line specific. Selective analysis of TCA metabolites from the untargeted metabolomics was performed in untreated control (C) and 10 mM metformin (M)-treated cells. (A) Heatmap showing alterations in TCA cycle metabolites in A2780, C200, and SKOV3ip cells. Scaled metabolite intensity graphs showing levels of (B) citrate, (C) succinate, (D) fumarate, and (E) malate. For all box-plot graphs, * p ≤ 0.05, NS = p non-significant, # q ≤ 0.05, ns = q non-significant when metformin treated compared to control.
Figure 4
Figure 4
Increase in fatty acid metabolism by metformin. Selective analysis of lipid metabolism from the untargeted metabolomics was performed in untreated control (C) and 10 mM metformin (M)-treated cells. (A) Fold-change in mean metabolite intensity in fatty acids and carnitines in response to 10 mM of metformin treatment in A2780, C200, and SKOV3ip cells, relative to untreated cells. Dark green indicates a significant difference (FDR ≤ 0.05) between the groups; light green indicates differences approaching significance (0.05 ≤ FDR ≤ 0.10) between the groups shown; red indicates a significant difference (FDR ≤ 0.05) between the groups; and pink indicates differences approaching significance (0.05 ≤ FDR ≤ 0.1) between the groups. (B) Pathway depicting metabolism of ketone body BHBA (beta-hydroxybutyrate) and its log-transformed scaled intensity boxplot. (C) mRNA expression of BDH1 (beta-hydroxybutyrate dehydrogenase) transportation of long-chain fatty acids, scaled intensity showing levels (BHBA) in A2780, C200, and SKOV3ip after metformin treatment. *** p ≤ 0.001, NS = non-significant when metformin treated compared to untreated. (D) Scaled intensity levels of acetyl carnitine in A2780, C200, and SKOV3ip after metformin treatment. (E) Scaled intensity levels of glycerol in A2780, C200, and SKOV3ip after metformin treatment. For all box-plot graphs, * p ≤ 0.05, NS = p non-significant, # q ≤ 0.05, ns = q non-significant when metformin treated compared to control.
Figure 5
Figure 5
Enrichment analysis reveals commonly altered metabolic pathways in response to metformin. (A) The consistently upregulated and consistently downregulated metabolites across all the three cell lines (* FDR < 0.05) were explored through enrichment analysis (MetaboAnalyst, SMDB pathways) to highlight concerted alterations. The significantly enriched metabolic pathways (FDR < 0.05) are presented. Ingenuity pathway analysis (IPA)-constructed network relationships and directional predictions about the relationships between consistently upregulated (B) or downregulated metabolites (C). Dark blue lines = predicted inhibition, dark orange = predicted activation. The blue and orange arrows show that the relationship is as expected for this prediction. Yellow arrows indicate that relation is not as expected. The observed metabolite fold change is in the shades of pink (up) and green (down) ovals.
Figure 6
Figure 6
Metformin enhances DHA and EPA metabolism. (A) Schematic briefly depicting the omega-6 (LA, linoleic acid) and omega-3 fatty (ALA, alpha-linolenic acid) acid metabolism leading to generation of downstream lipid mediators. Several metabolite intermediates that were increased in most cells by metformin included (B) linolenate, (C) di-homo linolenate, (D) arachidonate (AA), (E) docosapentaenoate (DPA), (F) Stearate, (G) eicosenate, (H) eicosapentaenoate (EPA), and (I) docosahexaenoate (DHA). (J) Ratio of the level of EPA and DHA in A2780, C200, and SKOV3ip. For all box-plot graphs, * p ≤ 0.05, NS = p non-significant, # q≤ 0.05, ns = q non-significant when metformin treated compared to control.
Figure 7
Figure 7
EPA and DHA inhibit ovarian cancer growth and improve survival. Mice injected intraperitoneally with (A) CaOV3 and (E) SKOV3ip were treated with EPA or DHA and observed for survival (n = 12), as described in the Materials and Methods section. Bar graph showing average tumor weights isolated from the (B) CaOV3 and (F) SKOV3ip mouse models (n = 10 mice per group). Tumor sections from both groups were subjected to immunohistochemistry (IHC) for proliferation and neovascularization markers. Representative IHC images (200×) showing Ki67 stain in CaOV3 (C) and SKOV3ip (G) tumors. Box-plots show the Ki-index calculated from n = 5 images per group at high-power field (HPF). Representative IHC images (200×) showing CD31 stain in CaOV3 (D) and SKOV3ip (H) tumors. Box-plots show the number of positive vessels per field calculated from n = 5 images per group at HPF. * p ≤ 0.05, ** p ≤ 0.01, and *** p ≤ 0.001, respective treated group compared to vehicle-treated control.
Figure 8
Figure 8
EPA treatment induces antiproliferative and apoptotic cell death in ovarian tumors. Pooled tumor tissue (n = 4) was used to isolate protein and immunoblotted for various markers including cell cycle proteins cyclin D1 and p21, and proliferation promoter PPARγ in (A) CaOV3 and (E) SKOV3ip tumors treated with EPA or vehicle. Bar graph represents normalized densitometric expression, n = 2. Uncropped Western blot images are shown in Figure S9. Immunoblots showing expression patterns of apoptotic markers cleaved PARP and cleaved caspase 3 in (B) CaOV3 and (F) SKOV3ip tumors treated with EPA or vehicle. Bar graph represents normalized densitometric expression, n = 2. Uncropped Western blot images are shown in Figure S9. Representative IHC images (200×) showing TUNEL stain in CaOV3 (C) and SKOV3ip (G) tumors. Box-plots show the number of positive cells per field calculated from n = 5 images per group at HPF. Representative IHC images showing cleaved caspase 3 stain in CaOV3 (D) and SKOV3ip (H) tumors. Box-plots show the number of positive cells per field calculated from n = 5 images per group at HPF. * p ≤ 0.05, ** p ≤ 0.01, and *** p ≤ 0.001, EPA-treated group compared to vehicle-treated control.
Figure 9
Figure 9
EPA lowers the inflammatory milieu in ovarian tumors and its microenvironment. Pooled mRNA from tumor tissues (n = 3) was assayed for inflammatory of interleukin (IL)-1β, MCP-1, IL-6, and TNF-α in (A) CaOV3 and (C) SKOV3ip mice treated with EPA or vehicle. Protein levels of IL-1β, MCP-1, IL-6, and TNF-α in plasma (n = 3) isolated from (B) CaOV3 and (D) SKOV3ip mice treated with EPA or vehicle. (E,F) Representative immunoblots showing phosphorylated (p)-ACC, AMPK and total (T) AMPK and β-actin expression from pooled tumors (n = 3) from vehicle (C) or EPA treated mice. Bar plots show normalized densitometric analysis from two individual blots. Uncropped Western blot images are shown in Figure S9. * p ≤ 0.05, ** p ≤ 0.01, and *** p ≤ 0.001, EPA-treated group compared to vehicle-treated control.
Figure 10
Figure 10
Metformin and EPA promote formation of specialized pro-resolving mediators. (A) A simplified schematic of the source of SPMs from EPA and DHA. (B) mRNA expression of ELOVL2 and ELOVL 5 in pooled CaOV3 tumors (n = 3) treated with metformin or vehicle control. (C) mRNA expression and (D) protein expression of 5-LOX and 15-LOX in pooled CaOV3 tumors (n = 3) treated with metformin or vehicle control. Immunoblots are representative of two independently run blots. Bar graphs are normalized densitometric measurements (n = 2). Uncropped Western blot images are shown in Figure S9. (E) RvD1 and RvE1 protein levels measured in plasma isolated from CaOV3 tumors from mice treated or untreated with metformin (n = 4). (F) mRNA expression of FPR2 and Chem23R in CaOV3 tumors (n = 3) treated with metformin or control (n = 3). (G) mRNA expression of ELOVL2 and ELOVL 5 in pooled CaOV3 tumors (n = 3) treated with EPA or vehicle control. (H) mRNA expression and (I) protein expression of 5-LOX and 15-LOX in pooled CaOV3 tumors (n = 3) treated with EPA or vehicle control. Immunoblots are representative of two independently run blots. Bar graphs are normalized densitometric measurements (n = 2). Uncropped Western blot images are shown in Figure S9. (J) RvD1 and RvE1 protein levels measured in plasma isolated from CaOV3 tumors treated with EPA or vehicle control (n = 4). (K) mRNA expression of FPR2 and Chem23R in CaOV3 tumors (n = 3) treated with EPA or vehicle control (n = 3). * p ≤ 0.05, ** p ≤ 0.01, and *** p ≤ 0.001, respective treated group compared to control.

Similar articles

Cited by

References

    1. Siegel R.L., Miller K.D., Jemal A. Cancer statistics, 2020. CA Cancer J. Clin. 2020;70:7–30. doi: 10.3322/caac.21590. - DOI - PubMed
    1. Gotlieb W.H., Saumet J., Beauchamp M.C., Gu J., Lau S., Pollak M.N., Bruchim I. In vitro metformin anti-neoplastic activity in epithelial ovarian cancer. Gynecol. Oncol. 2008;110:246–250. doi: 10.1016/j.ygyno.2008.04.008. - DOI - PubMed
    1. Lengyel E., Litchfield L.M., Mitra A.K., Nieman K.M., Mukherjee A., Zhang Y., Johnson A., Bradaric M., Lee W., Romero I.L. Metformin inhibits ovarian cancer growth and increases sensitivity to paclitaxel in mouse models. Am. J. Obstet. Gynecol. 2015;212:479.e1–479.e10. doi: 10.1016/j.ajog.2014.10.026. - DOI - PMC - PubMed
    1. Rattan R., Giri S., Hartmann L.C., Shridhar V. Metformin attenuates ovarian cancer cell growth in an AMP-kinase dispensable manner. J. Cell Mol. Med. 2011;15:166–178. doi: 10.1111/j.1582-4934.2009.00954.x. - DOI - PMC - PubMed
    1. Rattan R., Graham R.P., Maguire J.L., Giri S., Shridhar V. Metformin suppresses ovarian cancer growth and metastasis with enhancement of cisplatin cytotoxicity in vivo. Neoplasia. 2011;13:483–491. doi: 10.1593/neo.11148. - DOI - PMC - PubMed