

MitoQ Inhibits Human Breast Cancer Cell Migration, Invasion and Clonogenicity
- PMID: 35326667
- PMCID: PMC8946220
- DOI: 10.3390/cancers14061516
MitoQ Inhibits Human Breast Cancer Cell Migration, Invasion and Clonogenicity
Abstract
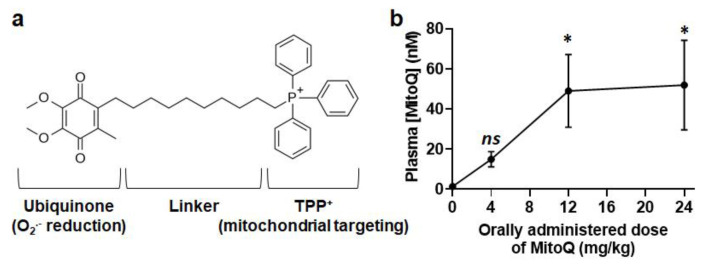
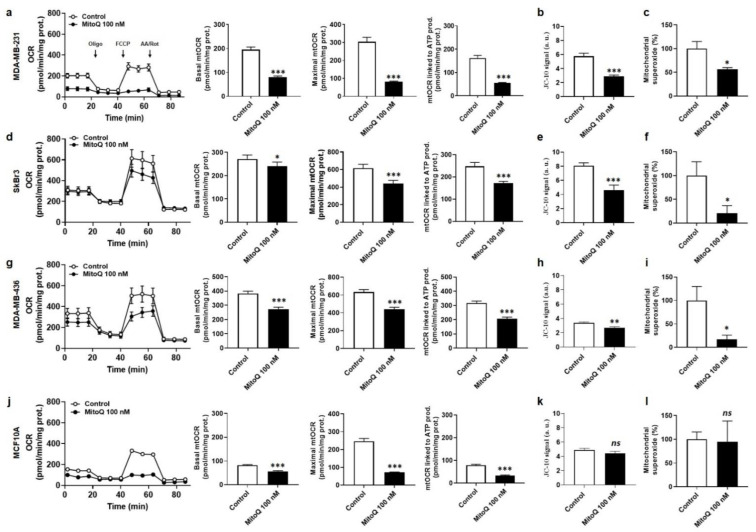
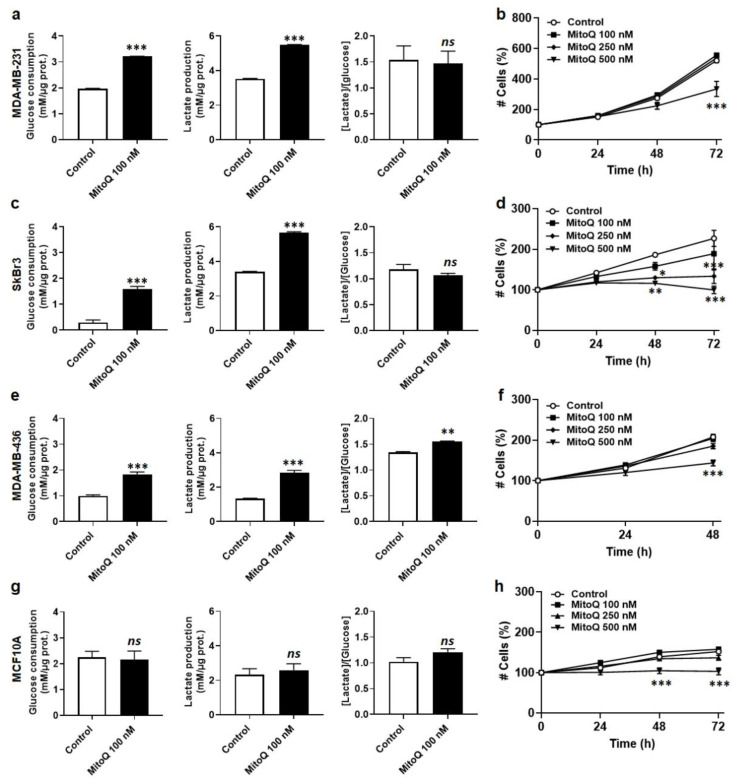
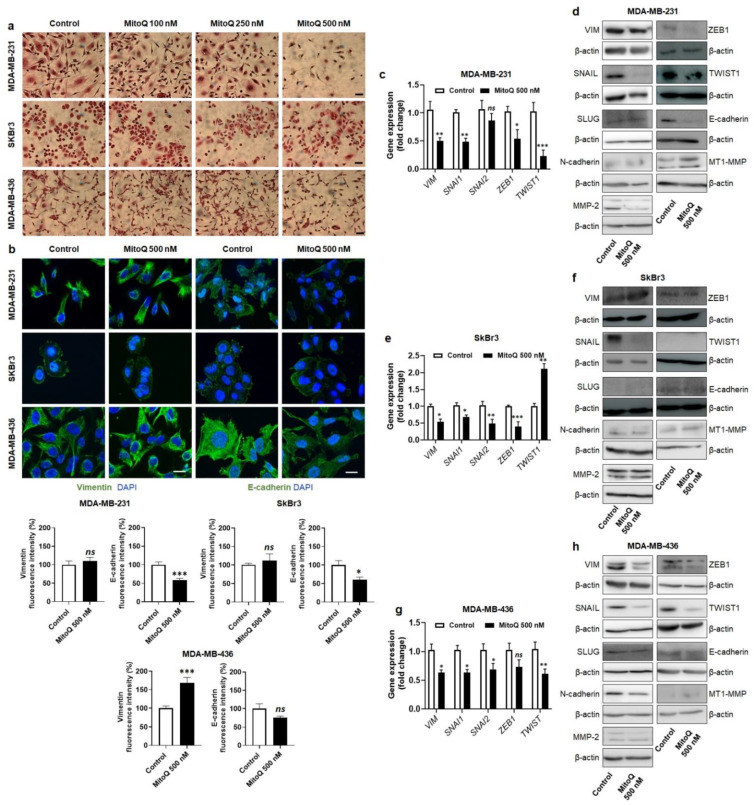
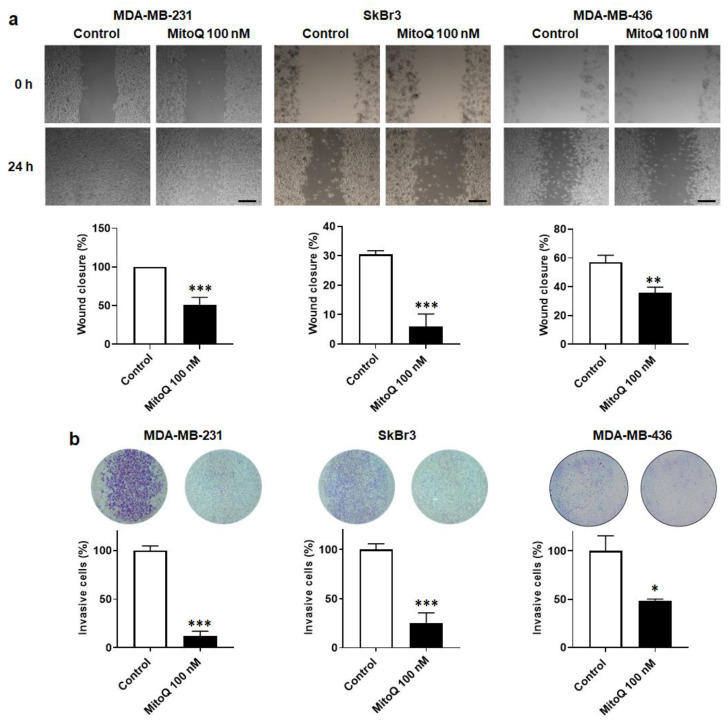
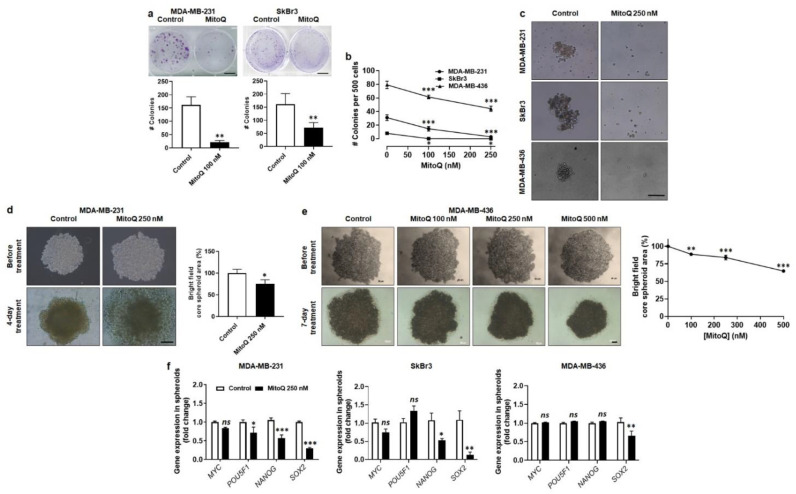
To successfully generate distant metastases, metastatic progenitor cells must simultaneously possess mesenchymal characteristics, resist to anoïkis, migrate and invade directionally, resist to redox and shear stresses in the systemic circulation, and possess stem cell characteristics. These cells primarily originate from metabolically hostile areas of the primary tumor, where oxygen and nutrient deprivation, together with metabolic waste accumulation, exert a strong selection pressure promoting evasion. Here, we followed the hypothesis according to which metastasis as a whole implies the existence of metabolic sensors. Among others, mitochondria are singled out as a major source of superoxide that supports the metastatic phenotype. Molecularly, stressed cancer cells increase mitochondrial superoxide production, which activates the transforming growth factor-β pathway through src directly within mitochondria, ultimately activating focal adhesion kinase Pyk2. The existence of mitochondria-targeted antioxidants constitutes an opportunity to interfere with the metastatic process. Here, using aggressive triple-negative and HER2-positive human breast cancer cell lines as models, we report that MitoQ inhibits all the metastatic traits that we tested in vitro. Compared to other mitochondria-targeted antioxidants, MitoQ already successfully passed Phase I safety clinical trials, which provides an important incentive for future preclinical and clinical evaluations of this drug for the prevention of breast cancer metastasis.
Keywords: MitoQ; breast cancer; clonogenicity; invasion; metastasis; migration; mitochondria; mitochondria-targeted antioxidant; mitochondrial superoxide; spheroids.
Conflict of interest statement
T.C. and P.S. are inventors of patent application EP21175397.5 “Molecular signature for assessing the responsiveness of cancer to mitochondria-targeted antioxidants”. M.P.M. consults for MitoQ Inc. and holds patents in mitochondria-targeted therapies. Authors declare no other conflicts of interest. In particular, Antipodean Pharmaceuticals Inc. and its side branch MitoQ Inc., who possess patent rights on the MitoQ molecule, did not fund the study. Neither them nor the funders were involved in the design of the study; in the collection, analyses, or interpretation of data; in the writing of the manuscript, or in the decision to publish the results.
Figures
Similar articles
-
MitoQ Prevents Human Breast Cancer Recurrence and Lung Metastasis in Mice.Cancers (Basel). 2022 Mar 15;14(6):1488. doi: 10.3390/cancers14061488. Cancers (Basel). 2022. PMID: 35326639 Free PMC article.
-
Inhibition of Mitochondrial Redox Signaling with MitoQ Prevents Metastasis of Human Pancreatic Cancer in Mice.Cancers (Basel). 2022 Oct 7;14(19):4918. doi: 10.3390/cancers14194918. Cancers (Basel). 2022. PMID: 36230841 Free PMC article.
-
Pro-oxidant mitochondrial matrix-targeted ubiquinone MitoQ10 acts as anti-oxidant at retarded electron transport or proton pumping within Complex I.Int J Biochem Cell Biol. 2009 Aug-Sep;41(8-9):1697-707. doi: 10.1016/j.biocel.2009.02.015. Epub 2009 Mar 3. Int J Biochem Cell Biol. 2009. PMID: 19433311
-
MitoQ--a mitochondria-targeted antioxidant.IDrugs. 2007 Jun;10(6):399-412. IDrugs. 2007. PMID: 17642004 Review.
-
How to clean the dirtiest place in the cell: cationic antioxidants as intramitochondrial ROS scavengers.IUBMB Life. 2005 Apr-May;57(4-5):305-10. doi: 10.1080/15216540500092161. IUBMB Life. 2005. PMID: 16036614 Review.
Cited by
-
About metformin and its action on the mitochondrial respiratory chain in prostate cancer.Transl Androl Urol. 2024 May 31;13(5):909-914. doi: 10.21037/tau-23-602. Epub 2024 May 16. Transl Androl Urol. 2024. PMID: 38855601 Free PMC article. No abstract available.
-
Redox-crippled MitoQ potently inhibits breast cancer and glioma cell proliferation: A negative control for verifying the antioxidant mechanism of MitoQ in cancer and other oxidative pathologies.Free Radic Biol Med. 2023 Aug 20;205:175-187. doi: 10.1016/j.freeradbiomed.2023.06.009. Epub 2023 Jun 14. Free Radic Biol Med. 2023. PMID: 37321281 Free PMC article.
-
Targeting Energy Metabolism in Cancer Treatment.Int J Mol Sci. 2022 May 16;23(10):5572. doi: 10.3390/ijms23105572. Int J Mol Sci. 2022. PMID: 35628385 Free PMC article. Review.
-
27-Hydroxycholesterol Enhances Secretion of Extracellular Vesicles by ROS-Induced Dysregulation of Lysosomes.Endocrinology. 2024 Sep 26;165(11):bqae127. doi: 10.1210/endocr/bqae127. Endocrinology. 2024. PMID: 39298675
-
Mitochondria-targeted antioxidant MitoQ radiosensitizes tumors by decreasing mitochondrial oxygen consumption.Cell Death Discov. 2024 Dec 27;10(1):514. doi: 10.1038/s41420-024-02277-9. Cell Death Discov. 2024. PMID: 39730333 Free PMC article.
References
Grants and funding
- 243188 TUMETABO/ERC_/European Research Council/International
- 722605 TRANSMIT/European Union's Horizon 2020 research innovation program Marie Skłodowska-Curie
- ARC 09/14-020 and 14/19-058/Actions de Recherche Concertées program of the Communauté Française de Belgique
- UP7-03/Interuniversity Attraction Pole from the Belgian Science Policy Office
- Fundamental Research Grants #F86 and #FAF-F/2018/1282/Fondation Belge contre le Cancer
LinkOut - more resources
Full Text Sources
Research Materials
Miscellaneous
