

The Contrasting Delayed Effects of Transient Exposure of Colorectal Cancer Cells to Decitabine or Azacitidine
- PMID: 35326680
- PMCID: PMC8945888
- DOI: 10.3390/cancers14061530
The Contrasting Delayed Effects of Transient Exposure of Colorectal Cancer Cells to Decitabine or Azacitidine
Abstract
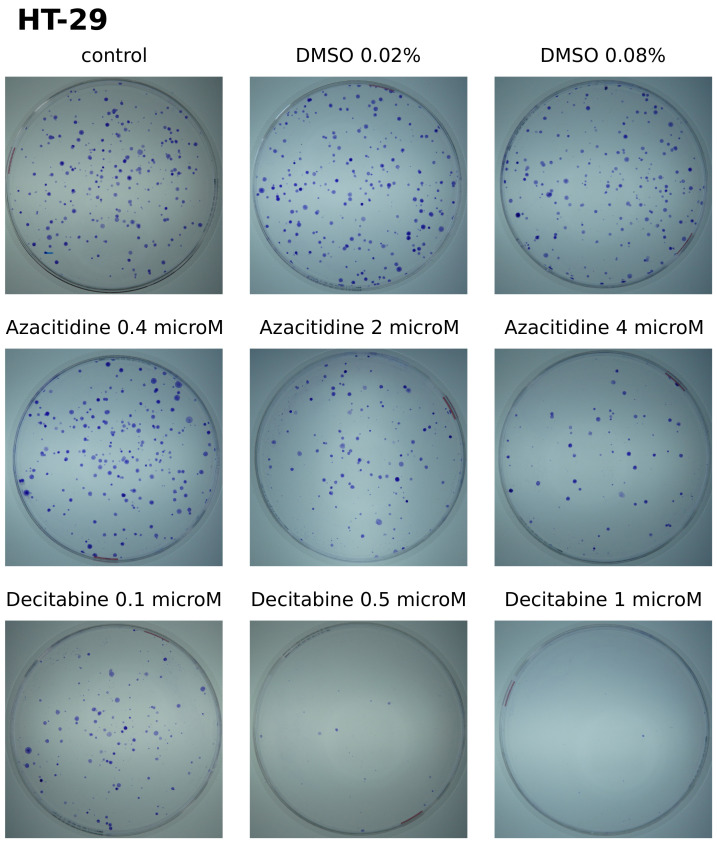
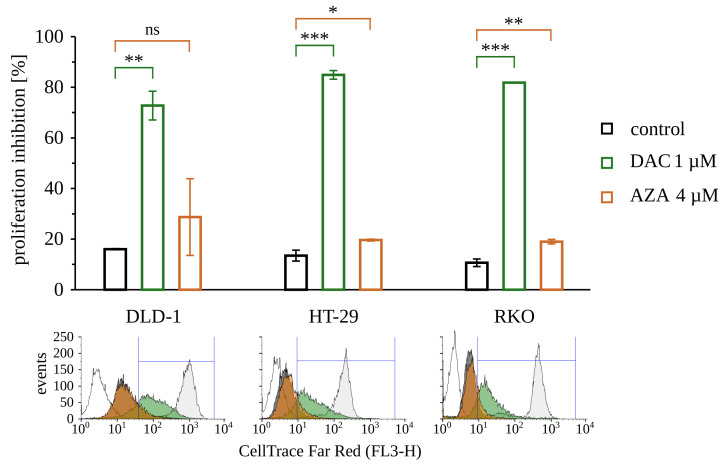
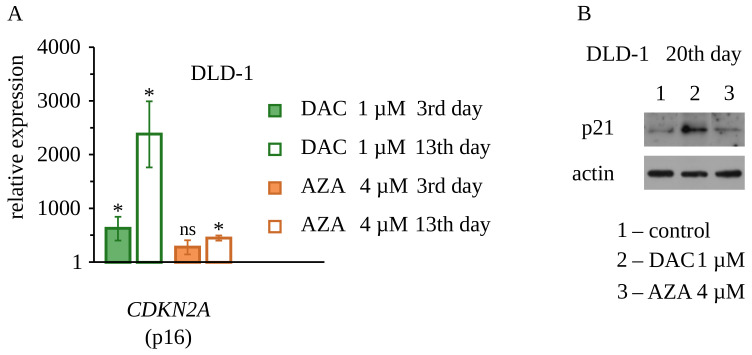
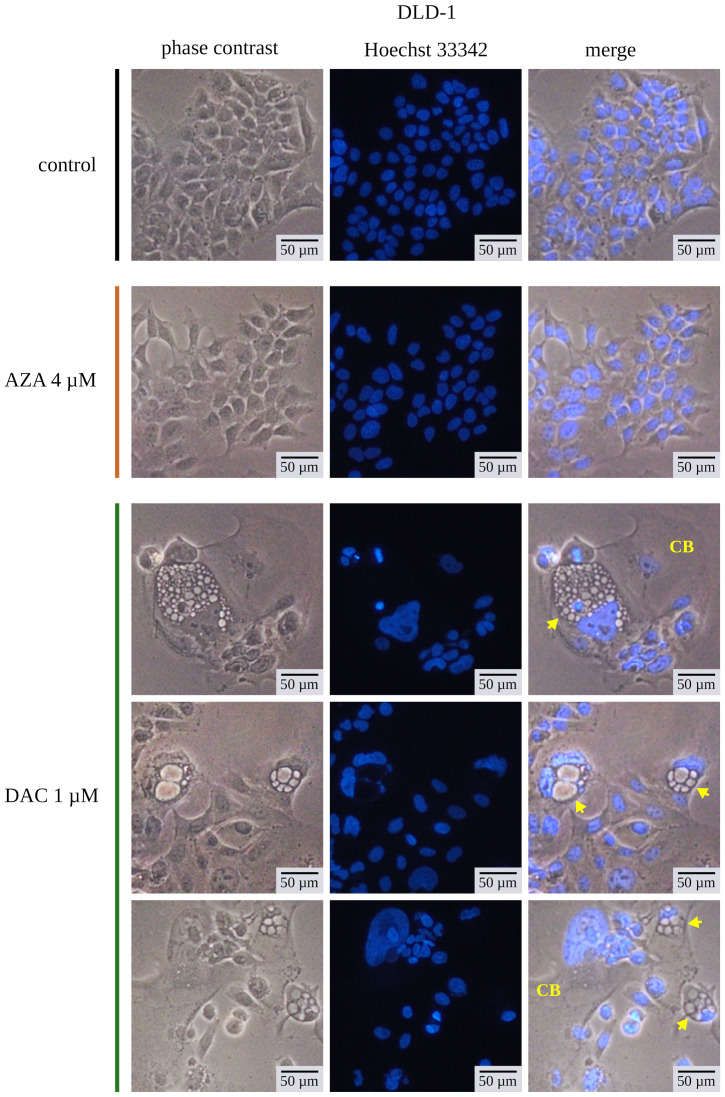
(1) Background: Decitabine and azacitidine are cytosine analogues representing the class of drugs interfering with DNA methylation. Due to their molecular homology and similar clinical application, both drugs are often regarded as interchangeable. Despite their unique mechanism of action the studies designed for observation and comparison of the prolonged activity of these drugs are rare. (2) Methods: The short-time (20-72 h) and long-term (up to 20 days) anti-cancer activity of decitabine and azacitidine has been studied in colorectal cancer cells. We observe the impact on cell culture's viability, clonogenicity, proliferation, and expression of CDKN1A, CCND1, MDM2, MYC, CDKN2A, GLB1 genes, and activity of SA-β-galactosidase. (3) Results: Decitabine has much stronger anti-clonogenic activity than azacitidine. We show that azacitidine, despite significant immediate toxicity, has negligible long-term effects. Contrary, decitabine, which does not exert initial toxicity, profoundly worsened the condition of the cells over time. On the 13th day after treatment, the viability of cells was decreased and proliferation inhibited. These functional changes were accompanied by up-regulation of expression CDKN1A, CCND1, and CDKN2A genes and increased activation of SA-β-galactosidase, indicating cellular senescence. (4) Conclusions: Our head-to-head comparison revealed profound differences in the activities of decitabine and azacitidine important in their anti-cancer potential and clinical application. The effects of decitabine need relatively long time to develop. This property is crucial for proper design of studies and therapy concerning decitabine and undermines opinion about the similar therapeutic mechanism and interchangeability of these drugs.
Keywords: azacitidine; cellular senescence; chemotherapy; colon cancer; decitabine; epigenetic drug; vidaza.
Conflict of interest statement
The authors declare no conflict of interest.
Figures


Similar articles
-
Hydroxycarbamide in combination with azacitidine or decitabine is antagonistic on DNA methylation inhibition.Br J Haematol. 2007 Sep;138(5):616-23. doi: 10.1111/j.1365-2141.2007.06707.x. Br J Haematol. 2007. PMID: 17686055
-
Combination of gefitinib and DNA methylation inhibitor decitabine exerts synergistic anti-cancer activity in colon cancer cells.PLoS One. 2014 May 29;9(5):e97719. doi: 10.1371/journal.pone.0097719. eCollection 2014. PLoS One. 2014. PMID: 24874286 Free PMC article.
-
Decitabine has a biphasic effect on natural killer cell viability, phenotype, and function under proliferative conditions.Mol Immunol. 2013 Jul;54(3-4):296-301. doi: 10.1016/j.molimm.2012.12.012. Epub 2013 Jan 16. Mol Immunol. 2013. PMID: 23328088
-
Will DNA methylation inhibitors work in solid tumors? A review of the clinical experience with azacitidine and decitabine in solid tumors.Epigenomics. 2010 Feb;2(1):71-86. doi: 10.2217/epi.09.44. Epigenomics. 2010. PMID: 22122748 Review.
-
Use of Azacitidine or Decitabine for the Up-Front Setting in Acute Myeloid Leukaemia: A Systematic Review and Meta-Analysis.Cancers (Basel). 2021 Nov 12;13(22):5677. doi: 10.3390/cancers13225677. Cancers (Basel). 2021. PMID: 34830832 Free PMC article. Review.
Cited by
-
The integrative genomic and functional immunological analyses of colorectal cancer initiating cells to modulate stemness properties and the susceptibility to immune responses.J Transl Med. 2025 Feb 17;23(1):193. doi: 10.1186/s12967-025-06176-0. J Transl Med. 2025. PMID: 39962504 Free PMC article.
-
Synergistic Integration of HDAC Inhibitors and Individualized Neoantigen Therapy (INT): A Next-Generation Combinatorial Approach for Cancer Immunotherapy.Vaccines (Basel). 2025 May 22;13(6):550. doi: 10.3390/vaccines13060550. Vaccines (Basel). 2025. PMID: 40573881 Free PMC article. Review.
-
Cellular senescence in colorectal cancer: its occurrence, effect and therapy.Front Oncol. 2025 Aug 15;15:1580951. doi: 10.3389/fonc.2025.1580951. eCollection 2025. Front Oncol. 2025. PMID: 40896432 Free PMC article. Review.
-
Epigenetic modifications in early stage lung cancer: pathogenesis, biomarkers, and early diagnosis.MedComm (2020). 2025 Feb 21;6(3):e70080. doi: 10.1002/mco2.70080. eCollection 2025 Mar. MedComm (2020). 2025. PMID: 39991629 Free PMC article. Review.
-
Titin as a potential novel therapeutic target in colorectal cancer.J Cell Mol Med. 2023 Oct;27(19):2937-2944. doi: 10.1111/jcmm.17866. Epub 2023 Jul 27. J Cell Mol Med. 2023. PMID: 37499109 Free PMC article.
References
-
- Sorm F., Vesely J. The activity of A new antimetabolite, 5-azacytidine, against lymphoid leukaemia in AK mice. Neoplasma. 1964;11:123–130. - PubMed
Grants and funding
LinkOut - more resources
Full Text Sources
Research Materials
Miscellaneous
