. 2022 Mar 17;14(6):1537.
doi: 10.3390/cancers14061537.

pncCCND1_B Engages an Inhibitory Protein Network to Downregulate CCND1 Expression upon DNA Damage

Affiliations

pncCCND1_B Engages an Inhibitory Protein Network to Downregulate CCND1 Expression upon DNA Damage

Ramona Palombo et al. Cancers (Basel). .

Abstract

Promoter-associated noncoding RNAs (pancRNAs) represent a class of noncoding transcripts driven from the promoter region of protein-coding or non-coding genes that operate as cis-acting elements to regulate the expression of the host gene. PancRNAs act by altering the chromatin structure and recruiting transcription regulators. PncCCND1_B is driven by the promoter region of CCND1 and regulates CCND1 expression in Ewing sarcoma through recruitment of a multi-molecular complex composed of the RNA binding protein Sam68 and the DNA/RNA helicase DHX9. In this study, we investigated the regulation of CCND1 expression in Ewing sarcoma cells upon exposure to chemotherapeutic drugs. Pan-inhibitor screening indicated that etoposide, a drug used for Ewing sarcoma treatment, promotes transcription of pncCCND1_B and repression of CCND1 expression. RNA immunoprecipitation experiments showed increased binding of Sam68 to the pncCCND1_B after treatment, despite the significant reduction in DHX9 protein. This effect was associated with the formation of DNA:RNA duplexes at the CCND1 promoter. Furthermore, Sam68 interacted with HDAC1 in etoposide treated cells, thus contributing to chromatin remodeling and epigenetic changes. Interestingly, inhibition of the ATM signaling pathway by KU 55,933 treatment was sufficient to inhibit etoposide-induced Sam68-HDAC1 interaction without rescuing DHX9 expression. In these conditions, the DNA:RNA hybrids persist, thus contributing to the local chromatin inactivation at the CCND1 promoter region. Altogether, our results show an active role of Sam68 in DNA damage signaling and chromatin remodeling on the CCND1 gene by fine-tuning transitions of epigenetic complexes on the CCND1 promoter.

Keywords: CCND1; DNA damage; Ewing sarcoma; Sam68; noncoding RNA.


Conflict of interest statement

The authors declare no conflict of interest.

Figures

Figure 1
Figure 1
Pan-inhibitor screening unveils etoposide as a modulator of pncCCND1_B expression. The expression of pncCCND1_B (A) and CCND1 mRNA (B) was monitored in TC-71 Ewing sarcoma cells after transfection with either the control or sipncCCND1_B oligonucleotides or in vitro transcribed pncCCND1_B. Histograms represent three independent experiments (±S.D.). Statistical analysis was performed by the Student’s t-test versus CTRL. (C.) Expression levels of pncCCND1_B were evaluated in a dataset derived from an RNA-sequencing experiment of a total of 20 Ewing sarcoma patients and nine Ewing sarcoma cell lines (dbGaP accession phs000804.v1.p1) [7,36]. The expression of pncCCND1_B (D) and CCND1 mRNA (E) was monitored in TC-71 Ewing sarcoma cells after different 16 h drug treatments. Histograms represent three independent experiments (±S.D.). Statistical analysis was performed by the Student t-test versus DMSO. p-value (* < 0.05, ** < 0.01, *** < 0.005, n.s. > 0.05).
Figure 2
Figure 2
Etoposide treatment inversely affects pncCCND1_B and CCND1 in a dose dependent fashion. (A) Percentage of blue positive cells by Trypan blue staining at 16 h after treatment with different concentrations of Etoposide. (B) RT-qPCR analysis of pncCCND1_B expression at different etoposide concentrations, as in A. (C) Western blot analysis upon treatment with either DMSO (vehicle) or increasing concentration of etoposide (ETO). After 16 h of treatment, DHX9, Sam68, and CCND1 protein levels were analyzed in protein total lysates (15 µg). GAPDH was used as the loading control. Histograms represent CCND1 (D), DHX9 (E), and Sam68 (F) protein levels normalized to the GAPDH signal and relative to DMSO. Statistical analysis was performed by ANOVA with Bonferroni correction. p-value (*, # < 0.05, **, ## < 0.01, ***, ### < 0.005, n.s. > 0.05).
Figure 3
Figure 3
Etoposide induces the formation of DNA:RNA hybrids at CCND1 promoter. (A) Western blot analyses were performed on 15 μg of total extracts of TC-71 cells treated for 16 h with either DMSO (vehicle) or 5 µM etoposide (ETO). DHX9, Sam68, CCND1, and γH2A. X protein levels were analyzed. GAPDH was used as loading control. (B) Histograms represent Sam68 binding to pncCCND1_B from cross-linked and immunoprecipitation experiments. Values are expressed as input percentage and normalized to IgGs signal. (C) qPCR analysis of S9.6 immunoprecipitated chromatin from DNA:RNA heteroduplex in the promoter region of the CCND1 gene. As represented in the illustration, the S9.6 antibody recognizes DNA:RNA hybrids. (D) EWS-FLI1 recruitment on the CCND1 promoter was evaluated by ChIP experiments. Histograms represent input percentage from three independent experiments. (E) Western blot analysis to monitor recombinant expression of GFP or GFPDHX9 in TC-71 cells, treated with either DMSO or etoposide 5 μM. Ten μg of total extract was loaded in each lane. (F) qPCR analysis of S9.6 immunoprecipitated chromatin from DNA:RNA heteroduplexes in the promoter region of the CCND1 gene. Histograms represent input percentage. (G) RT-qPCR analysis of CCND1 expression in TC-71 cells transfected with either GFP or GFP-DHX9, and treated with DMSO or etoposide. Histograms represent three independent experiments (±S.D.). Statistical analysis was performed by ANOVA with Bonferroni post hoc test. p-value (*, # < 0.05, **, ## < 0.01, ***, ### < 0.005).
Figure 4
Figure 4
Sam68 and HDAC1 participate in the DNA damage response. (A) Immunofluorescence analysis was performed on TC-71 cells treated with either DMSO, 5 µM etoposide (ETO), or etoposide with pre-treatment of 10 µM of KU55933 (ETO + KU). (B) Western blot analysis of co-immunoprecipitation experiments performed from nuclear extracts of TC-71 cells treated with DMSO (vehicle), 5 µM etoposide (ETO), or etoposide with pre-treatment of 10 µM of KU 55,933 (ETO + KU). HDAC1 protein was immunoprecipitated with a specific antibody; CBP protein was used as the positive control. Sam68 was detected in the immunoprecipitated proteins. (C) Histograms represent the densitometric analysis of Sam68-HDAC1 interaction in each condition relative to DMSO, from three independent experiments. Statistical analysis was performed by ANOVA with the Bonferroni post hoc test. p-value (*, # < 0.05, ** < 0.01, n.s. > 0.05).
Figure 5
Figure 5
Histone acetylation of CCND1 promoter upon etoposide treatment. Histone acetylation was evaluated by ChIP analysis upon DMSO (vehicle), 5 µM etoposide (ETO), or etoposide with pre-treatment of 10 µM of KU 55933 (ETO + KU). The acetylated status of the promoter was measured by qPCR analysis at the pncCCND1_B promoter (upstream region, (A)) and at a downstream region (B), close to transcription start site (TSS) of the CCND1 gene. p-value was evaluated by ANOVA with Bonferroni correction (*, # < 0.05, ***, ### < 0.005, n.s. > 0.05).
Figure 6
Figure 6
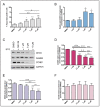
DNA:RNA heteroduplex formation, caused by DHX9 repression, impairs transcription at the CCND1 promoter. (A) Representative western blot upon treatment with DMSO (vehicle), 5 µM etoposide (ETO), and combination of etoposide and KU 55933 (10 µM) (ETO + KU). Histograms represent DHX9 (B), cleaved PARP1 (C) (n.d. not detectable), Sam68 (D), and CCND1 (E) protein levels normalized to β-actin, relative to DMSO. (F) qPCR analysis of the promoter region of CCND1 gene on S9.6 immunoprecipitated chromatin (DRIP experiment). (G) RT-qPCR analysis of pncCCND1_B in DNA:RNA immunoprecipitated heteroduplexes (CARIP experiment). Statistical analysis was performed by ANOVA with Bonferroni correction ANOVA. (BG) p-value (*, # < 0.05, ** < 0.01, ***, ### < 0.005). (H) Schematic representation of the CCND1 promoter region. Acetylation of histone proteins is required for the transcription of CCND1 gene by EWS-FLI1. This oncoprotein interacts with the DNA/RNA helicase DHX9, facilitating RNAPII recruitment and CCND1 transcription. Etoposide treatment enhances the transcription of the pncCCND1_B, whereas it inhibits the expression of CCND1 through the formation of an inhibitory complex due to the formation of RNA:DNA hybrid structures.

References

    1. Sainsbury S., Bernecky C., Cramer P. Structural basis of transcription initiation by RNA polymerase II. Nat. Rev. Mol. Cell Biol. 2015;16:129–143. doi: 10.1038/nrm3952. - DOI - PubMed
    1. Chellini L., Frezza V., Paronetto M.P. Dissecting the transcriptional regulatory networks of promoter-associated noncoding RNAs in development and cancer. J. Exp. Clin. Cancer Res. 2020;39:51. doi: 10.1186/s13046-020-01552-8. - DOI - PMC - PubMed
    1. Mercatelli N., Palombo R., Paronetto M.P. Emerging Contribution of PancRNAs in Cancer. Cancers. 2020;12:2035. doi: 10.3390/cancers12082035. - DOI - PMC - PubMed
    1. Wang X., Arai S., Song X., Reichart D., Du K., Pascual G., Tempst P., Rosenfeld M.G., Glass C.K., Kurokawa R. Induced ncRNAs allosterically modify RNA-binding proteins in cis to inhibit transcription. Nature. 2008;454:126–130. doi: 10.1038/nature06992. - DOI - PMC - PubMed
    1. Yoneda R., Suzuki S., Mashima T., Kondo K., Nagata T., Katahira M., Kurokawa R. The binding specificity of Translocated in LipoSarcoma/FUsed in Sarcoma with lncRNA transcribed from the promoter region of cyclin D1. Cell Biosci. 2016;6:4. doi: 10.1186/s13578-016-0068-8. - DOI - PMC - PubMed