. 2022 Mar 17;14(6):1538.
doi: 10.3390/cancers14061538.

In Vivo and In Vitro Enhanced Tumoricidal Effects of Metformin, Active Vitamin D3, and 5-Fluorouracil Triple Therapy against Colon Cancer by Modulating the PI3K/Akt/PTEN/mTOR Network

Affiliations

In Vivo and In Vitro Enhanced Tumoricidal Effects of Metformin, Active Vitamin D3, and 5-Fluorouracil Triple Therapy against Colon Cancer by Modulating the PI3K/Akt/PTEN/mTOR Network

Riyad Adnan Almaimani et al. Cancers (Basel). .

Abstract

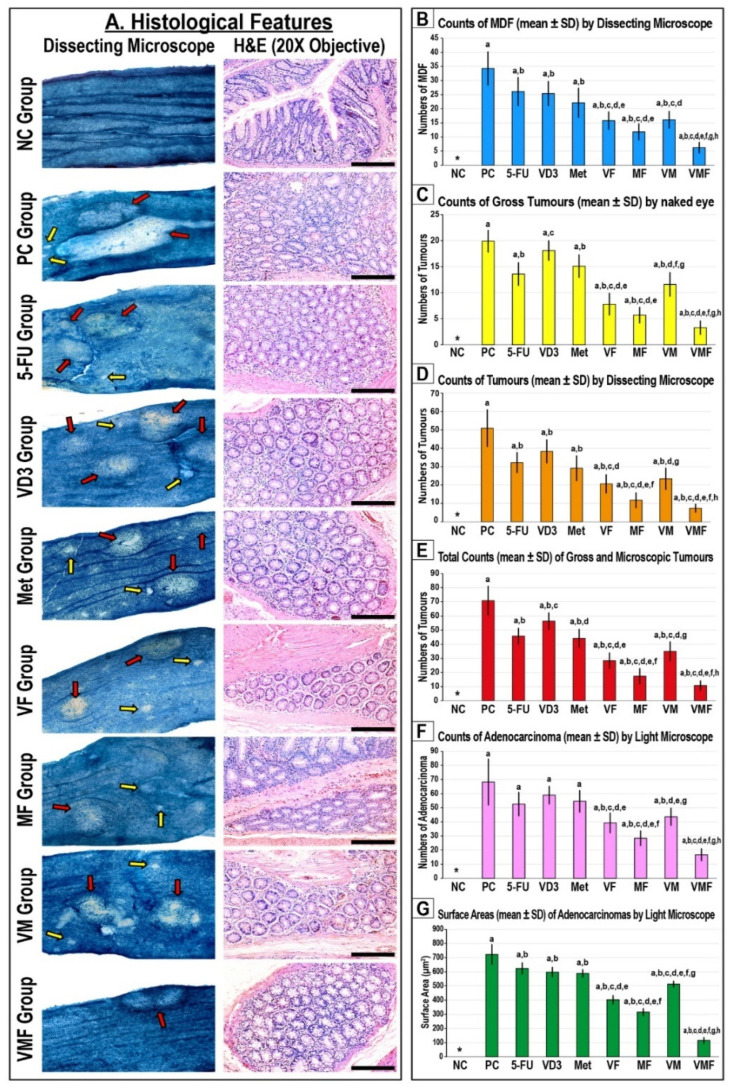
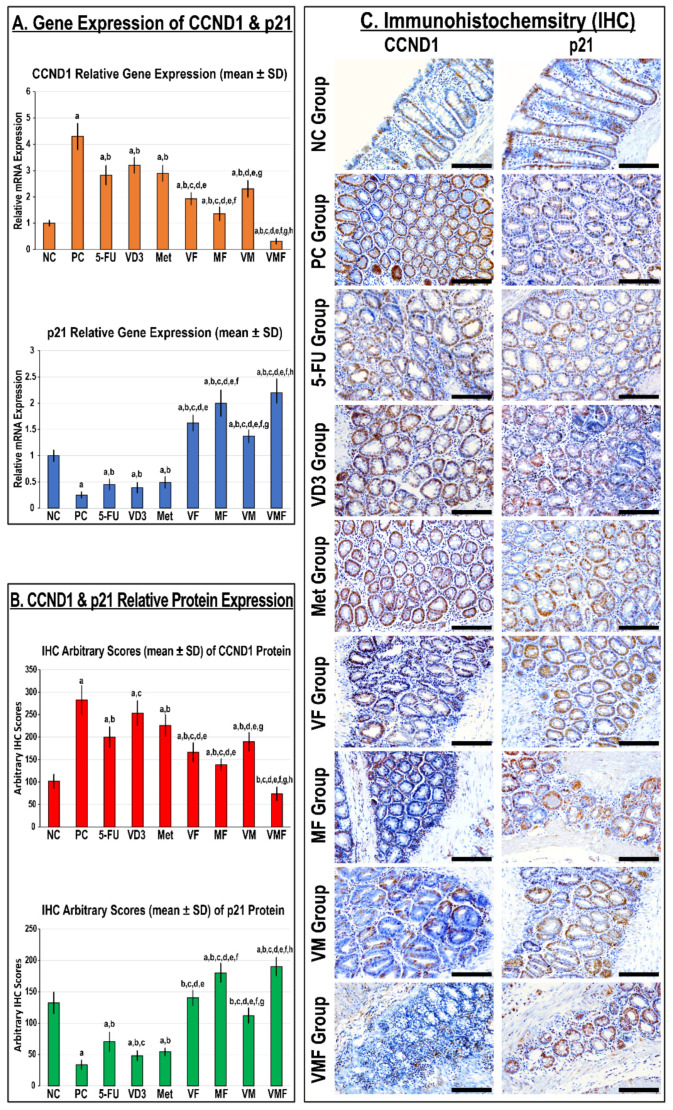
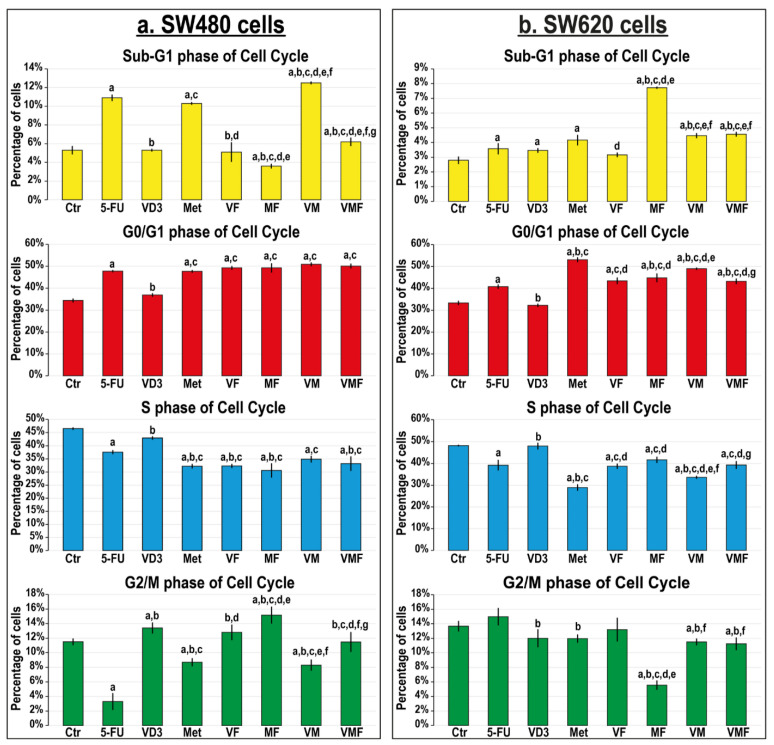
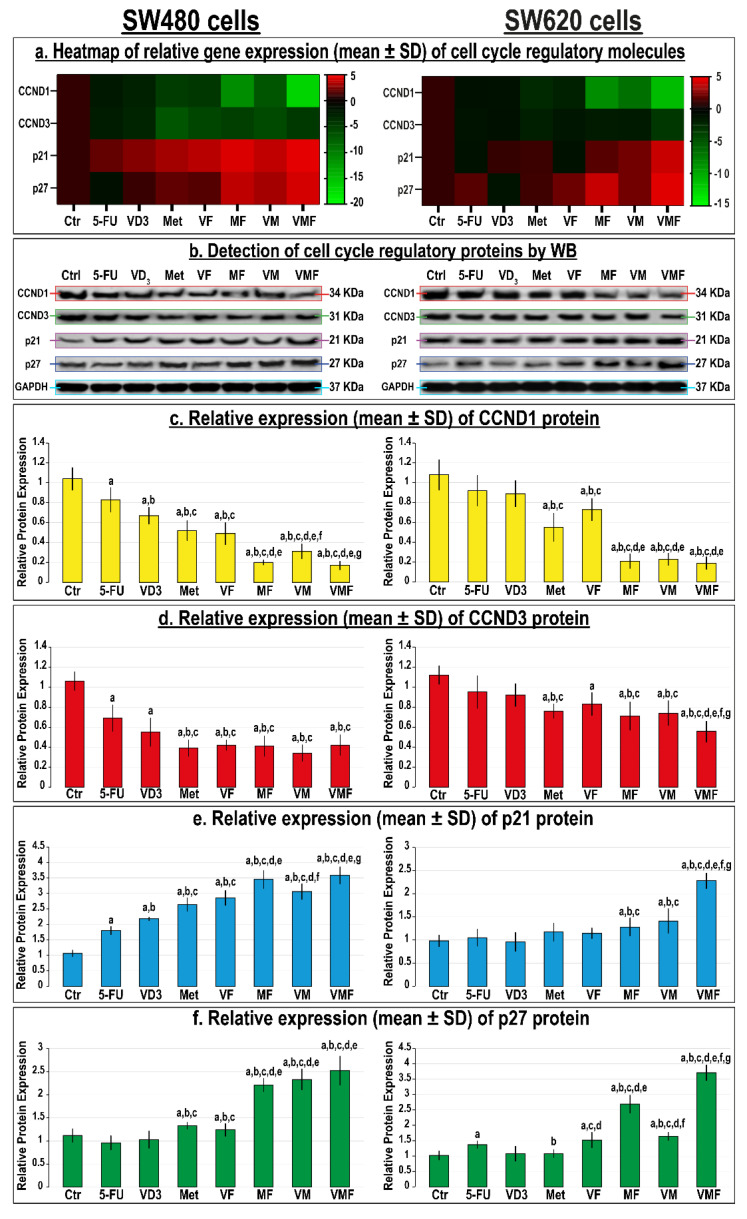
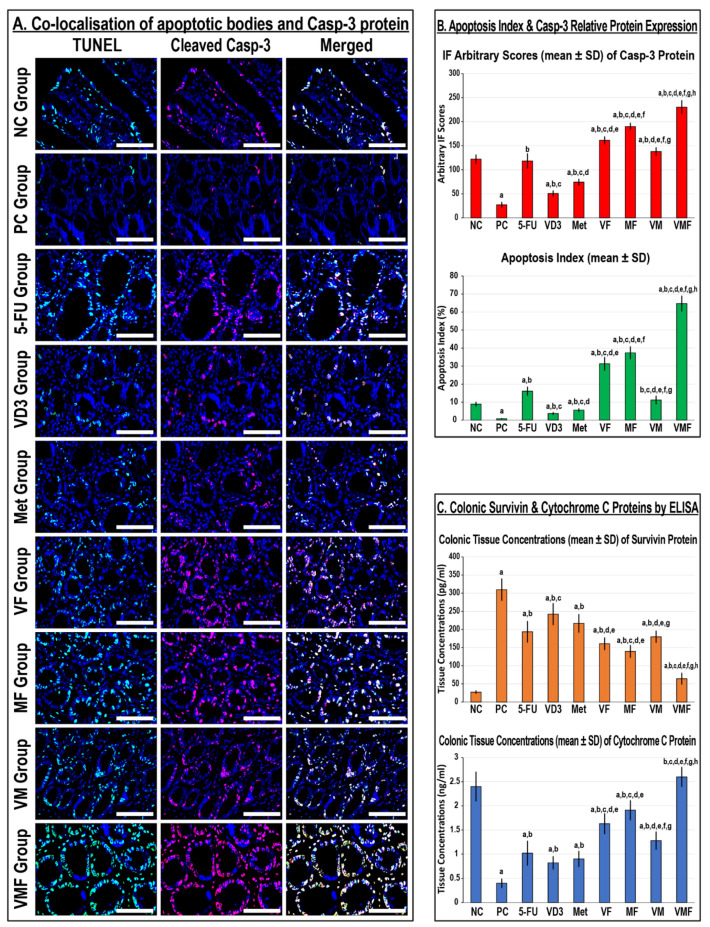
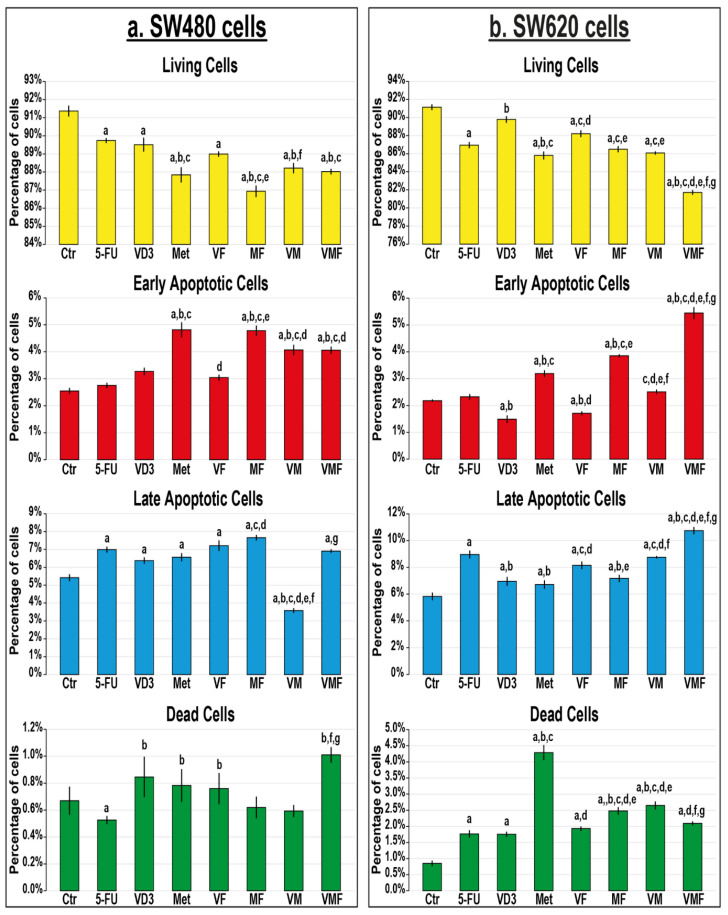
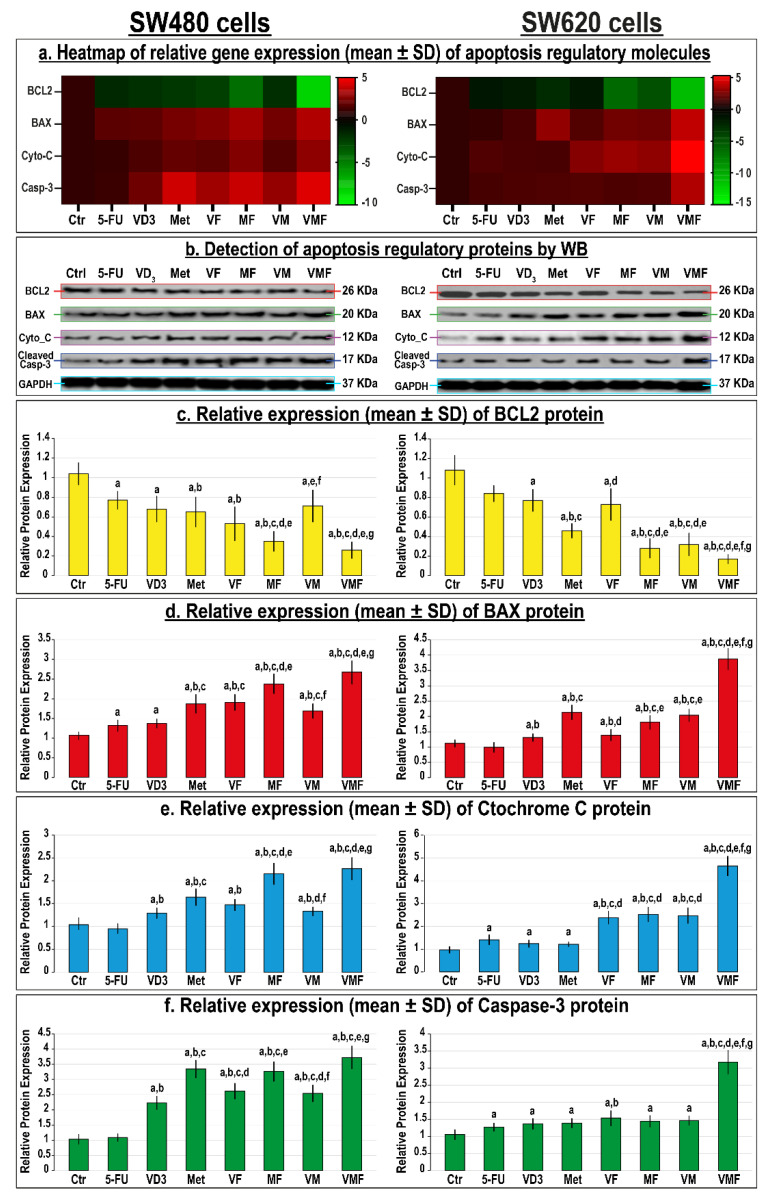
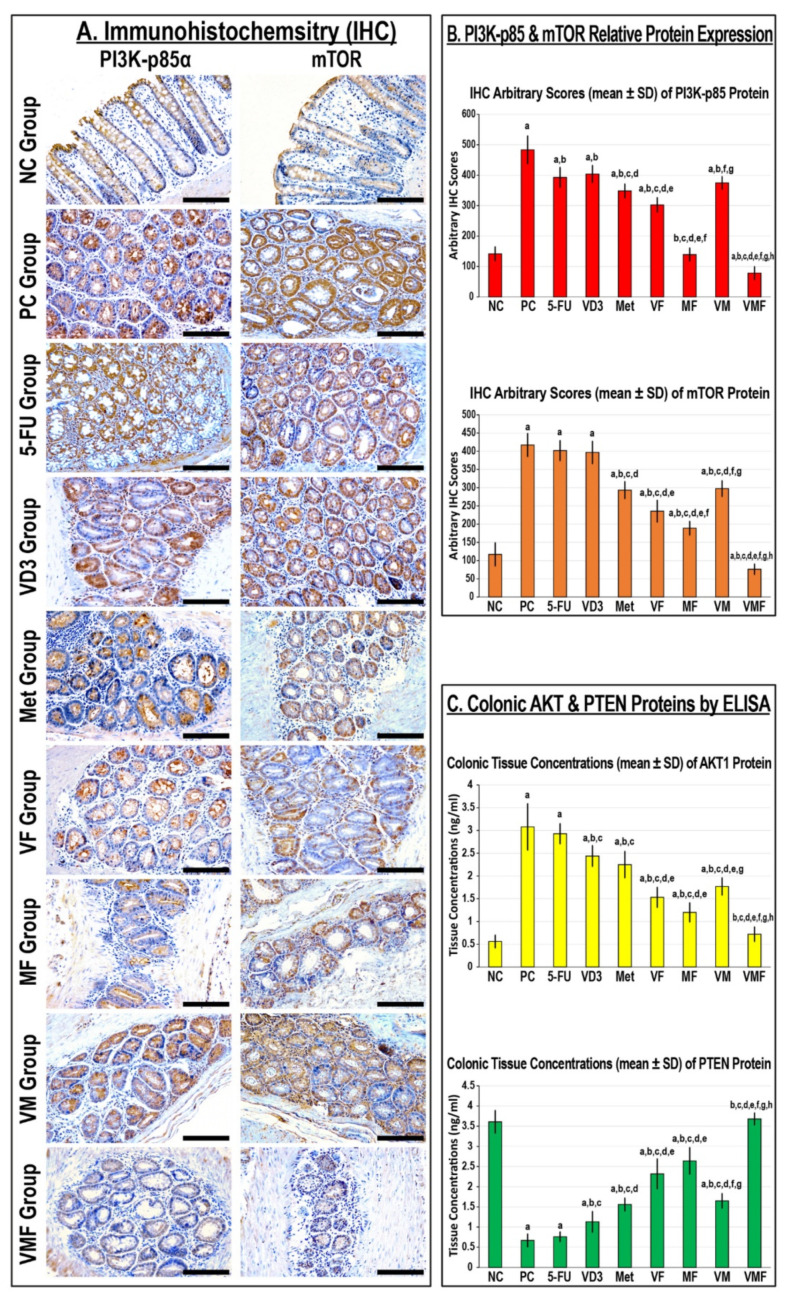
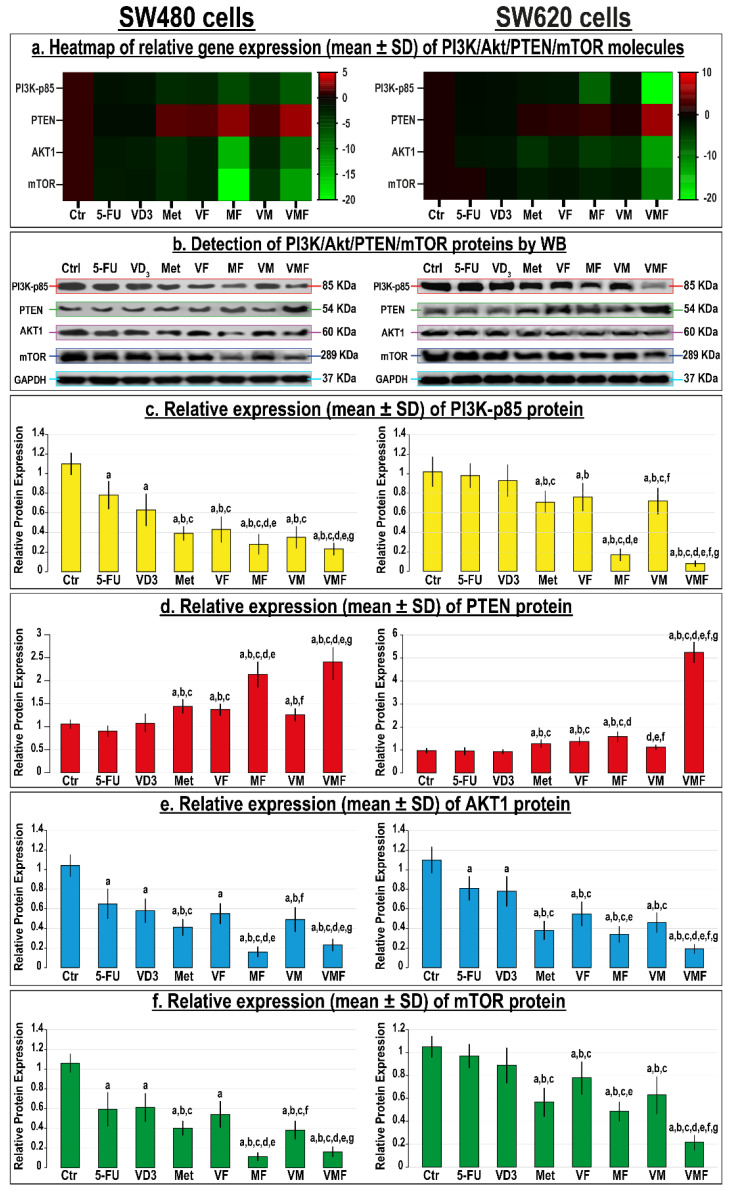
Chemoresistance to 5-fluorouracil (5-FU) is common during colorectal cancer (CRC) treatment. This study measured the chemotherapeutic effects of 5-FU, active vitamin D3 (VD3), and/or metformin single/dual/triple regimens as complementary/alternative therapies. Ninety male mice were divided into: negative and positive (PC) controls, and 5-FU, VD3, Met, 5-FU/VD3, 5-FU/Met, VD3/Met, and 5-FU/VD3/Met groups. Treatments lasted four weeks following CRC induction by azoxymethane. Similar regimens were also applied in the SW480 and SW620 CRC cell lines. The PC mice had abundant tumours, markedly elevated proliferation markers (survivin/CCND1) and PI3K/Akt/mTOR, and reduced p21/PTEN/cytochrome C/caspase-3 and apoptosis. All therapies reduced tumour numbers, with 5-FU/VD3/Met being the most efficacious regimen. All protocols decreased cell proliferation markers, inhibited PI3K/Akt/mTOR molecules, and increased proapoptotic molecules with an apoptosis index, and 5-FU/VD3/Met revealed the strongest effects. In vitro, all therapies equally induced G1 phase arrest in SW480 cells, whereas metformin-alone showed maximal SW620 cell numbers in the G0/G1 phase. 5-FU/Met co-therapy also showed the highest apoptotic SW480 cell numbers (13%), whilst 5-FU/VD3/Met disclosed the lowest viable SW620 cell percentages (81%). Moreover, 5-FU/VD3/Met revealed maximal inhibitions of cell cycle inducers (CCND1/CCND3), cell survival (BCL2), and the PI3K/Akt/mTOR molecules alongside the highest expression of cell cycle inhibitors (p21/p27), proapoptotic markers (BAX/cytochrome C/caspase-3), and PTEN in both cell lines. In conclusion, metformin monotherapy was superior to VD3, whereas the 5-FU/Met protocol showed better anticancer effects relative to the other dual therapies. However, the 5-FU/VD3/Met approach displayed the best in vivo and in vitro tumoricidal effects related to cell cycle arrest and apoptosis, justifiably by enhanced modulations of the PI3K/PTEN/Akt/mTOR pathway.

Keywords: apoptosis; calcitriol; cell cycle; chemoresistance; mammalian target of rapamycin; metformin; phosphatidylinositol-3-kinase; protein kinase B.


Conflict of interest statement

The authors declare no conflict of interest. The funders had no role in the design of the study; in the collection, analyses, or interpretation of data; in the writing of the manuscript; or in the decision to publish the results.

Figures

Figure 1
Figure 1
(A) Mouse colon mucosa from all the study groups under a dissecting microscope (n = 10 mice/group; ×20 magnification; red arrow = tumours; yellow arrow = mucin-depleted foci (MDF)) alongside colonic tissue sections from all groups by H&E stain (n = 10 mice/group; ×200 magnification; scale bar = 15 μm). Furthermore, the numbers of (B) MDF, (C) gross tumours, (D) microscopic tumours, (E) total tumours, and (F) adenocarcinomas alongside (G) the adenocarcinomas’ surface areas are shown as bar graphs (n = 10 mice/group; data were analysed by ANOVA followed by Games–Howell post hoc tests and are shown as the mean ± SD; * = not detected; a = p < 0.05 compared with the NC group; b = p < 0.05 compared with the PC group; c = p < 0.05 compared with 5-FU monotherapy; d = p < 0.05 compared VD3 monotherapy; e = p < 0.05 compared with Met monotherapy; f = p < 0.05 compared with VF dual therapy; g = p < 0.05 compared with MF dual therapy; and h = p < 0.05 compared with VM dual therapy). * = Not detected.
Figure 2
Figure 2
The relative (A) gene and (B) protein expression of CCND1 and p21 molecules in colonic tissues from the different groups is shown as bar graphs (n = 10 mice/group; data were analysed by ANOVA followed by Tukey’s HSD post hoc test and are shown as the mean ± SD; a = p < 0.05 compared with the NC group; b = p < 0.05 compared with the PC group; c = p < 0.05 compared with 5-FU monotherapy; d = p < 0.05 compared VD3 monotherapy; e = p < 0.05 compared with Met monotherapy; f = p < 0.05 compared with VF dual therapy; g = p < 0.05 compared with MF dual therapy; and h = p < 0.05 compared with VM dual therapy). (C) Localisation of CCND1 and p21 proteins by immunohistochemistry (IHC) in colonic tissues from the different groups (n = 10 mice/group; 20× objective; scale bar = 15 μm).
Figure 3
Figure 3
Percentages of cells (mean ± SD) in the different phases of the cell cycle in untreated control cells, and following treatments with 5-fluorouracil, calcitriol, and/or metformin single (5-FU, VD3, and Met), dual (VF, MF, and VM), and triple (VMF) therapies for 12 h in the (a) SW480 and (b) SW620 colon cancer cell lines (n = 3/group; data were analysed by ANOVA followed by Games–Howell post hoc tests and are shown as the mean ± SD; a = p < 0.05 compared with control untreated cells; b = p < 0.05 compared with 5-FU monotherapy; c = p < 0.05 compared VD3 monotherapy; d = p < 0.05 compared with Met monotherapy; e = p < 0.05 compared with VF dual therapy; f = p < 0.05 compared with MF dual therapy; and g = p < 0.05 compared with VM dual therapy).
Figure 4
Figure 4
(a) Heatmap showing relative mRNA expression (mean ± SD) of CCND1, CCND3, p21, and p27 genes alongside (b) detection of their proteins by Western blot and (cf) their relative protein expression (mean ± SD), following treatments with 5-fluorouracil, calcitriol, and/or metformin single (5-FU, VD3, and Met), dual (VF, MF, and VM), and triple (VMF) therapies for 12 h in the SW480 and SW620 colon cancer cell lines (n = 3/group; data were analysed by ANOVA followed by Games–Howell post hoc tests and are shown as the mean ± SD; a = p < 0.05 compared with control untreated cells; b = p < 0.05 compared with 5-FU monotherapy; c = p < 0.05 compared VD3 monotherapy; d = p < 0.05 compared with Met monotherapy; e = p < 0.05 compared with VF dual therapy; f = p < 0.05 compared with MF dual therapy; and g = p < 0.05 compared with VM dual therapy).
Figure 5
Figure 5
(A) Co-detection of apoptotic bodies by TUNEL (green) with cleaved Casp-3 (red) by immunofluorescence in the colonic tissues from all the study groups (n = 10 mice/group; 40× objective; scale bar = 8 µm). (B) The relative expression of the Casp-3 protein alongside the apoptosis index and (C) the colonic tissue concentrations of survivin and cytochrome C proteins from all groups are displayed as bar graphs (n = 10 mice/group; data were analysed by ANOVA followed by Tukey’s HSD test and are shown as the mean ± SD; a = p < 0.05 compared with the NC group; b = p < 0.05 compared with the PC group; c = p < 0.05 compared with 5-FU monotherapy; d = p < 0.05 compared VD3 monotherapy; e = p < 0.05 compared with Met monotherapy; f = p < 0.05 compared with VF dual therapy; g = p < 0.05 compared with MF dual therapy; and h = p < 0.05 compared with VM dual therapy).
Figure 6
Figure 6
Percentages (mean ± SD) of living, early and late apoptotic, and dead cells in untreated control cells, and following treatments with 5-fluorouracil, calcitriol, and/or metformin single (5-FU, VD3, and Met), dual (VF, MF, and VM), and triple (VMF) therapies for 12 h in the (a) SW480 and (b) SW620 colon cancer cell lines (n = 3/group; data were analysed by ANOVA followed by Games–Howell post hoc tests and are shown as the mean ± SD; a = p < 0.05 compared with control untreated cells; b = p < 0.05 compared with 5-FU monotherapy; c = p < 0.05 compared VD3 monotherapy; d = p < 0.05 compared with Met monotherapy; e = p < 0.05 compared with VF dual therapy; f = p < 0.05 compared with MF dual therapy; and g = p < 0.05 compared with VM dual therapy).
Figure 7
Figure 7
(a) Heatmap showing relative mRNA expression (mean ± SD) of BCL2, BAX, cytochrome C, and caspase-3 genes alongside (b) detection of their proteins by Western blot and (cf) their relative protein expression (mean ± SD) following treatments with 5-fluorouracil, calcitriol, and/or metformin single (5-FU, VD3, and Met), dual (VF, MF, and VM), and triple (VMF) therapies for 12 h in the SW480 and SW620 colon cancer cell lines (n = 3/group; data were analysed by ANOVA followed by Games–Howell post hoc tests and are shown as the mean ± SD; a = p < 0.05 compared with control untreated cells; b = p < 0.05 compared with 5-FU monotherapy; c = p < 0.05 compared VD3 monotherapy; d = p < 0.05 compared with Met monotherapy; e = p < 0.05 compared with VF dual therapy; f = p < 0.05 compared with MF dual therapy; and g = p < 0.05 compared with VM dual therapy).
Figure 8
Figure 8
Localisation of PI3K-p85α and mTOR proteins by immunohistochemistry (IHC) in colonic tissues from the different groups (20× objective; scale bar = 15 μm). (B) The relative protein expression of PI3K-p85α and mTOR and (C) the colonic tissue concentrations of Akt1 and PTEN proteins in the different study groups are displayed as bar graphs (n = 10 mice/group; data were analysed by ANOVA followed by Tukey’s HSD post hoc test and are shown as the mean ± SD; a = p < 0.05 compared with the NC group; b = p < 0.05 compared with the PC group; c = p < 0.05 compared with 5-FU monotherapy; d = p < 0.05 compared VD3 monotherapy; e = p < 0.05 compared with Met monotherapy; f = p < 0.05 compared with VF dual therapy; g = p < 0.05 compared with MF dual therapy; and h = p < 0.05 compared with VM dual therapy).
Figure 9
Figure 9
(a) Heatmap showing relative mRNA expression (mean ± SD) of PI3K-p85α, PTEN, Akt1, and mTOR genes alongside (b) detection of their proteins by Western blot and (cf) their relative protein expression (mean ± SD) following treatments with 5-fluorouracil, calcitriol, and/or metformin single (5-FU, VD3, and Met), dual (VF, MF, and VM), and triple (VMF) therapies for 12 h in the SW480 and SW620 colon cancer cell lines (n = 3/group; data were analysed by ANOVA followed by Games–Howell post hoc tests and are shown as the mean ± SD; a = p < 0.05 compared with control untreated cells; b = p < 0.05 compared with 5-FU monotherapy; c = p < 0.05 compared VD3 monotherapy; d = p < 0.05 compared with Met monotherapy; e = p < 0.05 compared with VF dual therapy; f = p < 0.05 compared with MF dual therapy; and g = p < 0.05 compared with VM dual therapy).

Similar articles

Cited by

References

    1. Sung H., Ferlay J., Siegel R.L., Laversanne M., Soerjomataram I., Jemal A., Bray F. Global Cancer Statistics 2020: GLOBOCAN Estimates of Incidence and Mortality Worldwide for 36 Cancers in 185 Countries. CA Cancer J. Clin. 2021;71:209–249. doi: 10.3322/caac.21660. - DOI - PubMed
    1. Bray F., Ferlay J., Soerjomataram I., Siegel R.L., Torre L.A., Jemal A. Global cancer statistics 2018: GLOBOCAN estimates of incidence and mortality worldwide for 36 cancers in 185 countries. CA Cancer J. Clin. 2018;68:394–424. doi: 10.3322/caac.21492. - DOI - PubMed
    1. Li Y., Wei J., Xu C., Zhao Z., You T. Prognostic significance of cyclin D1 expression in colorectal cancer: A meta-analysis of observational studies. PLoS ONE. 2014;9:e94508. doi: 10.1371/journal.pone.0094508. - DOI - PMC - PubMed
    1. Jakubowska K., Pryczynicz A., Dymicka-Piekarska V., Famulski W., Guzińska-Ustymowicz K. Immunohistochemical expression and serum level of survivin protein in colorectal cancer patients. Oncol. Lett. 2016;12:3591–3597. doi: 10.3892/ol.2016.5075. - DOI - PMC - PubMed
    1. Al-Maghrabi J., Al-Ahwal M., Buhmeida A., Syrjänen K., Sibyani A., Emam E., Ghanim A., Al-Qahtani M. Expression of cell cycle regulators p21 and p27 as predictors of disease outcome in colorectal carcinoma. J. Gastrointest. Cancer. 2012;43:279–287. doi: 10.1007/s12029-011-9292-y. - DOI - PubMed