. 2022 Mar 18;14(6):1551.
doi: 10.3390/cancers14061551.

Impact of Regorafenib on Endothelial Transdifferentiation of Glioblastoma Stem-like Cells

Affiliations

Impact of Regorafenib on Endothelial Transdifferentiation of Glioblastoma Stem-like Cells

Pauline Deshors et al. Cancers (Basel). .

Abstract

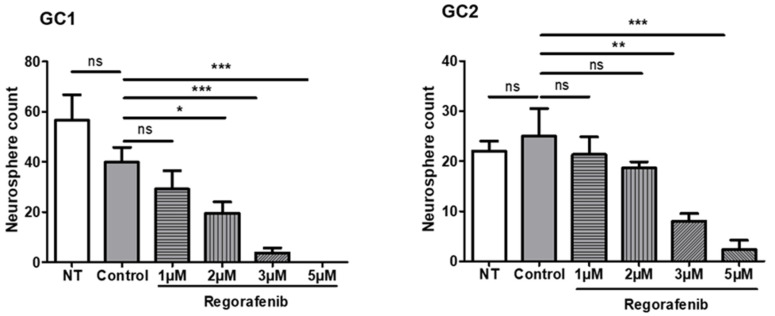
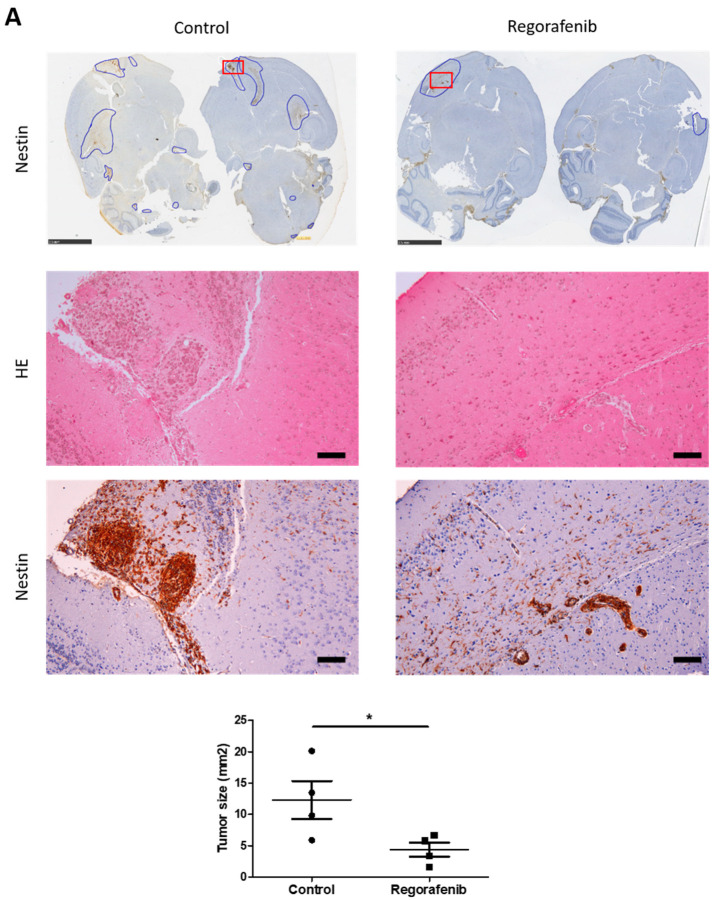
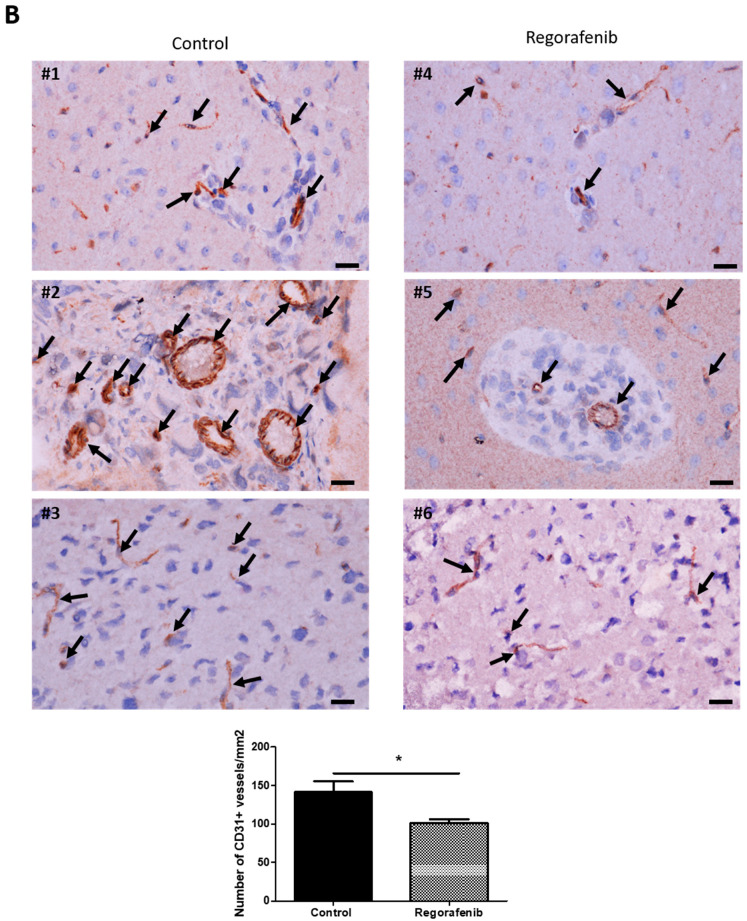
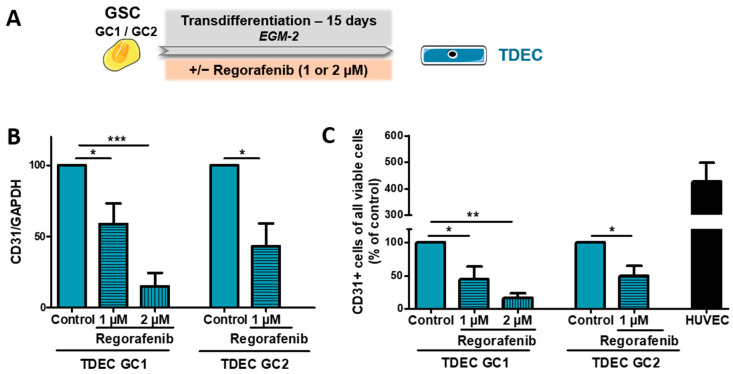
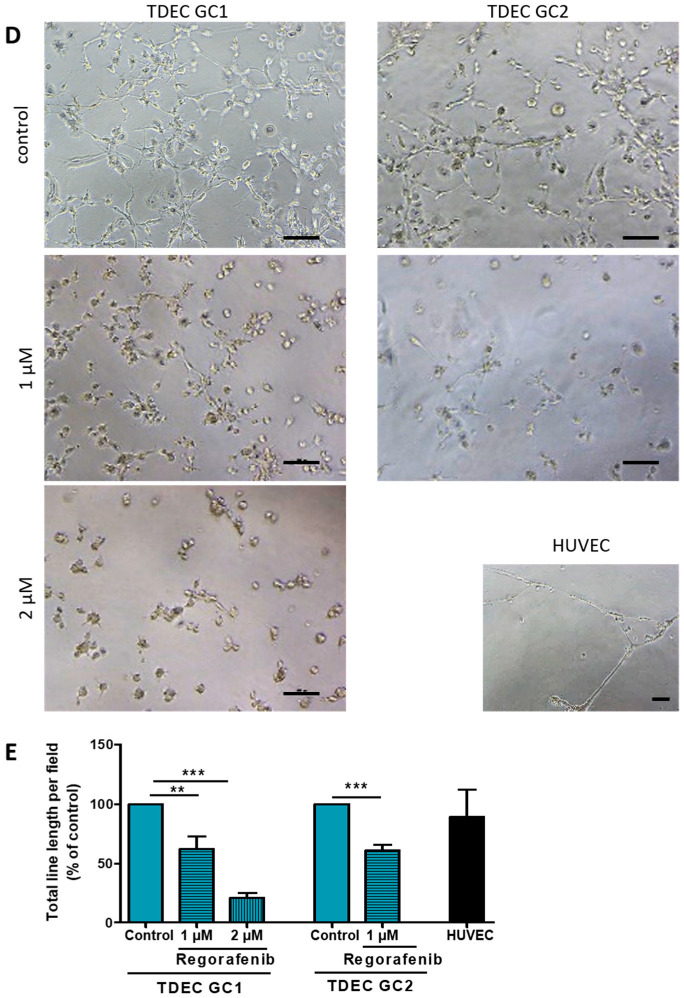
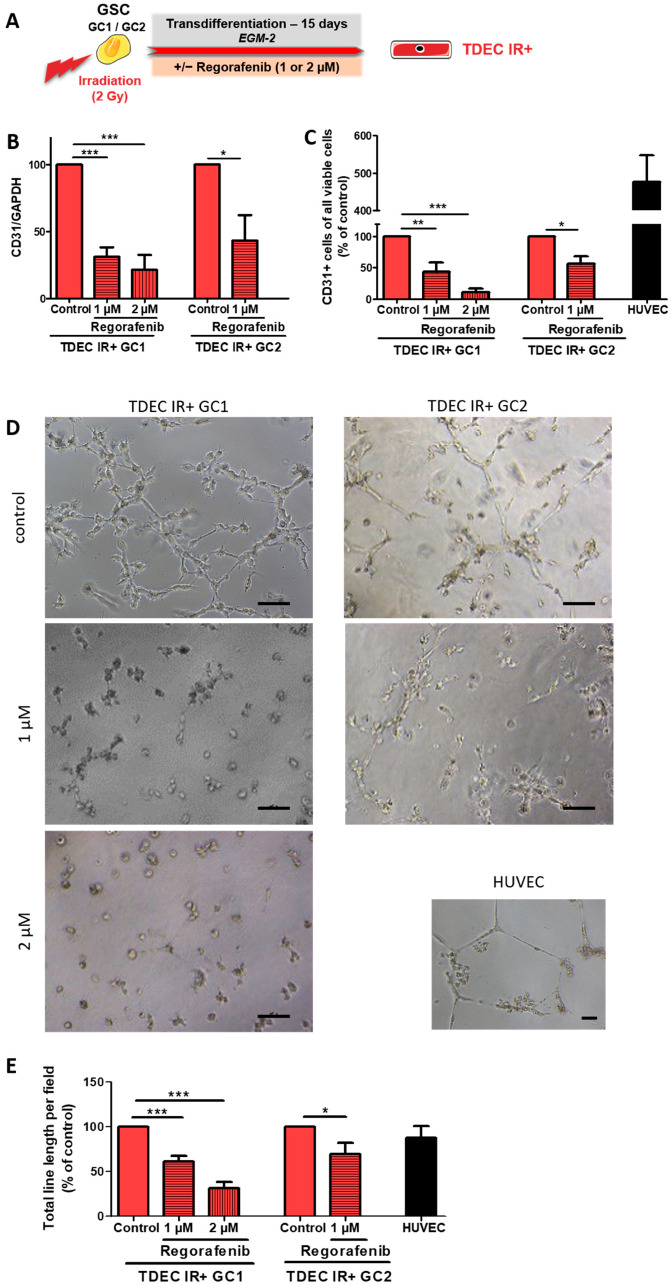
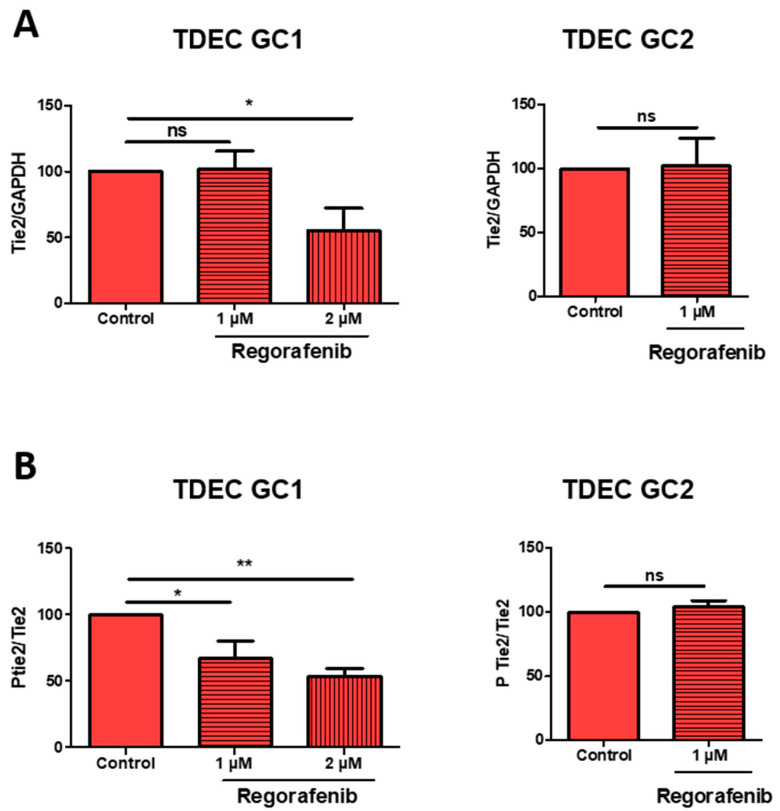
Glioblastomas (GBM) are aggressive brain tumours with a poor prognosis despite heavy therapy that combines surgical resection and radio-chemotherapy. The presence of a subpopulation of GBM stem cells (GSC) contributes to tumour aggressiveness, resistance and recurrence. Moreover, GBM are characterised by abnormal, abundant vascularisation. Previous studies have shown that GSC are directly involved in new vessel formation via their transdifferentiation into tumour-derived endothelial cells (TDEC) and that irradiation (IR) potentiates the pro-angiogenic capacity of TDEC via the Tie2 signalling pathway. We therefore investigated the impact of regorafenib, a multikinase inhibitor with anti-angiogenic and anti-tumourigenic activity, on GSC and TDEC obtained from irradiated GSC (TDEC IR+) or non-irradiated GSC (TDEC). Regorafenib significantly decreases GSC neurosphere formation in vitro and inhibits tumour formation in the orthotopic xenograft model. Regorafenib also inhibits transdifferentiation by decreasing CD31 expression, CD31+ cell count, pseudotube formation in vitro and the formation of functional blood vessels in vivo of TDEC and TDEC IR+. All of these results confirm that regorafenib clearly impacts GSC tumour formation and transdifferentiation and may therefore be a promising therapeutic option in combination with chemo/radiotherapy for the treatment of highly aggressive brain tumours.

Keywords: glioblastoma; glioblastoma stem-like cells; ionising radiation; regorafenib; transdifferentiation; tumour-derived endothelial cells.


Conflict of interest statement

The authors declare no conflict of interest.

Figures

Figure 1
Figure 1
Regorafenib inhibits neurosphere formation in vitro. After dissociation, 250 cells/well, each GSC line was placed in 96-well plates and exposed to different doses of regorafenib (0 (vehicle only known as the control), 1, 2, 3, 5 µM) or without regorafenib (NT: not treated) in stem cell medium. The number of neurospheres was counted in each well after incubating for 7 days at 37 °C. The results are expressed as the mean ± SEM of at least three independent experiments. ns: not significant; * p < 0.05; ** p < 0.01; *** p < 0.001.
Figure 2
Figure 2
Regorafenib inhibits tumour growth and vascularisation in xenograft mice. GC1 were implanted into the right forebrain of mice. The mice then received daily oral vehicle or regorafenib at 30 mg/kg for 45 days. (A) Representative photographs of mice brain tumours treated with regorafenib (right panel) or without regorafenib (left panel) stained by hemalun–eosin (median panel) or with nestin antibody (upper and lower panel). The upper panel shows whole brains of mice stained with nestin antibody. The tumour areas were circled in blue, and each surface was measured in mm2. The red rectangles indicate the zone of the tumour shown in median (hemalun–eosin staining) and lower (nestin IHC) panel. Scale bars, upper panel 2.5 mm, median and lower panel 100 µm. The graph shows the tumour size in mm2 (expressed as the mean ± SEM of 4 mice). (B) Representative immunohistochemistry photographs of CD31+ vessels in brain tumour areas of 3 different mice treated with regorafenib (right panel) or without regorafenib (control, left panel). Arrows indicate CD31+ blood vessels. Scale bars, 20 µm. The graph shows the number of CD31+ vessels in tumours per mm2 (expressed as mean ± SEM of 4 mice). * p < 0.05.
Figure 2
Figure 2
Regorafenib inhibits tumour growth and vascularisation in xenograft mice. GC1 were implanted into the right forebrain of mice. The mice then received daily oral vehicle or regorafenib at 30 mg/kg for 45 days. (A) Representative photographs of mice brain tumours treated with regorafenib (right panel) or without regorafenib (left panel) stained by hemalun–eosin (median panel) or with nestin antibody (upper and lower panel). The upper panel shows whole brains of mice stained with nestin antibody. The tumour areas were circled in blue, and each surface was measured in mm2. The red rectangles indicate the zone of the tumour shown in median (hemalun–eosin staining) and lower (nestin IHC) panel. Scale bars, upper panel 2.5 mm, median and lower panel 100 µm. The graph shows the tumour size in mm2 (expressed as the mean ± SEM of 4 mice). (B) Representative immunohistochemistry photographs of CD31+ vessels in brain tumour areas of 3 different mice treated with regorafenib (right panel) or without regorafenib (control, left panel). Arrows indicate CD31+ blood vessels. Scale bars, 20 µm. The graph shows the number of CD31+ vessels in tumours per mm2 (expressed as mean ± SEM of 4 mice). * p < 0.05.
Figure 3
Figure 3
Regorafenib inhibits GSC transdifferentiation into TDEC in vitro. (A) GSC isolated from 2 patients (GC1 and GC2) were cultured in EGM-2 for 15 days in order to obtain TDEC (TDEC GC1 and TDEC GC2). (B) Immunoblot of CD31 in TDEC GC1 and TDEC GC2 with or without 1 or 2 µM of regorafenib. The graph shows the protein expression ratio normalised to TDEC obtained from each GSC and not treated with regorafenib (control). (C) Flow cytometric analysis of CD31 expression in TDEC obtained from GC1 and GC2 with or without regorafenib. The level of CD31 positive cells is expressed as the mean ± SEM normalised to TDEC obtained from each GSC and not treated with regorafenib (control). HUVEC is shown here as a positive control of CD31 expression. (D,E) Pseudotube formation assay. (D) Representative photographs of pseudotubes formed by TDEC GC1or TDEC GC2 treated or not with regorafenib. HUVEC is shown here as a positive control of pseudotube formation. Scale bars, 100 µm. (E) The graph shows the mean ± SEM of the total line length per field determined by quantification of at least 3 fields per well, normalised to TDEC obtained from each GSC and not treated with regorafenib (control). HUVEC is shown here as a positive control of pseudotube formation; * p < 0.05; ** p < 0.01; *** p < 0.001.
Figure 3
Figure 3
Regorafenib inhibits GSC transdifferentiation into TDEC in vitro. (A) GSC isolated from 2 patients (GC1 and GC2) were cultured in EGM-2 for 15 days in order to obtain TDEC (TDEC GC1 and TDEC GC2). (B) Immunoblot of CD31 in TDEC GC1 and TDEC GC2 with or without 1 or 2 µM of regorafenib. The graph shows the protein expression ratio normalised to TDEC obtained from each GSC and not treated with regorafenib (control). (C) Flow cytometric analysis of CD31 expression in TDEC obtained from GC1 and GC2 with or without regorafenib. The level of CD31 positive cells is expressed as the mean ± SEM normalised to TDEC obtained from each GSC and not treated with regorafenib (control). HUVEC is shown here as a positive control of CD31 expression. (D,E) Pseudotube formation assay. (D) Representative photographs of pseudotubes formed by TDEC GC1or TDEC GC2 treated or not with regorafenib. HUVEC is shown here as a positive control of pseudotube formation. Scale bars, 100 µm. (E) The graph shows the mean ± SEM of the total line length per field determined by quantification of at least 3 fields per well, normalised to TDEC obtained from each GSC and not treated with regorafenib (control). HUVEC is shown here as a positive control of pseudotube formation; * p < 0.05; ** p < 0.01; *** p < 0.001.
Figure 4
Figure 4
Regorafenib inhibits irradiation-induced transdifferentiation in vitro. (A) GSC isolated from 2 patients (GC1 and GC2) were irradiated (2Gy) and then cultured in EGM-2 for 15 days in order to obtain TDEC IR+ (TDEC IR+ GC1 and TDEC IR+ GC2). (B) Immunoblot of CD31 in TDEC IR+ GC1 and TDEC IR+ GC2 with or without 1 or 2 µM of regorafenib. The graph shows the protein expression ratio normalised to TDEC IR+ obtained from each GSC without regorafenib (control). (C) Flow cytometric analysis of CD31 expression in TDEC IR+ obtained from GC1 and GC2, with or without regorafenib. The level of CD31 positive cells is expressed as the mean ± SEM normalised to TDEC IR+ obtained from each GSC without regorafenib (control). HUVEC is shown here as a positive control of CD31 expression. (D,E) Pseudotube formation assay. (D) Representative photographs of pseudotubes formed by TDEC IR+ GC1or TDEC IR+ GC2 treated or not with regorafenib. HUVEC is shown here as a positive control of pseudotube formation. Scale bars, 100 µm. (E) The graph shows the mean ± SEM of the total line length per field determined by quantification of at least 3 fields per well normalised to TDEC IR+ obtained from each GSC and not treated with regorafenib (control). HUVEC is shown here as a positive control of pseudotube formation; * p < 0.05; ** p < 0.01; *** p < 0.001.
Figure 5
Figure 5
High-dose regorafenib decreases Tie expression and phosphorylation in TDEC IR+. (A) Immunoblot of Tie2 in TDEC IR+ GC1 and TDEC IR+ GC2 with or without 1 or 2 µM of regorafenib. Blots were quantified and the graphs show the protein expression ratio normalised to TDEC IR+ obtained from each GSC without regorafenib (control). (B) Ptie2/Tie expression ratio evaluated by immunoblot. The graphs show the protein expression ratio normalised to TDEC IR+ obtained from each GSC without regorafenib (control); * p < 0.05; ** p < 0.01.
Figure 6
Figure 6
Regorafenib inhibits GSC-mediated conventional and irradiation-induced transdifferentiation in vivo. MatrigelTM plug assay. (A) Representative trichrome Masson sections of Matrigel plugs with TDEC obtained from non-irradiated GC1 (left photos) or irradiated GC1 (right photos) with (lower panel) or without (upper panel) regorafenib. The black arrows indicate functional blood vessels. Scale bars, 100 µm. (B) Quantification of functional blood vessels in Matrigel TM plugs/mm2. The number of vessels/mm2 was expressed as the mean ± SEM of 5 mice for untreated TDEC IR-, TDEC IR- treated with regorafenib and TDEC IR+ treated with regorafenib and of 4 untreated TDEC IR+ mice; * p < 0.05; *** p < 0.001.

Similar articles

Cited by

References

    1. Louis D.N., Ohgaki H., Wiestler O.D., Cavenee W.K. World Health Organization Histological Classifications of Tumours of the Central Nervous System. 4th ed. IARC Press; Lyon, France: 2016. - PubMed
    1. Stupp R., Mason W.P., Van Den Bent M.J., Weller M., Fisher B., Taphoorn M.J., Belanger K., Brandes A.A., Marosi C., Bogdahn U., et al. Radiotherapy plus Concomitant and Adjuvant Temozolomide for Glioblastoma. N. Engl. J. Med. 2005;352:987–996. doi: 10.1056/NEJMoa043330. - DOI - PubMed
    1. Stupp R., Hegi M.E., Mason W.P. Effects of radiotherapy with concomitant and adjuvant temozolomide versus radiotherapy alone on survival in glioblastoma in a randomised phase III study: 5-year analysis of the EORTC-NCIC trial. Lancet Oncol. 2009;10:8. doi: 10.1016/S1470-2045(09)70025-7. - DOI - PubMed
    1. Tang D.G. Understanding cancer stem cell heterogeneity and plasticity. Cell Res. 2012;22:457–472. doi: 10.1038/cr.2012.13. - DOI - PMC - PubMed
    1. Nduom E.K.-E., Hadjipanayis C.G., Van Meir E.G. Glioblastoma Cancer Stem-Like Cells: Implications for Pathogenesis and Treatment. Cancer J. 2012;18:100–106. doi: 10.1097/PPO.0b013e3182452e0d. - DOI - PMC - PubMed

Grants and funding