. 2022 Mar 18;14(6):1554.
doi: 10.3390/cancers14061554.

CDK6 Degradation Is Counteracted by p16INK4A and p18INK4C in AML

Affiliations

CDK6 Degradation Is Counteracted by p16INK4A and p18INK4C in AML

Belinda S Schmalzbauer et al. Cancers (Basel). .

Abstract

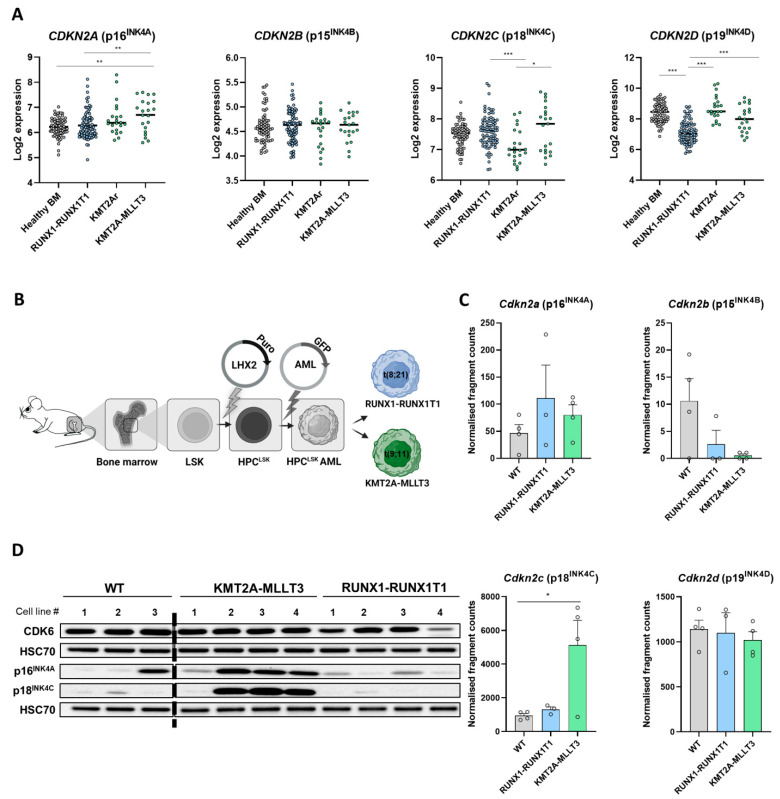
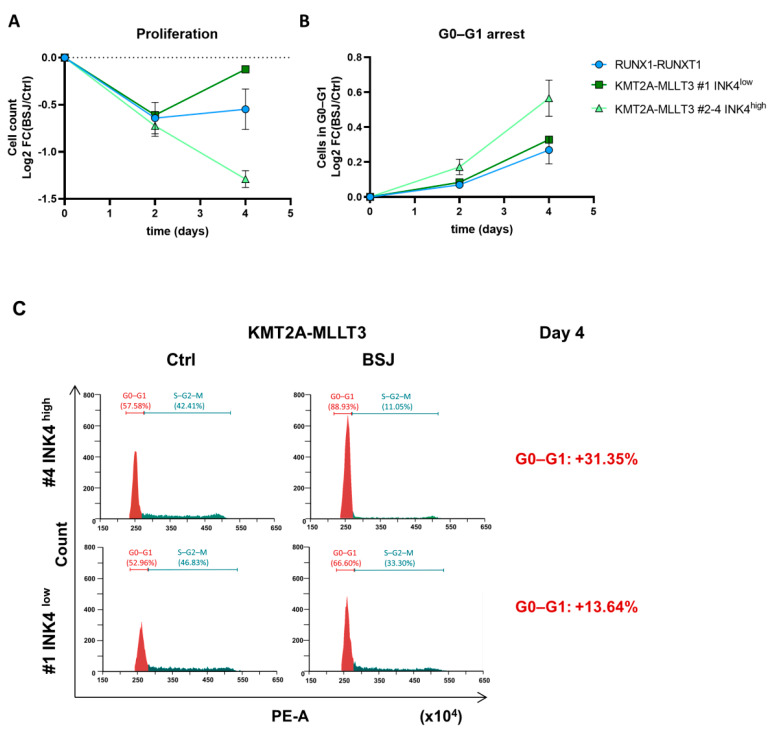
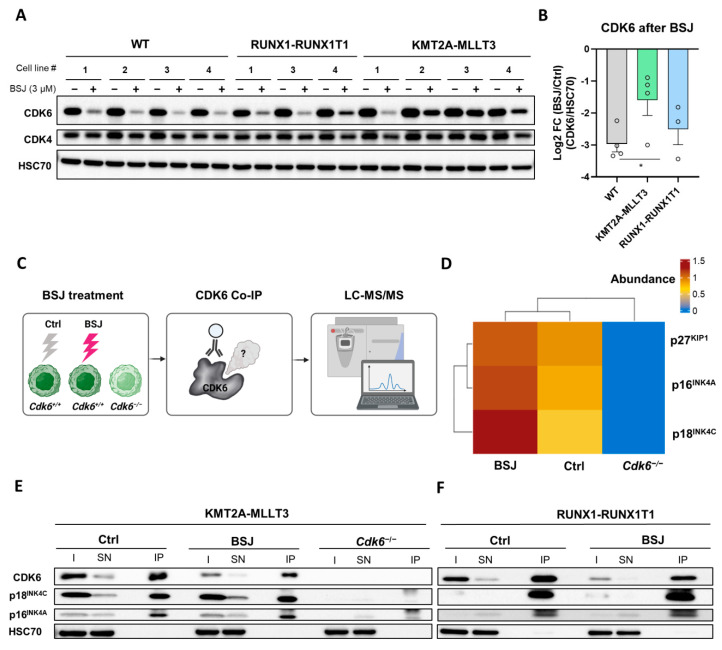
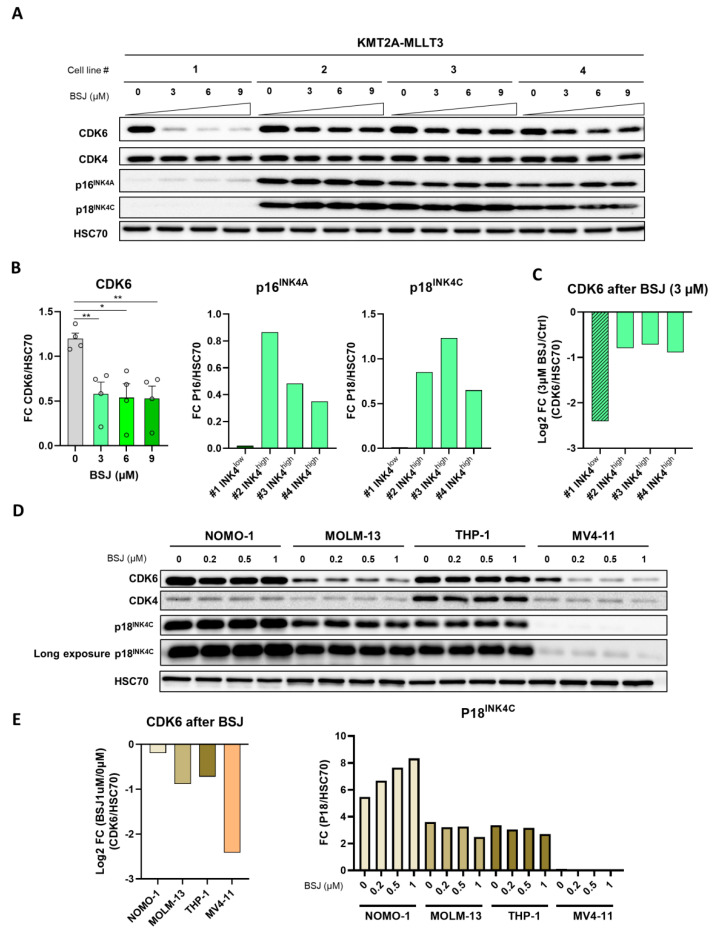
Cyclin-dependent kinase 6 (CDK6) represents a novel therapeutic target for the treatment of certain subtypes of acute myeloid leukaemia (AML). CDK4/6 kinase inhibitors have been widely studied in many cancer types and their effects may be limited by primary and secondary resistance mechanisms. CDK4/6 degraders, which eliminate kinase-dependent and kinase-independent effects, have been suggested as an alternative therapeutic option. We show that the efficacy of the CDK6-specific protein degrader BSJ-03-123 varies among AML subtypes and depends on the low expression of the INK4 proteins p16INK4A and p18INK4C. INK4 protein levels are significantly elevated in KMT2A-MLLT3+ cells compared to RUNX1-RUNX1T1+ cells, contributing to the different CDK6 degradation efficacy. We demonstrate that CDK6 complexes containing p16INK4A or p18INK4C are protected from BSJ-mediated degradation and that INK4 levels define the proliferative response to CDK6 degradation. These findings define INK4 proteins as predictive markers for CDK6 degradation-targeted therapies in AML.

Keywords: AML; CDK6; Cdkn2a; Cdkn2c; INK4; degrader; p16; p18.


Conflict of interest statement

The authors declare no conflict of interest.

Figures

Figure 1
Figure 1
INK4 protein levels differ among AML subtypes. (A) The RNA expressions of INK4 genes from human AML patient microarray datasets were analysed: healthy bone marrow, BM (n = 74); RUNX1-RUNX1T1, t(8;21) (n = 86); KMT2A rearrangements, KMT2Ar (11q23) (n = 22); KMT2A-MLLT3, t(9;11) (n = 21). The KMT2Ar contained no KMT2A-MLLT3 samples. The line represents the median; * FDR < 0.05; ** FDR < 0.01; *** FDR < 0.001. (B) A schematic representation of experimental procedure. Murine bone marrow cells were isolated and immortalised with an LHX2 plasmid vector for generating HPCLSK lines. HPCLSK cells were then transformed by the integration of human RUNX1-RUNX1T1 t(8;21) (GFP) or KMT2A-MLLT3 t(9;11) (Venus) plasmid vectors. (C) The RNA expression of INK4 genes in the HPCLSK WT (n = 4), RUNX1-RUNX1T1+ (n = 3) and KMT2A-MLLT3+ (n = 4) cells taken from a RNA sequencing dataset: * p = 0.0299. (D) The immunoblot of the different biological replicates of HPCLSK WT (n = 3), KMT2A-MLLT3+ (n = 4) and RUNX1-RUNX1T1+ (n = 4) cells detecting CDK6, p16INK4A and p18INK4C. HSC70 served as a loading control. The uncropped immunoblots are depicted in Figure S5 and the densitometry quantification is presented in Figure S1D.
Figure 2
Figure 2
Delayed cell cycle re-entry in AML cells with high INK4 levels after BSJ treatment. (A) The flow cytometry analysis of RUNX1-RUNX1T1+ (n = 3), KMT2A-MLLT3+ INK4low (n = 1) and INK4high (n = 3) cells. The cell number measurements are depicted as the log2 FC (BSJ/control) calculation after two and four days of treatment with 3 µM of BSJ. (B) The flow cytometry analysis of cell cycle phases using propidium iodide (PI). The G0–G1 phase of RUNX1-RUNX1T1+ (n = 3), KMT2A-MLLT3+ INK4low (n = 1) and INK4high (n = 3) cells is depicted as the log2 FC (BSJ/control) calculation after two and four days of treatment with 3 µM of BSJ. (C) The exemplary cell cycle profiles that were analysed by the PI staining of KMT2A-MLLT3+ #4 INK4high (top panel) and #1 INK4low cells (bottom panel) at day four of treatment with 3 µM of BSJ (right-hand panel) or vehicle control (left-hand panel). The gating strategy is indicated in the histogram plots. The change of the percentage of cells in the G0–G1 phase after BSJ treatment is highlighted on the right-hand side of the graphs.
Figure 3
Figure 3
CDK6-INK4 complexes were enriched after BSJ treatment. (A) The immunoblot for the CDK6 and CDK4 levels of HPCLSK WT (n = 4), RUNX1-RUNX1T1+ (n = 3) and KMT2A-MLLT3+ (n = 4) cells treated with 3 µM of BSJ or vehicle control for four days. HSC70 served as a loading control. The original, uncropped immunoblots are depicted in Figure S5. The densitometry is depicted in (B) and Figure S3A. (B) The log2FC (BSJ/control) calculation of the immunoblot densitometry quantification from (A) (CDK6/HSC70): * p < 0.05. (C) A schematic representation of the experimental procedure. KMT2A-MLLT3+ cells were treated with 3 µM of BSJ or vehicle control for 24 h. A KMT2A-MLLT3+ Cdk6−/− cell line was used as the negative control. Cell protein lysates were co-immunoprecipitated (Co-IP) with an anti-CDK6 antibody and complexes were analysed by LC-MS/MS to identify any CDK6 interaction partners that were present in the untreated sample or were enriched after BSJ treatment. (D) A heat map depicting the abundances of INK4 and KIP1 proteins in the BSJ and control samples. The enrichments of the proteins over the background were calculated as the log2 fold changes (log2FC) of the normalised abundances of the control or BSJ over the Cdk6−/−. (E) An anti-CDK6 Co-IP was performed on KMT2A-MLLT3+ cell lysates from 24 h treatments with 3 µM of BSJ or vehicle control. Cdk6−/− cells served as the negative control. The input (I), supernatant (SN) and immunoprecipitate (IP) fractions were immunoblotted for CD K6, p18INK4C and p16INK4A. HSC70 served as the loading control. The immunoblot densitometry quantification is depicted in Figure S3F. The original, uncropped immunoblots are depicted in Figure S5. (F) An anti-CDK6 Co-IP was performed on RUNX1-RUNX1T1+ cell lysates from 24 h treatments with 3 µM of BSJ or vehicle control. The input (I), supernatant (SN) and immunoprecipitate (IP) fractions were immunoblotted for CDK6, p18INK4C and p16INK4A. HSC70 served as the loading control. The immunoblot densitometry quantification is depicted in Figure S3G. The original, uncropped immunoblots are depicted in Figure S5.
Figure 4
Figure 4
BSJ efficacy predicted by INK4 levels. (A) The immunoblot for CDK6, CDK4, p16INK4A, p18INK4C and HSC70 in KMT2A-MLLT3+ cells (n = 4) treated with increasing concentrations (3 µM, 6 µM and 9 µM) of BSJ or vehicle control for four days. The original, uncropped immunoblots are depicted in Figure S5. The densitometry quantification is depicted in (B,C) and Figure S4C,D. (B) The immunoblot densitometry quantification from (A) of CDK6, p16INK4A and p18INK4C normalised to HSC70 (left) and P16INK4A and p18INK4C quantification normalised to the HSC70 of KMT2A-MLLT3 control samples grouped into INK4low and INK4high (middle and right): * p < 0.05; ** p < 0.01. The densitometry of CDK4 is depicted in Figure S4D. (C) Log2 FC (BSJ/control) calculated from the CDK6/HSC70 immunoblot quantification from the KMT2A-MLLT3+ samples grouped into INK4low and INK4high. (D) The immunoblot for CDK6, CDK4 and p18INK4C and the short and long exposure and HSC70 of human AML cell lines that were positive for KMT2A-MLLT3 (NOMO-1, MOLM-13 and THP-1) or KMT2A-AFF1 (MV4-11) and were treated with increasing concentrations of BSJ (0.2 µM, 0.5 µM and 1 µM) or vehicle control for 90 min. The original, uncropped immunoblots are depicted in Figure S5. The densitometry quantification is depicted in (E) and Figure S4E,F. (E) Log2 FC (BSJ/control) of the immunoblot densitometry quantification from (D) calculated from the human AML cell lines that were treated with 1 µM of BSJ (left). The immunoblot quantification of the p18INK4C levels normalised to HSC70 from the human AML cell lines that were treated with increasing concentrations of BSJ (0.2 µM, 0.5 µM and 1 µM) or vehicle control for 90 min and the densitometry for CDK4 and CDK6 is depicted in Figure S4E.

References

    1. Kirtonia A., Pandya G., Sethi G., Pandey A.K., Das B.C., Garg M. A comprehensive review of genetic alterations and molecular targeted therapies for the implementation of personalized medicine in acute myeloid leukemia. J. Mol. Med. 2020;98:1069–1091. doi: 10.1007/s00109-020-01944-5. - DOI - PubMed
    1. Meyers R.M., Bryan J.G., McFarland J.M., Weir B.A., Sizemore A.E., Xu H., Dharia N.V., Montgomery P.G., Cowley G.S., Pantel S., et al. Computational correction of copy number effect improves specificity of CRISPR-Cas9 essentiality screens in cancer cells. Nat. Genet. 2017;49:1779–1784. doi: 10.1038/ng.3984. - DOI - PMC - PubMed
    1. Brand M., Jiang B., Bauer S., Donovan K.A., Liang Y., Wang E.S., Nowak R.P., Yuan J.C., Zhang T., Kwiatkowski N., et al. Homolog-Selective Degradation as a Strategy to Probe the Function of CDK6 in AML. Cell Chem. Biol. 2019;26:300–306. doi: 10.1016/j.chembiol.2018.11.006. - DOI - PMC - PubMed
    1. Liu W., Yi J.M., Liu Y., Chen C., Zhang K.X., Zhou C., Zhan H.E., Zhao L., Morales S., Zhao X.L., et al. CDK6 Is a Potential Prognostic Biomarker in Acute Myeloid Leukemia. Front. Genet. 2020;11:600227. doi: 10.3389/fgene.2020.600227. - DOI - PMC - PubMed
    1. Uras I.Z., Sexl V., Kollmann K. CDK6 Inhibition: A Novel Approach in AML Management. Int. J. Mol. Sci. 2020;21:2528. doi: 10.3390/ijms21072528. - DOI - PMC - PubMed