. 2022 Mar 18;14(6):1564.
doi: 10.3390/cancers14061564.

Metabolic Profiling of Thymic Epithelial Tumors Hints to a Strong Warburg Effect, Glutaminolysis and Precarious Redox Homeostasis as Potential Therapeutic Targets

Affiliations

Metabolic Profiling of Thymic Epithelial Tumors Hints to a Strong Warburg Effect, Glutaminolysis and Precarious Redox Homeostasis as Potential Therapeutic Targets

Mohammad Alwahsh et al. Cancers (Basel). .

Abstract

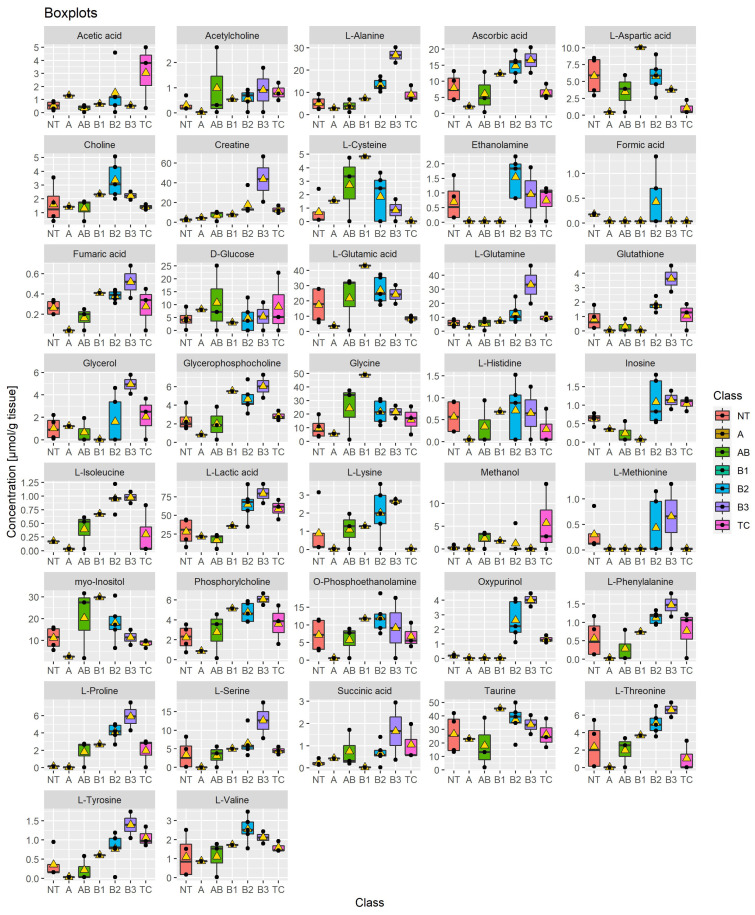
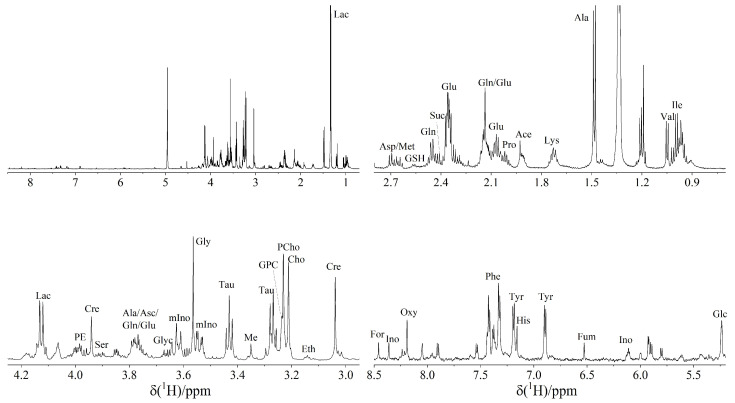
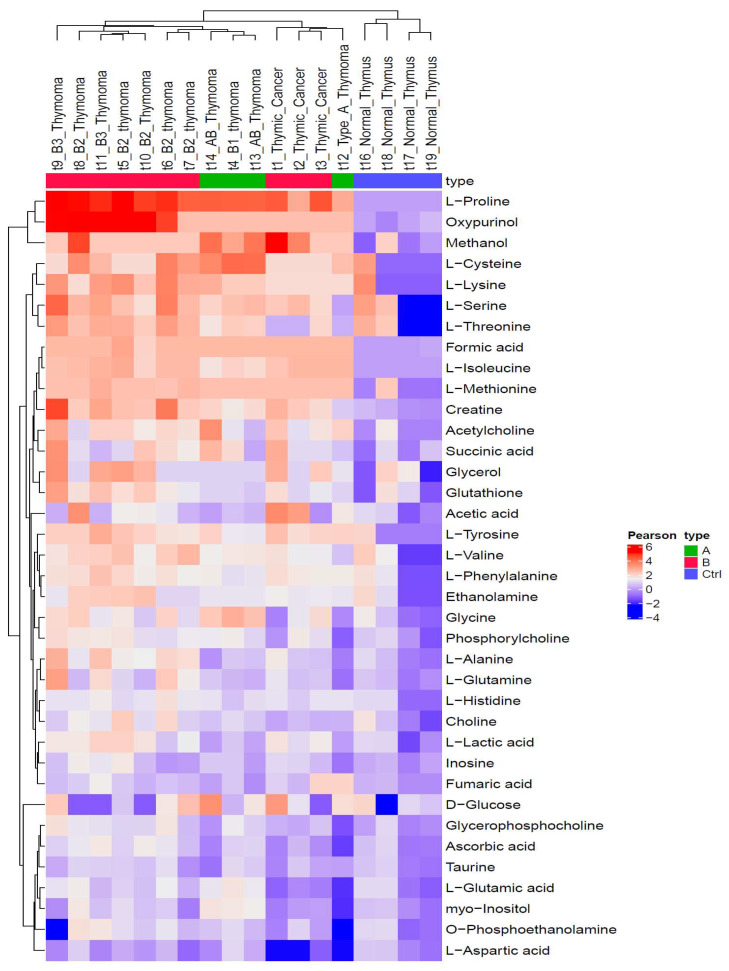
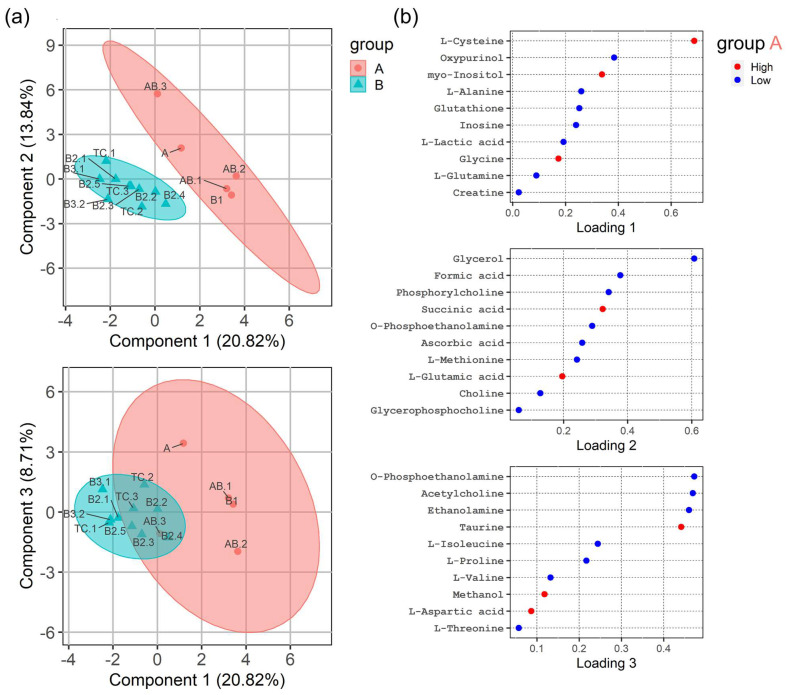
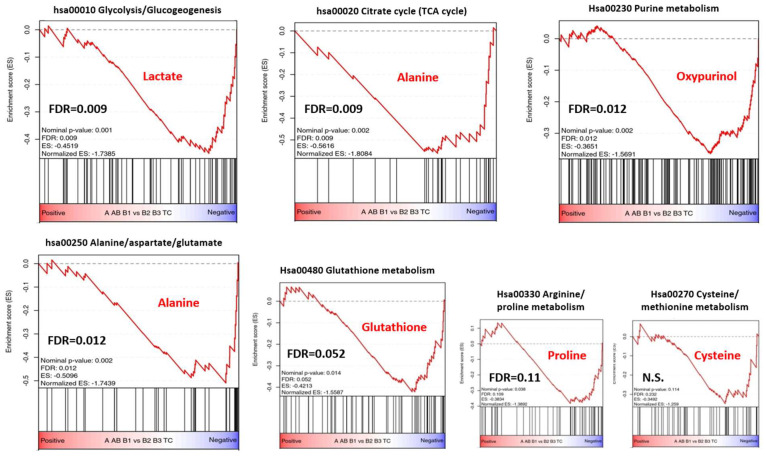
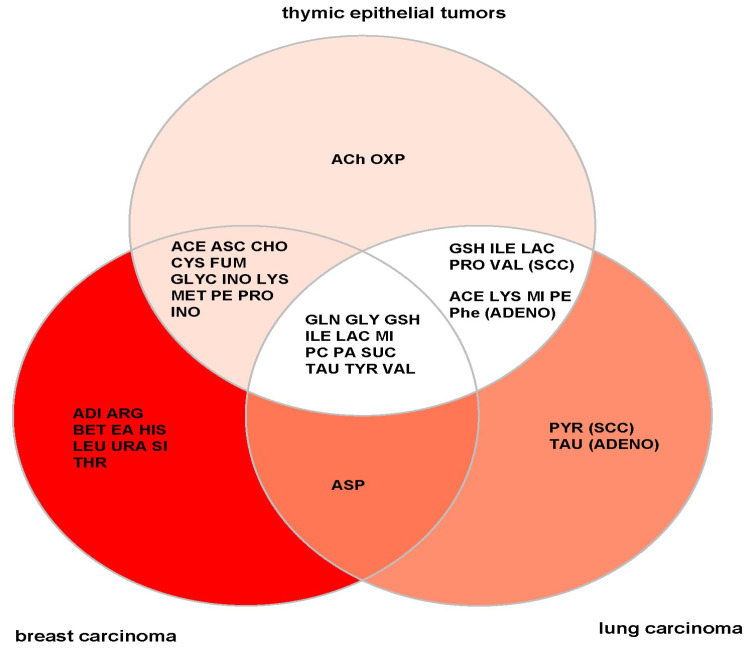
Thymomas and thymic carcinomas (TC) are malignant thymic epithelial tumors (TETs) with poor outcome, if non-resectable. Metabolic signatures of TETs have not yet been studied and may offer new therapeutic options. Metabolic profiles of snap-frozen thymomas (WHO types A, AB, B1, B2, B3, n = 12) and TCs (n = 3) were determined by high resolution magic angle spinning 1H nuclear magnetic resonance (HRMAS 1H-NMR) spectroscopy. Metabolite-based prediction of active KEGG metabolic pathways was achieved with MetPA. In relation to metabolite-based metabolic pathways, gene expression signatures of TETs (n = 115) were investigated in the public "The Cancer Genome Atlas" (TCGA) dataset using gene set enrichment analysis. Overall, thirty-seven metabolites were quantified in TETs, including acetylcholine that was not previously detected in other non-endocrine cancers. Metabolite-based cluster analysis distinguished clinically indolent (A, AB, B1) and aggressive TETs (B2, B3, TCs). Using MetPA, six KEGG metabolic pathways were predicted to be activated, including proline/arginine, glycolysis and glutathione pathways. The activated pathways as predicted by metabolite-profiling were generally enriched transcriptionally in the independent TCGA dataset. Shared high lactic acid and glutamine levels, together with associated gene expression signatures suggested a strong "Warburg effect", glutaminolysis and redox homeostasis as potential vulnerabilities that need validation in a large, independent cohort of aggressive TETs. If confirmed, targeting metabolic pathways may eventually prove as adjunct therapeutic options in TETs, since the metabolic features identified here are known to confer resistance to cisplatin-based chemotherapy, kinase inhibitors and immune checkpoint blockers, i.e., currently used therapies for non-resectable TETs.

Keywords: HRMAS 1H-NMR; biomarker; metabolomics; thymic carcinoma; thymoma.


Conflict of interest statement

The authors declared no potential conflicts of interest in terms of the research, authorship, and/or publication of this article.

Figures

Figure 1
Figure 1
Boxplots showing the concentrations (y-axis) of the 37 metabolites found in normal thymi (NT, n = 4), thymomas (A, AB, B1, B2, B3, n = 12) and thymic carcinomas (TC, n = 3). The black bars show the respective median of a distribution, while the yellow triangles show the respective average. Each box is drawn from the 25th to the 75th percentile. Please note that the scale of the y-axis was adapted to the concentration range and is therefore different among the different metabolites.
Figure 2
Figure 2
Representative 1D HRMAS 1H-NMR spectrum of a B2 thymoma measured at a tissue temperature of 4 °C and referenced to the internal standard, TSP (3-trimethylsilylpropionic-2,2,3,3-d4-acid sodium salt), full spectrum (upper left) and three expansions. Abbreviations: Ace: acetate, Ala: alanine, Asc: ascorbate, Asp: aspartate, Cho: choline, Cre: creatine, Eth: ethanolamine, For: formiate, Fum: fumaric acid, Glc: glucose, Glu: glutamate, Gln: glutamine, GSH: glutathione, GPC: glycerophosphocholine; Glyc: glycine, His: histidine, Ile: isoleucine, Ino: inosin, Lac: lactate, Leu: leucine, Lys: lysine, Met: methionine, mIno: myo-inositol; Oxy: oxypurinol, PCho: O-phosphocholine, PE: O-phosphoethanolamine, Phe: phenylalanine; Pro: proline, Ser: serine, Succ: succinate, Tau: taurine, Tyr: tyrosine, Val: valine.
Figure 3
Figure 3
Heatmap with identified metabolites in thymic epithelial tumors (TETs): Hierarchical clustering analysis (HCA) was performed on 37 standardized, log2-transformed values of metabolites from 14 of the 15 TETs (1 A, 3 AB, 1 B1, 5 B2, 2 B3 thymomas and 3 thymic carcinomas, TC) and 4 non-neoplastic thymi (NT). One AB thymoma was exempt from the analysis since all metabolite concentration were extremely low or even zero, resulting in graphical over representation of this sample. To create the heatmap, the values of the raw data from Table S4 were log2 transformed and then the value of each metabolite was standardized (subtracted) with the respective mean value of the log2 transformed values of the normal thymi. Note that aggressive thymomas (B2, B3 thymomas) and TCs form distinct clusters. Note: t1, t19, t3, etc. are the internal labels of the samples as used in the excel sheet with the metabolite levels as provided in the Supplement Materials (Table S4).
Figure 4
Figure 4
(a) sPLS-DA scores plot (3 components) showing clustering between indolent (group A) and aggressive (group B) thymic epithelial tumors (TETs). 95% confidence intervals are given in red (indolent group) and turquois (aggressive group). Top: Component 1 against component 2. Bottom: Component 1 against component 3. (b) sPLS-DA loadings plots for components 1 (top), 2 (middle) and 3 (bottom) showing upregulation and downregulations of metabolites for indolent TETs (upregulation is shown in red, downregulation in blue). The naming of the triangles and dots refers to the different tumor cases given in Table 1, for example B2.3 means the third B2 thymoma case from the top as listed in Table 1.
Figure 5
Figure 5
Gene set enrichment analysis (GSEA) of the indicated KEGG pathways comparing transcriptomic profiles of the group of indolent (A1, AB, and B1 thymomas) and aggressive thymic epithelial tumors (TETs) (B2 and B3 thymomas and thymic carcinomas, TC) as extracted from the TCGA, PanCancer Atlas dataset. Corresponding “key metabolites” identified in the HRMAS 1H-NMR-based analysis (Table 2) are given in red. Alanine as “key metabolite” was assumed to be functionally linked to two KEGG pathways: The TCA cycle and the alanine/aspartate/glutamate pathway. In addition to the Hsa00270 Cysteine/methionine pathway, the Hsa00260 Glycine/serine/threonine pathway (not shown) was also not enriched. Of note, the selection of the purine metabolism pathway in relation to high oxyurinol levels is only a hypothesis, since it is unknown whether oyxpurinol is an endogenous metabolite of purine metabolism or derived from an unknown food ingredient (we excluded allopurinol as a source of oxypurinol in the respective patients through clinical history). FDR, false detection rate.
Figure 6
Figure 6
Venn diagram illustrating the metabolite distribution in breast cancer [48], thymic epithelial tumors (TETs) (this study) and lung cancer [55]. Note that most detected metabolites in TETs were also present in lung and breast cancers. Only acetylcholine (ACh) and oxypurinol (OXP) are ‘unique’ metabolites of TETs. The ‘unique’ metabolites of squamous cell (SCC) lung carcinoma and adenocarcinoma (adeno) of the lung were pyruvate (PYR) and taurine (TAU), respectively.

Similar articles

Cited by

References

    1. Marx A., Chan J.K.C., Chalabreysse L., Dacic S., Detterbeck F., French C.A., Hornick J.L., Inagaki H., Jain D., Lazar A.J., et al. The 2021 WHO Classification of Tumors of the Thymus and Mediastinum: What Is New in Thymic Epithelial, Germ Cell, and Mesenchymal Tumors? J. Thorac. Oncol. 2021;17:200–213. doi: 10.1016/j.jtho.2021.10.010. - DOI - PubMed
    1. Petrini I., Meltzer P.S., Kim I.-K., Lucchi M., Park K.-S., Fontanini G., Gao J., Zucali A.P., Calabrese F., Favaretto A., et al. A specific missense mutation in GTF2I occurs at high frequency in thymic epithelial tumors. Nat. Genet. 2014;46:844–849. doi: 10.1038/ng.3016. - DOI - PMC - PubMed
    1. Belharazem D., Grass A., Paul C., Vitacolonna M., Schalke B., Rieker R.J., Körner D., Jungebluth P., Simon-Keller K., Hohenberger P., et al. Increased cFLIP expression in thymic epithelial tumors blocks autophagy via NF-κB signalling. Oncotarget. 2017;8:89580–89594. doi: 10.18632/oncotarget.15929. - DOI - PMC - PubMed
    1. Radovich M., Pickering C.R., Felau I., Ha G., Zhang H., Jo H., Hoadley K.A., Anur P., Zhang J., McLellan M., et al. The Integrated Genomic Landscape of Thymic Epithelial Tumors. Cancer Cell. 2018;33:244–258.e10. doi: 10.1016/j.ccell.2018.01.003. - DOI - PMC - PubMed
    1. Yamada Y., Weis C.-A., Thelen J., Sticht C., Schalke B., Ströbel P., Marx A. Thymoma Associated Myasthenia Gravis (TAMG): Differential Expression of Functional Pathways in Relation to MG Status in Different Thymoma Histotypes. Front. Immunol. 2020;11:664. doi: 10.3389/fimmu.2020.00664. - DOI - PMC - PubMed

LinkOut - more resources