. 2022 Mar 21;14(6):1586.
doi: 10.3390/cancers14061586.

Prometastatic Effect of ATX Derived from Alveolar Type II Pneumocytes and B16-F10 Melanoma Cells

Affiliations

Prometastatic Effect of ATX Derived from Alveolar Type II Pneumocytes and B16-F10 Melanoma Cells

Mélanie A Dacheux et al. Cancers (Basel). .

Abstract

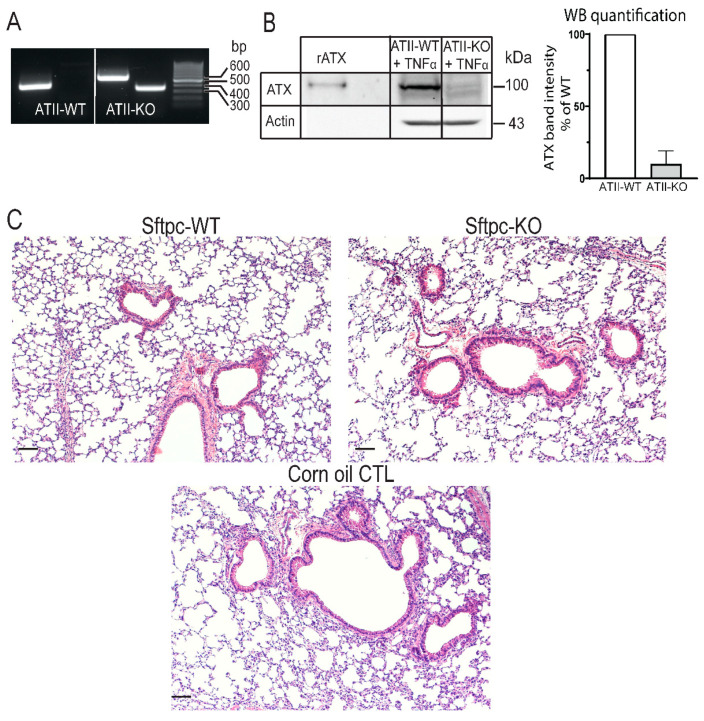
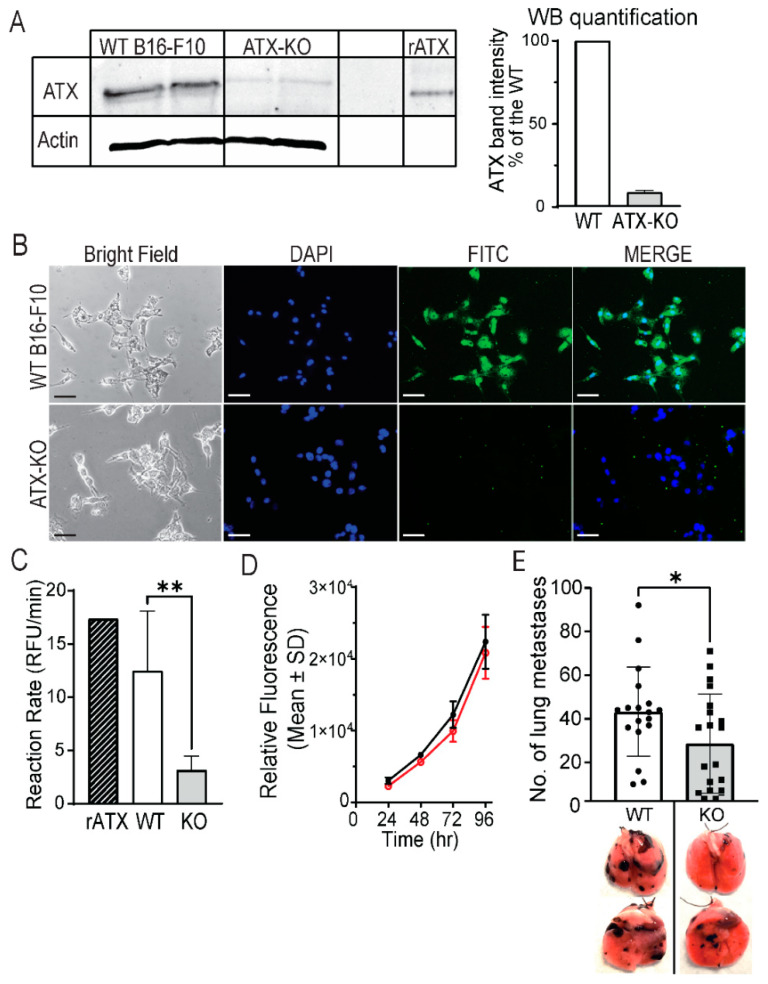
Although metastases are the principal cause of cancer-related deaths, the molecular aspects of the role of stromal cells in the establishment of the metastatic niche remain poorly understood. One of the most prevalent sites for cancer metastasis is the lungs. According to recent research, lung stromal cells such as bronchial epithelial cells and resident macrophages secrete autotaxin (ATX), an enzyme with lysophospholipase D activity that promotes cancer progression. In fact, several studies have shown that many cell types in the lung stroma could provide a rich source of ATX in diseases. In the present study, we sought to determine whether ATX derived from alveolar type II epithelial (ATII) pneumocytes could modulate the progression of lung metastasis, which has not been evaluated previously. To accomplish this, we used the B16-F10 syngeneic melanoma model, which readily metastasizes to the lungs when injected intravenously. Because B16-F10 cells express high levels of ATX, we used the CRISPR-Cas9 technology to knock out the ATX gene in B16-F10 cells, eliminating the contribution of tumor-derived ATX in lung metastasis. Next, we used the inducible Cre/loxP system (Sftpc-CreERT2/Enpp2fl/fl) to generate conditional knockout (KO) mice in which ATX is specifically deleted in ATII cells (i.e., Sftpc-KO). Injection of ATX-KO B16-F10 cells into Sftpc-KO or Sftpc-WT control littermates allowed us to investigate the specific contribution of ATII-derived ATX in lung metastasis. We found that targeted KO of ATX in ATII cells significantly reduced the metastatic burden of ATX-KO B16-F10 cells by 30% (unpaired t-test, p = 0.028) compared to Sftpc-WT control mice, suggesting that ATX derived from ATII cells could affect the metastatic progression. We detected upregulated levels of cytokines such as IFNγ (unpaired t-test, p < 0.0001) and TNFα (unpaired t-test, p = 0.0003), which could favor the increase in infiltrating CD8+ T cells observed in the tumor regions of Sftpc-KO mice. Taken together, our results highlight the contribution of host ATII cells as a stromal source of ATX in the progression of melanoma lung metastasis.

Keywords: B16-F10; alveolar type II cells; autotaxin; lysophosphatidic acid; melanoma; metastasis; tumor immunity; tumor microenvironment.


Conflict of interest statement

The authors declare no conflict of interest.

Figures

Figure 1
Figure 1
In vitro characterization of Sftpc-WT and Sftpc-KO mice. (A) Agarose electrophoresis of PCR-amplified Enpp2 allele of ATII cells isolated from Sftpc-WT (lanes 1 and 2) and Sftpc-KO (lanes 3 and 4) mice, treated in vivo with TAM (100 mg/kg/day for 5 days). The size of the Enpp2 WT allele is 441 bp, Enpp2 floxed allele is 540 bp, and Enpp2 deleted allele is 370 bp. The PCR product from ATII cells isolated from Sftpc-WT mouse showed a band corresponding to Enpp2 WT allele (lane 1) and no Enpp2 deleted allele was detected (lane 2). In contrast, ATII cells isolated from Sftpc-KO mouse showed a floxed allele (lane 3) and a deleted Enpp2 allele (lane 4). (B) WB analysis of cell lysates from ATII cells from Sftpc-WT mice (lane 2) and Sftpc-KO mice (lane 3) treated with TAM. Recombinant ATX (rATX, lane 1) was used as a positive control. Two weeks post-TAM treatment, ATII cells were isolated from Sftpc-WT and Sftpc-KO mice and put in culture for 5 days. Eighteen hours prior to lysate being harvested, cells were cultured in serum-free medium + 10 ng/mL of TNFα, in order to stimulate ATX production. One hundred fifty micrograms of protein was loaded into an 8% SDS-PAGE. A ~100 kDa band corresponding to ATX can be observed. Graph of the densitograms represents the percent of ATX band intensity normalized to the WT. ATII cells isolated from Sftpc-KO mice show a 90% decrease in band intensity (mean ± SD of 3 independent experiments). (C) Representative images of H&E stained 5 μm lung sections from TAM-treated naïve Sftpc-WT (left) and Sftpc-KO (right) and corn-oil-treated control (lower panel) mice. There was no sign of major histopathological lesion observed between the three different cohorts of lungs. Lungs were harvested two weeks post-TAM treatment, inflated with 10% formalin, fixed, and sectioned. Scale bars represent 100 μm (10× magnification).
Figure 2
Figure 2
ATX derived from B16-F10 partially controls the progression of lung metastasis. (A) Western blot analysis of cell lysates performed in two technical repeats of WT B16-F10 cells (lanes 1 and 2, respectively) and ATX-KO B16-F10 cells (lanes 3 and 4, respectively). Recombinant ATX (rATX, lane 6) was used as a positive control. Densitometric quantification of the ATX band showed an average 91% decrease in ATX expression in ATX-KO B16-F10 cell lysate compared to WT B16-F10 cells (mean ± SD of 4 independent experiments). Cell lines were cultured for 18 h in serum-free medium before lysates were harvested. One hundred micrograms of protein was loaded into an 8% SDS-PAGE. (B) ATX immunofluorescence staining in WT and ATX-KO B16-F10 cells. Cells were stained for ATX (green) using the 4F1 antibody at 1:100 dilution, with DAPI nuclear counterstain (1:5000). Upper panels show the staining of WT B16-F10 cells, whereas lower panels show the staining of ATX-KO B16-F10 cells. Scale bars represent 100 μm (20× magnification). (C) Quantification of ATX activity in concentrated conditioned medium (CCM) from WT and ATX-KO B16-F10. Crosshatched bar represents 10 nM recombinant ATX (rATX) positive control, white bar corresponds to the ATX activity in the CCM of WT B16-F10 cells (n = 5), and gray bar is the activity measured in CCM of ATX-KO B16-F10 cells (n = 5). ATX-KO B16-F10 cells present a 74.3% decrease in ATX activity compared to WT B16-F10 cells (Mann–Whitney, ** p = 0.0079). (D) Comparison of the growth rate between WT (black) and ATX-KO (red) B16-F10 performed in six replicates; representative of three independent experiments. (E) Metastatic foci in the lungs of C57BL/6 mice inoculated with 1 × 10⁵ WT B16-F10 cells (white bar, n = 18) or ATX-KO B16-F10 cells (gray bar, n = 20), and representative lung pictures from this experiment (below). Mice inoculated with ATX-KO B16-F10 cells showed a 34% decrease in lung metastases (unpaired t-test, * p = 0.04, data from 2 independent experiments).
Figure 3
Figure 3
Only combined KO of ATX in B16-F10 cells and ATII cells decreases lung metastasis burden compared to KO in ATII cells alone. (A) Metastatic nodules in the lungs of Sftpc-WT (white bar, n = 16) and Sftpc-KO (gray bar, n = 23) mice inoculated with 1.5 × 10⁵ ATX-KO B16-F10 cells. Sftpc-KO mice showed a 30% decrease in metastatic nodules (unpaired t-test, * p = 0.028 from 2 independent experiments). (B) ATX activity in the BALF from Sftpc-WT (white bar, n = 6) and Sftpc-KO (gray bar, n = 14) mice inoculated with 1.5 × 10⁵ ATX-KO B16-F10 cells. There was no statistical difference between the two genotypes (unpaired t-test, p = 0.1551). (C) Total LPA species in the plasma of Sftpc-WT (white bar, n = 16) and Sftpc-KO (gray bar, n = 23) analyzed by mass spectrometry. Values are mean ± SD. Unpaired t-test, * p = 0.0426. (D) LPA species in the plasma of Sftpc-WT (white bar, n = 16) and Sftpc-KO (gray bar, n = 23) mice analyzed by mass spectrometry. Values are mean ± SD. * p = 0.0305, unpaired t-test. (E) Metastatic nodules in the lungs of Sftpc-WT (white bar, n = 13) and Sftpc-KO (gray bar, n = 10) mice inoculated with 1.5 × 10⁵ WT B16-F10 cells. There was no statistical difference between the two genotypes (unpaired t-test, p = 0.1063). (F) ATX activity in the BALF from Sftpc-WT (white bar, n = 13) and Sftpc-KO (gray bar, n = 10) mice. There was no statistical difference between the two genotypes (unpaired t-test, p = 0.052).
Figure 4
Figure 4
ATX derived from ATII cells does not impact the transmigration ability of B16-F10 cells. (A) Transmigration of WT (white bar) and ATX-KO (gray bar) B16-F10 cells after incubation in complete medium for 6 h. The experiment was performed in quadruplicate wells. No statistical difference was observed (Mann–Whitney, p = 0.083). (B) Transmigration of WT (white bar) and ATX-KO (gray bar) B16-F10 cells in the presence of ATII cells isolated from Sftpc-WT mice plated in the lower chamber. Membranes were analyzed after 6 h of incubation and performed in quadruplicate. No statistical difference was observed (Mann–Whitney, p = 0.404). (C) Transmigration of WT (white bar) and ATX-KO (gray bar) B16-F10 cells in the presence of ATII cells isolated from Sftpc-KO mice plated in the lower chamber. Membranes were analyzed after 6 h of incubation and performed in quadruplicate. No statistical difference was found (Mann–Whitney, p = 0.083).
Figure 5
Figure 5
Plasma cytokine measurements in naïve Sftpc-WT and Sftpc-KO mice treated with TAM. Flow cytometry was performed to compare the basal concentration levels of 13 cytokines in the plasma of 7 Sftpc-WT (white bars) and 6 Sftpc-KO (gray bars) mice. Note that only IL-27 was different between the groups with a 3-fold higher concentration in the plasma of Sftpc-KO mice (unpaired t-test, * p = 0.032).
Figure 6
Figure 6
Cytokine measurements in the plasma of Sftpc-WT and Sftpc-KO mice on post-inoculation day 21. Flow cytometry was performed to compare the concentration of 13 cytokines in the plasma of Sftpc-WT (white bars) and Sftpc-KO (gray bars) mice, on day 21 post-inoculation, inoculated with 1.5 × 10⁵ ATX-KO B16-F10 cells. Sftpc-KO mice presented an increase in 2 out of the 13 cytokines (unpaired t-test, IFNγ, **** p < 0.0001; TNFα, *** p = 0.0003).
Figure 7
Figure 7
Immunostaining performed on Sftpc-WT and Sftpc-KO lung sections. Five-micrometer lung sections were stained for (A) CD8a, Sftpc-KO mice presented a higher CD8+ T cell infiltration (black arrows); (B) CD4, both groups presented nodules with sparse CD4+ infiltration; and (C) CD68, no infiltration of CD68+ cells was observed. Scale bars represent 200 μm (10× magnification).

Similar articles

Cited by

References

    1. Fares C.M., Van Allen E.M., Drake C.G., Allison J.P., Hu-Lieskovan S. Mechanisms of Resistance to Immune Checkpoint Blockade: Why Does Checkpoint Inhibitor Immunotherapy Not Work for All Patients? Am. Soc. Clin. Oncol. Educ. Book. 2019;39:147–164. doi: 10.1200/EDBK_240837. - DOI - PubMed
    1. Michielin O., Atkins M.B., Koon H.B., Dummer R., Ascierto P.A. Evolving impact of long-term survival results on metastatic melanoma treatment. J. Immunother. Cancer. 2020;8:e000948. doi: 10.1136/jitc-2020-000948. - DOI - PMC - PubMed
    1. van Zijl F., Krupitza G., Mikulits W. Initial steps of metastasis: Cell invasion and endothelial transmigration. Mutat. Res. Mutat. Res. 2011;728:23–34. doi: 10.1016/j.mrrev.2011.05.002. - DOI - PMC - PubMed
    1. Zhuyan J., Chen M., Zhu T., Bao X., Zhen T., Xing K., Wang Q., Zhu S. Critical steps to tumor metastasis: Alterations of tumor microenvironment and extracellular matrix in the formation of pre-metastatic and metastatic niche. Cell Biosci. 2020;10:89. doi: 10.1186/s13578-020-00453-9. - DOI - PMC - PubMed
    1. Brodt P. Role of the Microenvironment in Liver Metastasis: From Pre- to Prometastatic Niches. Clin. Cancer Res. 2016;22:5971–5982. doi: 10.1158/1078-0432.CCR-16-0460. - DOI - PubMed