

Pterygium and Ocular Surface Squamous Neoplasia: Optical Biopsy Using a Novel Autofluorescence Multispectral Imaging Technique
- PMID: 35326744
- PMCID: PMC8946656
- DOI: 10.3390/cancers14061591
Pterygium and Ocular Surface Squamous Neoplasia: Optical Biopsy Using a Novel Autofluorescence Multispectral Imaging Technique
Abstract
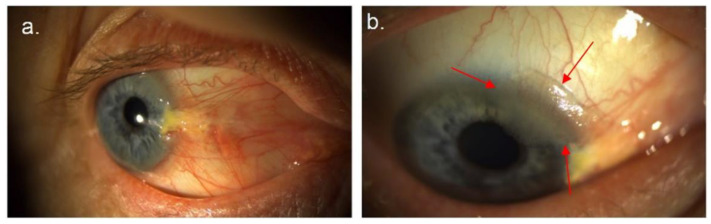
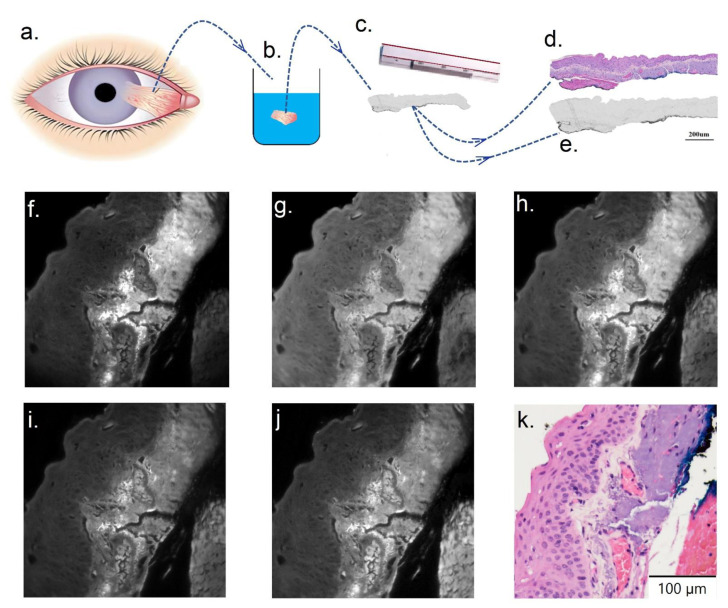
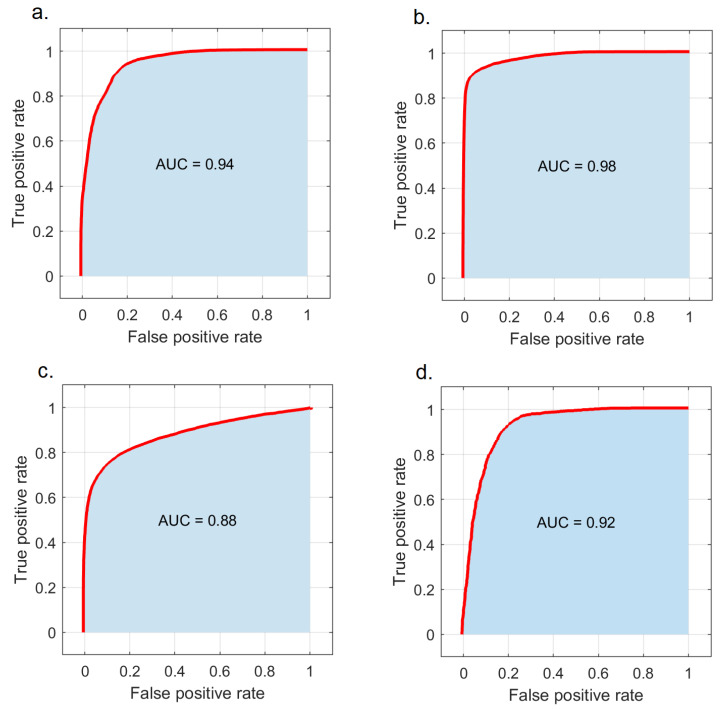
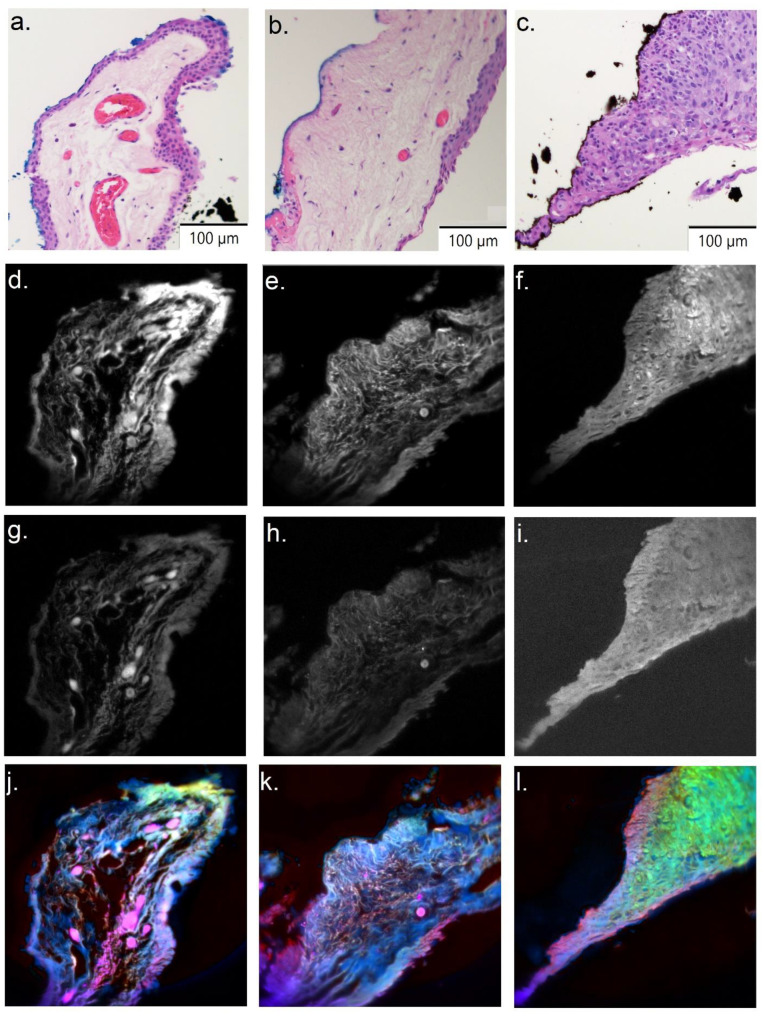
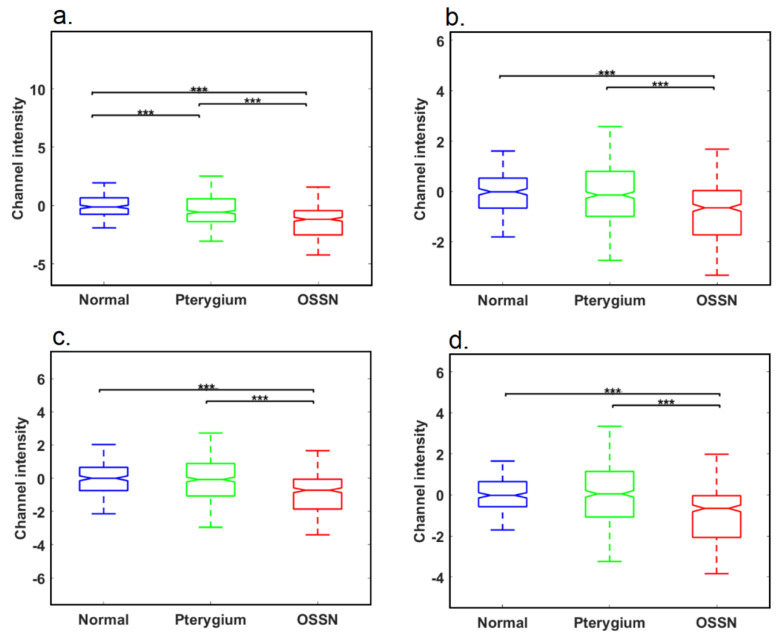
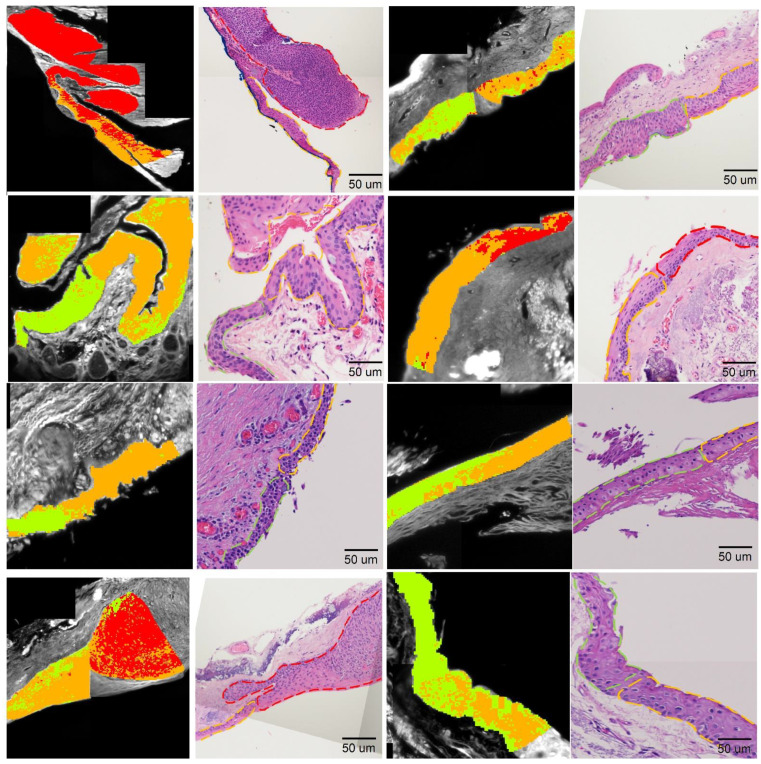
In this study, differentiation of pterygium vs. ocular surface squamous neoplasia based on multispectral autofluorescence imaging technique was investigated. Fifty (N = 50) patients with histopathological diagnosis of pterygium (PTG) and/or ocular surface squamous neoplasia (OSSN) were recruited. Fixed unstained biopsy specimens were imaged by multispectral microscopy. Tissue autofluorescence images were obtained with a custom-built fluorescent microscope with 59 spectral channels, each with specific excitation and emission wavelength ranges, suitable for the most abundant tissue fluorophores such as elastin, flavins, porphyrin, and lipofuscin. Images were analyzed using a new classification framework called fused-classification, designed to minimize interpatient variability, as an established support vector machine learning method. Normal, PTG, and OSSN regions were automatically detected and delineated, with accuracy evaluated against expert assessment by a specialist in OSSN pathology. Signals from spectral channels yielding signals from elastin, flavins, porphyrin, and lipofuscin were significantly different between regions classified as normal, PTG, and OSSN (p < 0.01). Differential diagnosis of PTG/OSSN and normal tissue had accuracy, sensitivity, and specificity of 88 ± 6%, 84 ± 10% and 91 ± 6%, respectively. Our automated diagnostic method generated maps of the reasonably well circumscribed normal/PTG and OSSN interface. PTG and OSSN margins identified by our automated analysis were in close agreement with the margins found in the H&E sections. Such a map can be rapidly generated on a real time basis and potentially used for intraoperative assessment.
Keywords: autofluorescence; boundary detection; machine learning; ocular surface squamous neoplasia; pterygium.
Conflict of interest statement
The authors declare no conflict of interest.
Figures
Similar articles
-
Novel automated non invasive detection of ocular surface squamous neoplasia using multispectral autofluorescence imaging.Ocul Surf. 2019 Jul;17(3):540-550. doi: 10.1016/j.jtos.2019.03.003. Epub 2019 Mar 20. Ocul Surf. 2019. PMID: 30904597
-
Classification of ocular surface diseases: Deep learning for distinguishing ocular surface squamous neoplasia from pterygium.Graefes Arch Clin Exp Ophthalmol. 2025 Apr 5. doi: 10.1007/s00417-025-06804-x. Online ahead of print. Graefes Arch Clin Exp Ophthalmol. 2025. PMID: 40186633
-
Detection of Ocular Surface Squamous Neoplasia Using Artificial Intelligence With Anterior Segment Optical Coherence Tomography.Am J Ophthalmol. 2025 May;273:182-191. doi: 10.1016/j.ajo.2025.02.019. Epub 2025 Feb 19. Am J Ophthalmol. 2025. PMID: 39983942
-
Ocular surface squamous neoplasia: Growth, diagnosis, and treatment.Eur J Ophthalmol. 2025 Apr 24:11206721251337166. doi: 10.1177/11206721251337166. Online ahead of print. Eur J Ophthalmol. 2025. PMID: 40270095 Review.
-
Ultra high-resolution anterior segment optical coherence tomography in the diagnosis and management of ocular surface squamous neoplasia.Ocul Surf. 2014 Jan;12(1):46-58. doi: 10.1016/j.jtos.2013.11.001. Epub 2013 Nov 9. Ocul Surf. 2014. PMID: 24439046 Free PMC article. Review.
Cited by
-
Unique Deep Radiomic Signature Shows NMN Treatment Reverses Morphology of Oocytes from Aged Mice.Biomedicines. 2022 Jun 29;10(7):1544. doi: 10.3390/biomedicines10071544. Biomedicines. 2022. PMID: 35884850 Free PMC article.
-
Automated pancreatic islet viability assessment for transplantation using bright-field deep morphological signature.Comput Struct Biotechnol J. 2023 Feb 24;21:1851-1859. doi: 10.1016/j.csbj.2023.02.039. eCollection 2023. Comput Struct Biotechnol J. 2023. PMID: 36915378 Free PMC article.
-
Novel automated non-invasive detection of ocular surface squamous neoplasia using artificial intelligence.World J Methodol. 2024 Jun 20;14(2):92267. doi: 10.5662/wjm.v14.i2.92267. eCollection 2024 Jun 20. World J Methodol. 2024. PMID: 38983656 Free PMC article. Review.
-
Integration of hyperspectral imaging and transcriptomics from individual cells with SpectralSeq.Genome Res. 2025 Aug 1;35(8):1809-1820. doi: 10.1101/gr.280014.124. Genome Res. 2025. PMID: 40628527 Free PMC article.
-
Perspective on the use of fluorescence molecular imaging for peripheral and deep en face margin assessment.J Biomed Opt. 2025 Jan;30(Suppl 1):S13711. doi: 10.1117/1.JBO.30.S1.S13711. Epub 2025 May 2. J Biomed Opt. 2025. PMID: 40321301 Free PMC article. Review.
References
LinkOut - more resources
Full Text Sources
