

Bio-Mapping Indicators and Pathogen Loads in a Commercial Broiler Processing Facility Operating with High and Low Antimicrobial Intervention Levels
- PMID: 35327198
- PMCID: PMC8947298
- DOI: 10.3390/foods11060775
Bio-Mapping Indicators and Pathogen Loads in a Commercial Broiler Processing Facility Operating with High and Low Antimicrobial Intervention Levels
Abstract
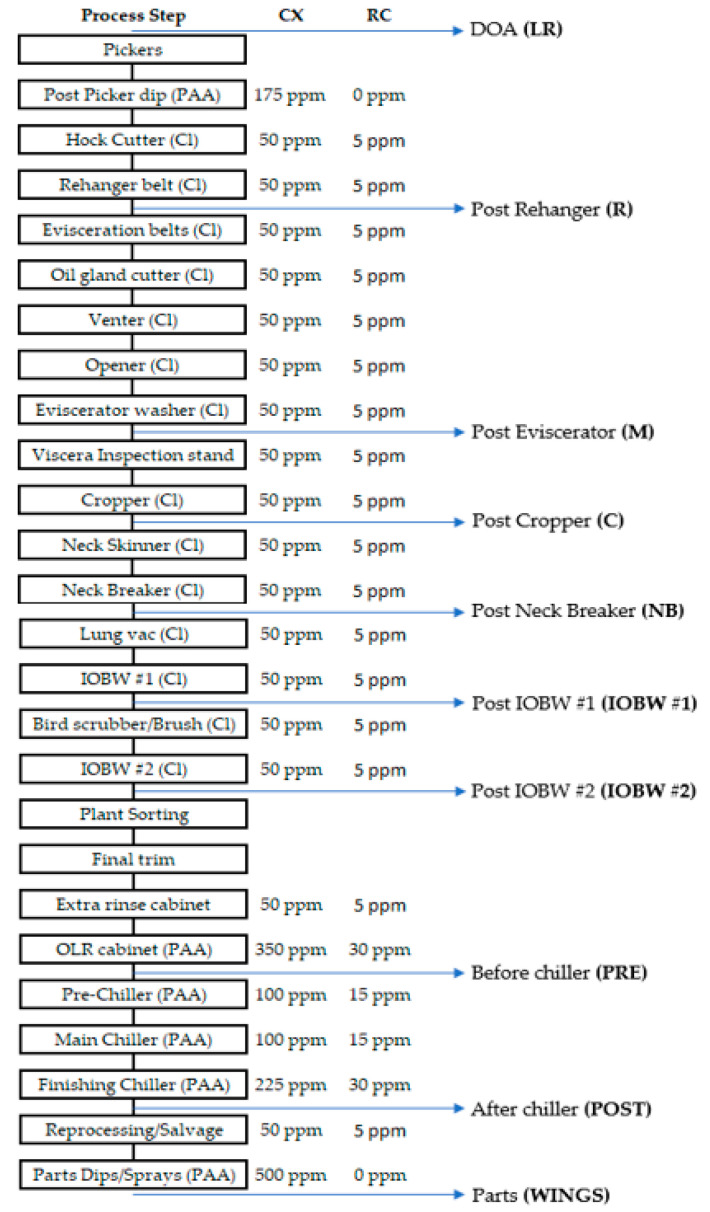
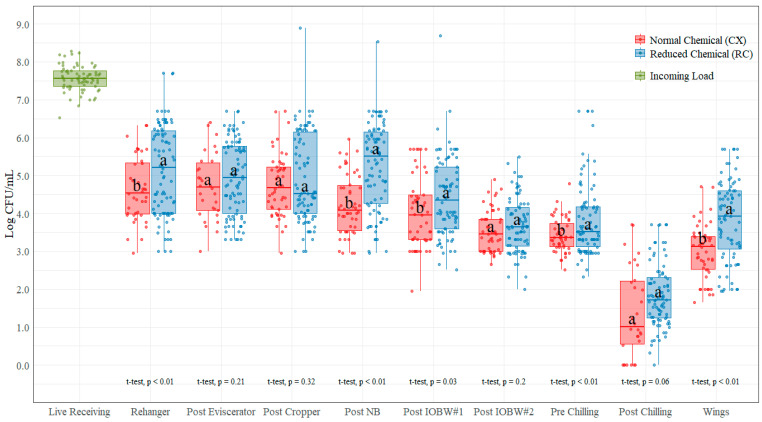
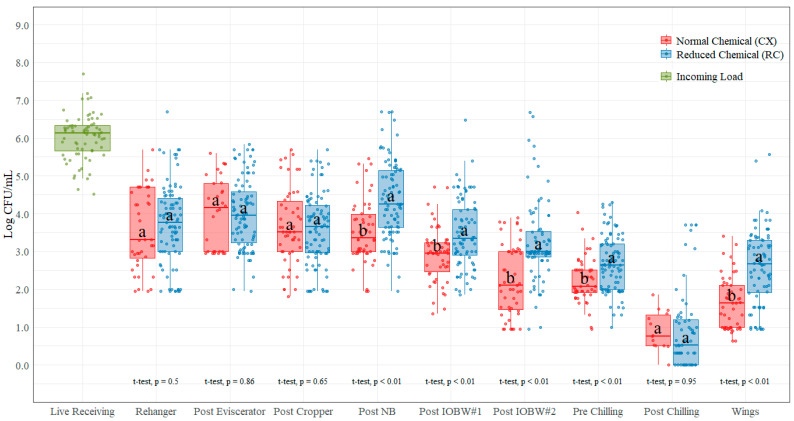
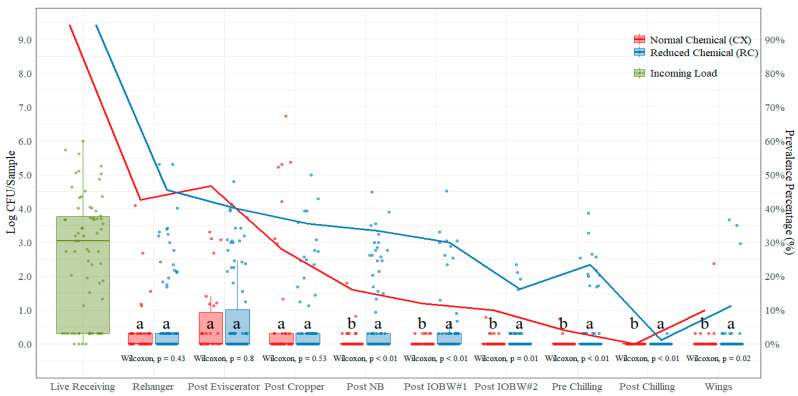
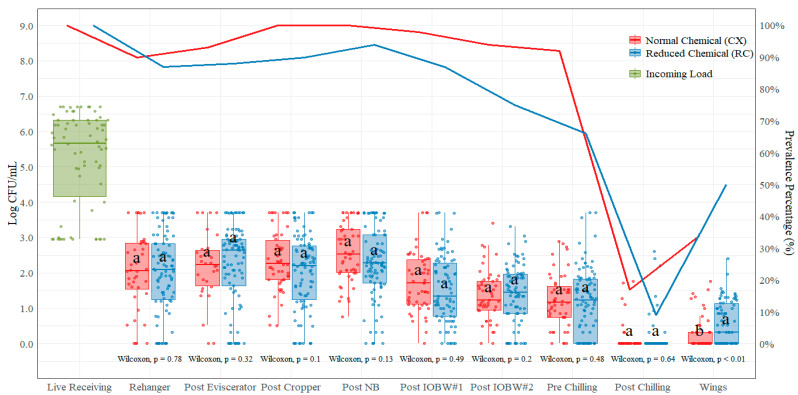
The poultry industry in the United States has traditionally implemented non-chemical and chemical interventions against Salmonella spp. and Campylobacter spp. on the basis of experience and word-of-mouth information shared among poultry processors. The effects of individual interventions have been assessed with microbiological testing methods for Salmonella spp. and Campylobacter spp. prevalence as well as quantification of indicator organisms, such as aerobic plate counts (APC), to demonstrate efficacy. The current study evaluated the loads of both indicators and pathogens in a commercial chicken processing facility, comparing the "normal chemical", with all chemical interventions turned-on, at typical chemical concentrations set by the processing plant versus low-chemical process ("reduced chemical"), where all interventions were turned off or reduced to the minimum concentrations considered in the facility's HACCP system. Enumeration and prevalence of Salmonella spp. and Campylobacter spp. as well as indicator organisms (APC and Enterobacteriaceae-EB) enumeration were evaluated to compare both treatments throughout a 25-month sampling period. Ten locations were selected in the current bio-mapping study, including live receiving, rehanger, post eviscerator, post cropper, post neck breaker, post IOBW #1, post IOBW #2, prechilling, post chilling, and parts (wings). Statistical process control parameters for each location and processing schemes were developed for each pathogen and indicator evaluated. Despite demonstrating significant statistical differences between the normal and naked processes in Salmonella spp. counts ("normal" significantly lower counts than the "reduced" at each location except for post-eviscerator and post-cropper locations), the prevalence of Salmonella spp. after chilling is comparable on both treatments (~10%), whereas for Campylobacter spp. counts, only at the parts' location was there significant statistical difference between the "normal chemical" and the "reduced chemical". Therefore, not all chemical intervention locations show an overall impact on Salmonella spp. or Campylobacter spp., and certain interventions can be turned off to achieve the same or better microbial performance if strategic intervention locations are enhanced.
Keywords: Campylobacter enumeration; Salmonella enumeration; chemical interventions; poultry bio-mapping.
Conflict of interest statement
The authors declare no conflict of interest.
Figures
Similar articles
-
Bio-Mapping of Microbial Indicators and Pathogen Quantitative Loads in Commercial Broiler Processing Facilities in South America.Foods. 2023 Sep 28;12(19):3600. doi: 10.3390/foods12193600. Foods. 2023. PMID: 37835253 Free PMC article.
-
Bio-Mapping Salmonella and Campylobacter Loads in Three Commercial Broiler Processing Facilities in the United States to Identify Strategic Intervention Points.Foods. 2024 Jan 5;13(2):180. doi: 10.3390/foods13020180. Foods. 2024. PMID: 38254481 Free PMC article.
-
Data-Mining Poultry Processing Bio-Mapping Counts of Pathogens and Indicator Organisms for Food Safety Management Decision Making.Foods. 2023 Feb 20;12(4):898. doi: 10.3390/foods12040898. Foods. 2023. PMID: 36832973 Free PMC article.
-
Interventions to reduce Salmonella and Campylobacter during chilling and post-chilling stages of poultry processing: a systematic review and meta-analysis.Poult Sci. 2024 Apr;103(4):103492. doi: 10.1016/j.psj.2024.103492. Epub 2024 Jan 24. Poult Sci. 2024. PMID: 38335673 Free PMC article.
-
A Review of Salmonella and Campylobacter in Broiler Meat: Emerging Challenges and Food Safety Measures.Foods. 2020 Jun 11;9(6):776. doi: 10.3390/foods9060776. Foods. 2020. PMID: 32545362 Free PMC article. Review.
Cited by
-
Bio-Mapping of Microbial Indicators and Pathogen Quantitative Loads in Commercial Broiler Processing Facilities in South America.Foods. 2023 Sep 28;12(19):3600. doi: 10.3390/foods12193600. Foods. 2023. PMID: 37835253 Free PMC article.
-
Bio-Mapping of Microbial Indicators to Establish Statistical Process Control Parameters in a Commercial Beef Processing Facility.Foods. 2022 Apr 14;11(8):1133. doi: 10.3390/foods11081133. Foods. 2022. PMID: 35454719 Free PMC article.
-
Development and Verification of a Poultry Management Tool to Quantify Salmonella from Live to Final Product Utilizing RT-PCR.Foods. 2023 Jan 16;12(2):419. doi: 10.3390/foods12020419. Foods. 2023. PMID: 36673511 Free PMC article.
-
Rapid Quantitative Method Development for Beef and Pork Lymph Nodes Using BAX® System Real Time Salmonella Assay.Foods. 2023 Feb 15;12(4):822. doi: 10.3390/foods12040822. Foods. 2023. PMID: 36832897 Free PMC article.
-
Developing a risk management framework to improve public health outcomes by enumerating and serotyping Salmonella in ground turkey.Epidemiol Infect. 2024 Jan 8;152:e12. doi: 10.1017/S0950268823002029. Epidemiol Infect. 2024. PMID: 38185825 Free PMC article.
References
-
- United States Department of Agriculture Poultry Eggs. [(accessed on 21 September 2021)];2021 Available online: https://www.ers.usda.gov/topics/animal-products/poultry-eggs.
-
- United States Department of Agriculture Poultry-Production and Value Summary 2020. [(accessed on 20 November 2021)];2021 Available online: https://www.nass.usda.gov/Publications/Todays_Reports/reports/plva0421.pdf.
-
- National Chicken Council Per Capita Consumption of Poultry and Livestock, 1965 to Forecast 2022. 2021. [(accessed on 20 November 2021)]. (In Pounds) Available online: https://www.nationalchickencouncil.org/about-the-industry/statistics/per...
-
- Painter J.A., Hoekstra R.M., Ayers T., Tauxe R.V., Braden C.R., Angulo F.J., Griffin P.M. Attribution of foodborne illnesses, hospitalizations, and deaths to food commodities by using outbreak data, United States, 1998–2008. Emerg. Infect. Dis. 2013;19:407–415. doi: 10.3201/eid1903.111866. - DOI - PMC - PubMed
-
- Center for Disease Control and Prevention Burden of Foodborne Illness: Findings. [(accessed on 11 November 2021)]; Available online: https://www.cdc.gov/foodborneburden/2011-foodborne-estimates.html.
LinkOut - more resources
Full Text Sources
Miscellaneous
