

Early-Onset Glaucoma in egl1 Mice Homozygous for Pitx2 Mutation
- PMID: 35327318
- PMCID: PMC8945683
- DOI: 10.3390/biomedicines10030516
Early-Onset Glaucoma in egl1 Mice Homozygous for Pitx2 Mutation
Abstract
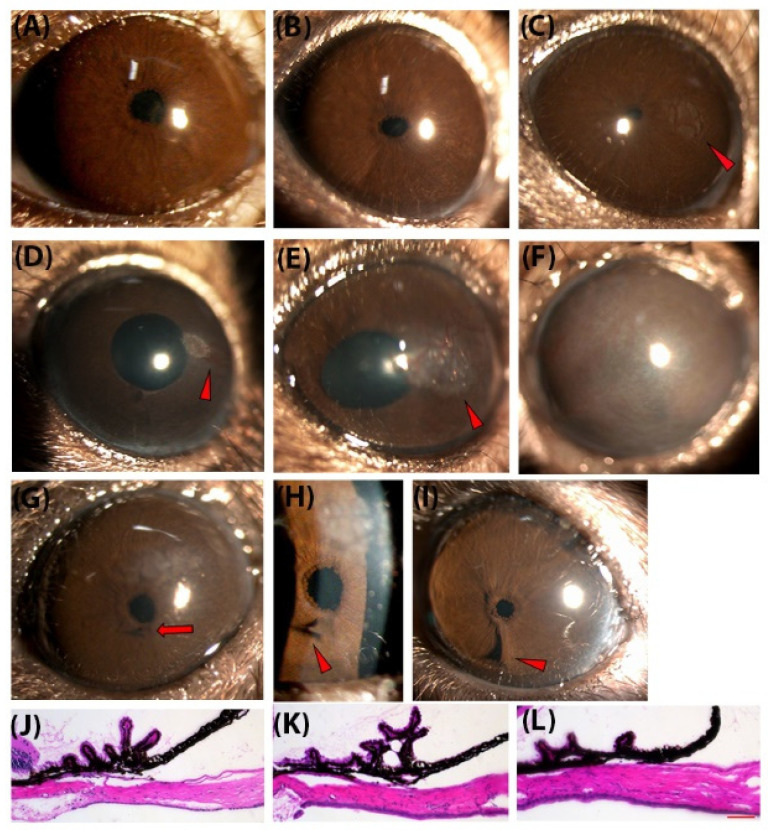
Mutations in PITX2 cause Axenfeld-Rieger syndrome, with congenital glaucoma as an ocular feature. The egl1 mouse strain carries a chemically induced Pitx2 mutation and develops early-onset glaucoma. In this study, we characterized the glaucomatous features in egl1 mice. The eyes of egl1 and C57BL/6J control mice were assessed by slit lamp examination, total aqueous humor outflow facility, intraocular pressure (IOP) measurement, pattern electroretinography (PERG) recording, and histologic and immunohistochemistry assessment beginning at 3 weeks and up to 12 months of age. The egl1 mice developed elevated IOP as early as 4 weeks old. The IOP elevation was variable and asymmetric within and between the animals. The aqueous humor outflow facility was significantly reduced in 12-month-old animals. PERG detected a decreased response at 2 weeks after the development of IOP elevation. Retinal ganglion cell (RGC) loss was detected after 8 weeks of IOP elevation. Slit lamp and histologic evaluation revealed corneal opacity, iridocorneal adhesions (anterior synechiae), and ciliary body atrophy in egl1 mice. Immunohistochemistry assessment demonstrated glial cell activation and RGC axonal injury in response to IOP elevation. These results show that the eyes of egl1 mice exhibit anterior segment dysgenesis and early-onset glaucoma. The egl1 mouse strain may represent a useful model for the study of congenital glaucoma.
Keywords: Pitx2; glaucoma; mouse model.
Conflict of interest statement
The authors declare no conflict of interest.
Figures


Similar articles
-
Anterior segment dysgenesis and early-onset glaucoma in nee mice with mutation of Sh3pxd2b.Invest Ophthalmol Vis Sci. 2011 Apr 1;52(5):2679-88. doi: 10.1167/iovs.10-5993. Print 2011 Apr. Invest Ophthalmol Vis Sci. 2011. PMID: 21282566 Free PMC article.
-
Heterozygous Pitx2 Null Mice Accurately Recapitulate the Ocular Features of Axenfeld-Rieger Syndrome and Congenital Glaucoma.Invest Ophthalmol Vis Sci. 2016 Sep 1;57(11):5023-5030. doi: 10.1167/iovs.16-19700. Invest Ophthalmol Vis Sci. 2016. PMID: 27654429 Free PMC article.
-
Mice with an induced mutation in collagen 8A2 develop larger eyes and are resistant to retinal ganglion cell damage in an experimental glaucoma model.Mol Vis. 2012;18:1093-106. Epub 2012 May 1. Mol Vis. 2012. PMID: 22701298 Free PMC article.
-
Topical ocular sodium 4-phenylbutyrate rescues glaucoma in a myocilin mouse model of primary open-angle glaucoma.Invest Ophthalmol Vis Sci. 2012 Mar 21;53(3):1557-65. doi: 10.1167/iovs.11-8837. Print 2012 Mar. Invest Ophthalmol Vis Sci. 2012. PMID: 22328638 Free PMC article.
-
The dark phase intraocular pressure elevation and retinal ganglion cell degeneration in a rat model of experimental glaucoma.Exp Eye Res. 2013 Jul;112:21-8. doi: 10.1016/j.exer.2013.04.008. Epub 2013 Apr 18. Exp Eye Res. 2013. PMID: 23603611 Free PMC article.
Cited by
-
Neuroprotection of Rodent and Human Retinal Ganglion Cells In Vitro/Ex Vivo by the Hybrid Small Molecule SA-2.Cells. 2022 Nov 23;11(23):3741. doi: 10.3390/cells11233741. Cells. 2022. PMID: 36497005 Free PMC article.
References
Grants and funding
LinkOut - more resources
Full Text Sources
