. 2022 Feb 22;10(3):518.
doi: 10.3390/biomedicines10030518.

Characterisation of Severe Traumatic Brain Injury Severity from Fresh Cerebral Biopsy of Living Patients: An Immunohistochemical Study

Affiliations

Characterisation of Severe Traumatic Brain Injury Severity from Fresh Cerebral Biopsy of Living Patients: An Immunohistochemical Study

Ping K Yip et al. Biomedicines. .

Abstract

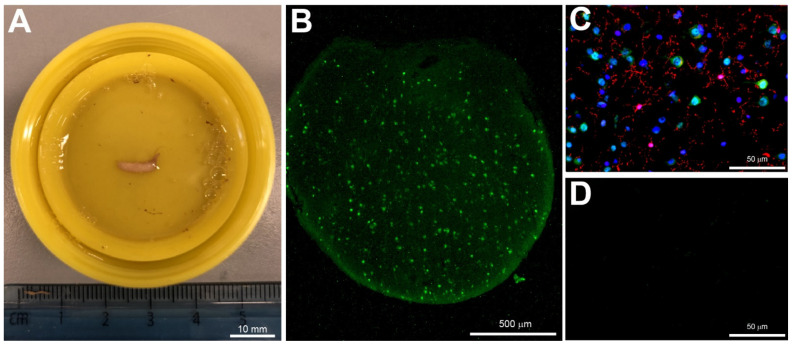
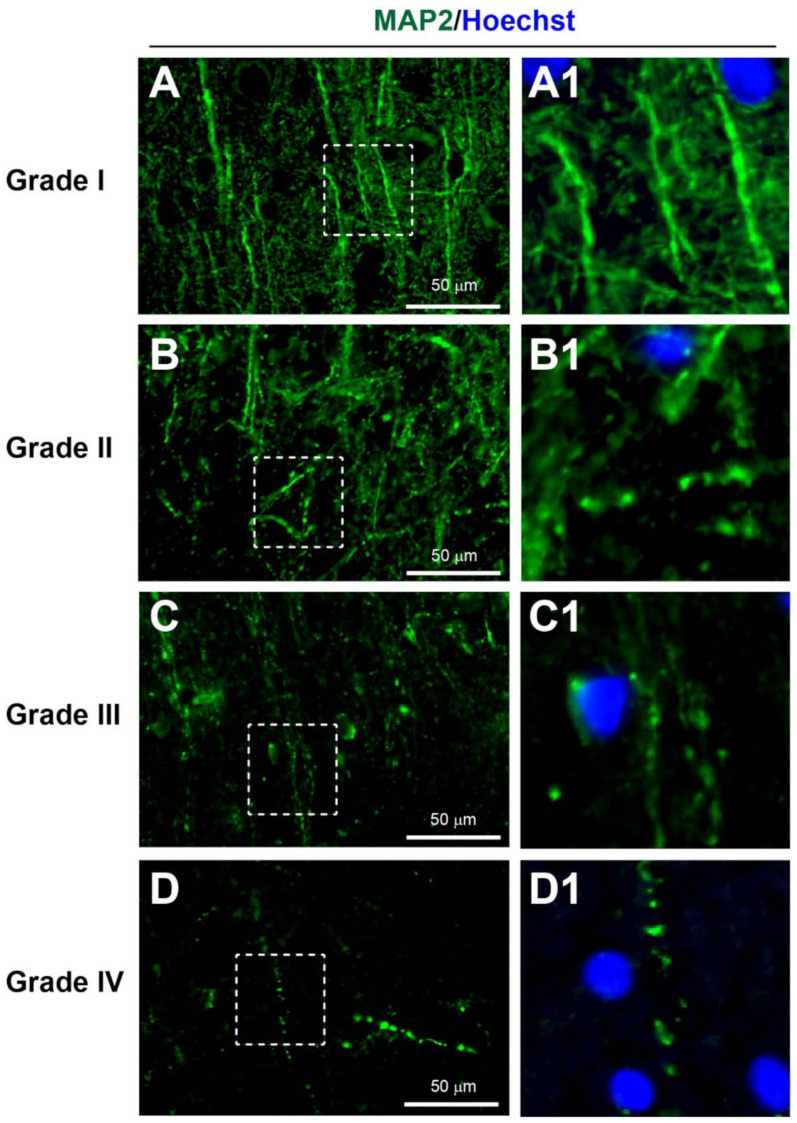
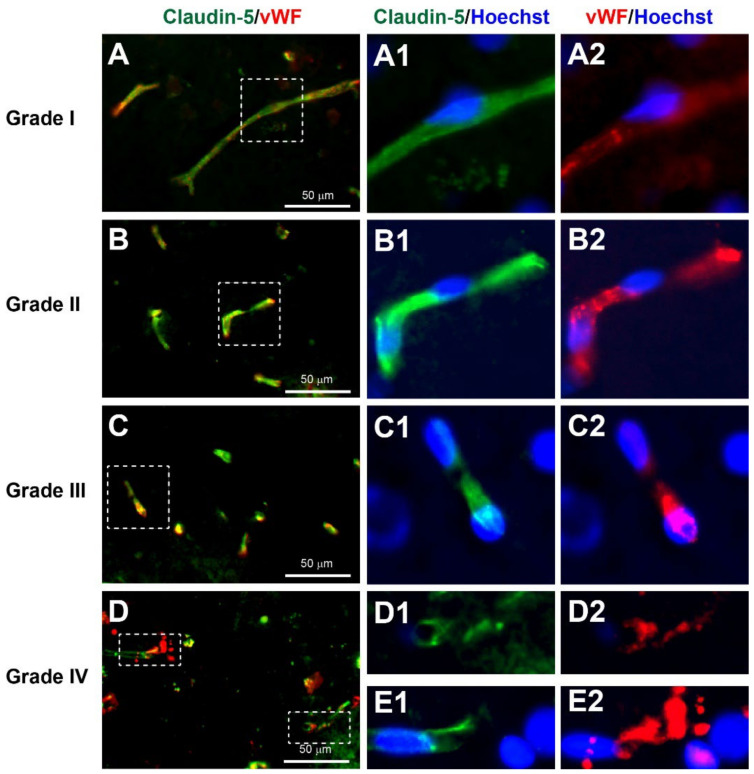
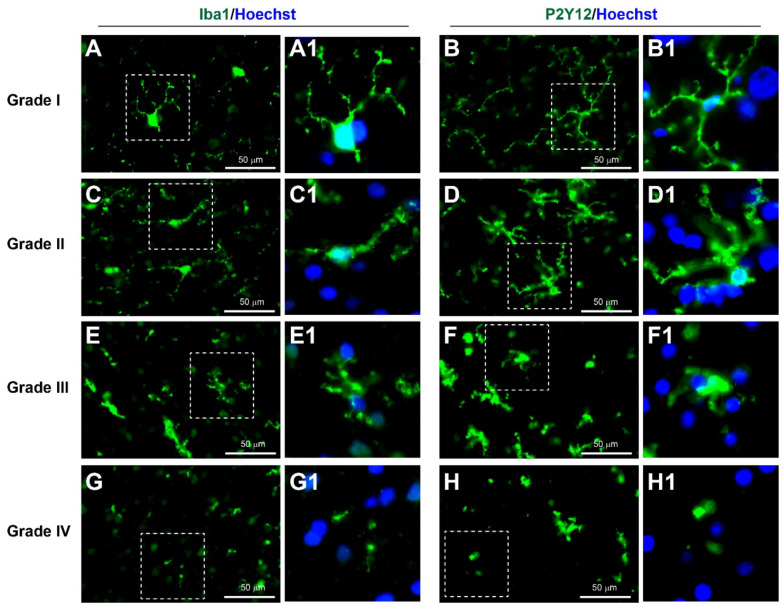
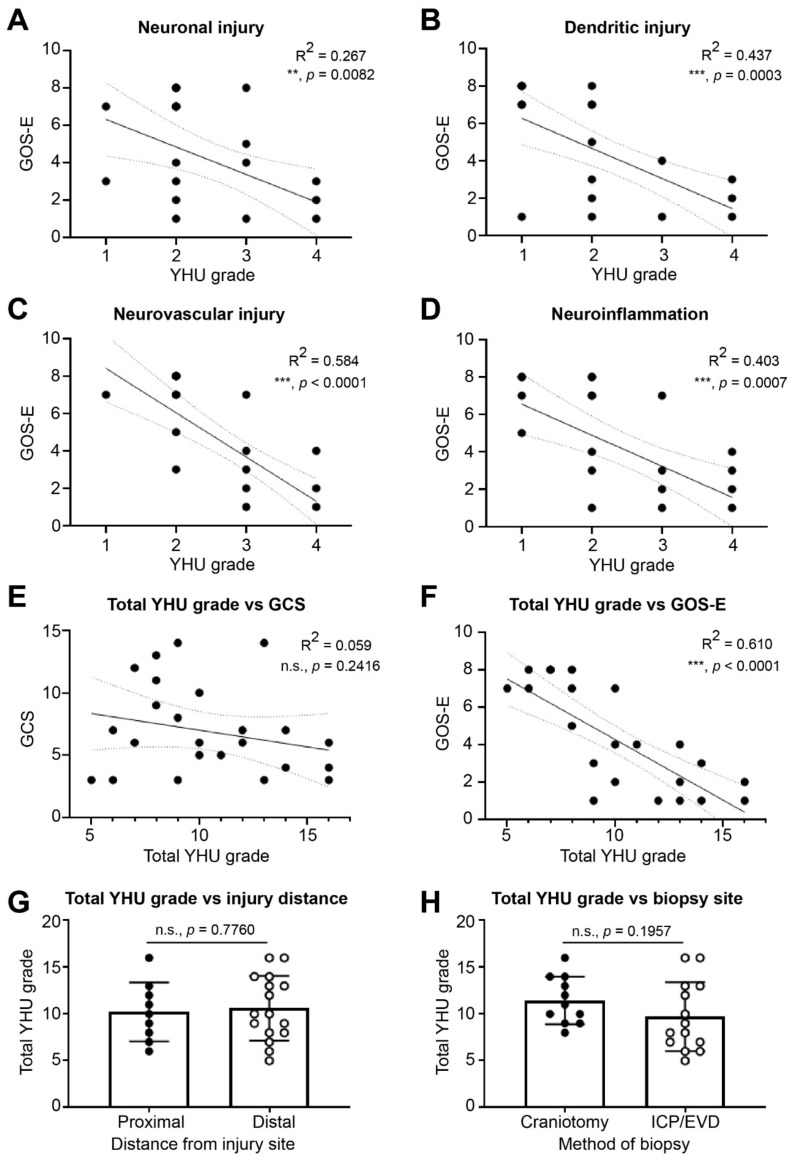
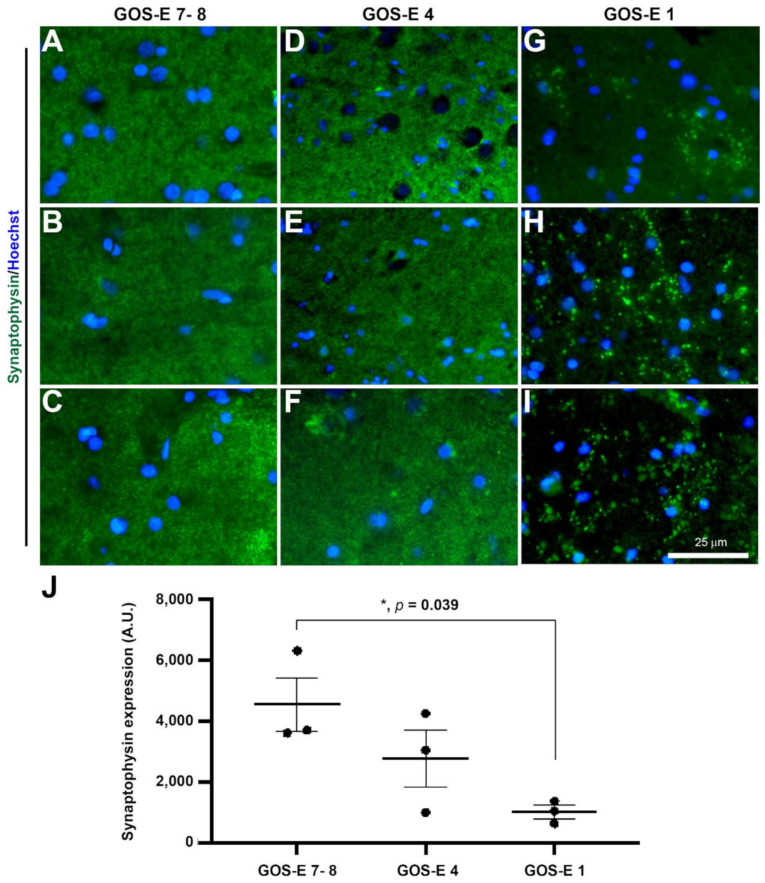
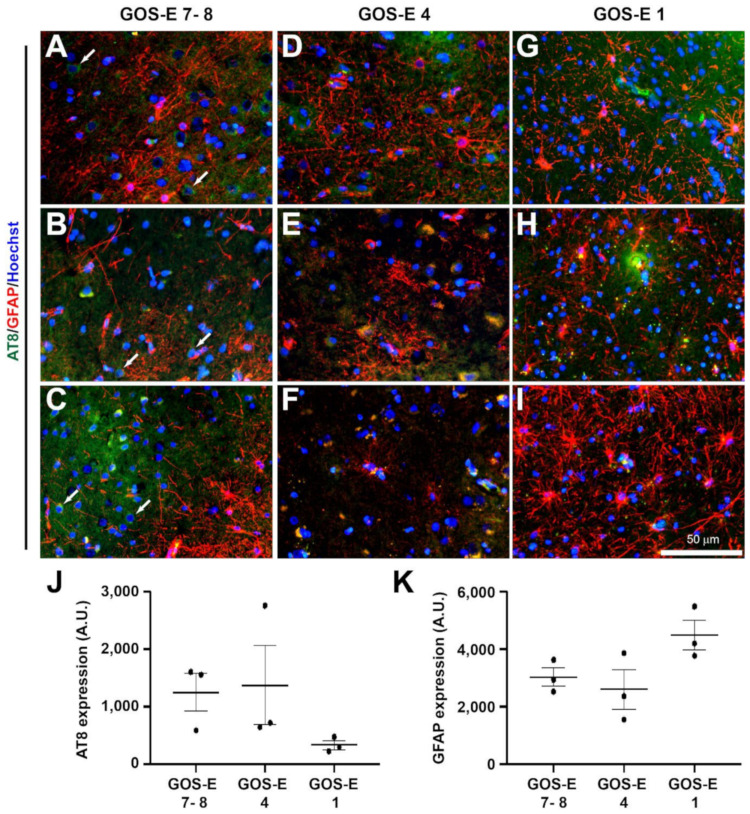
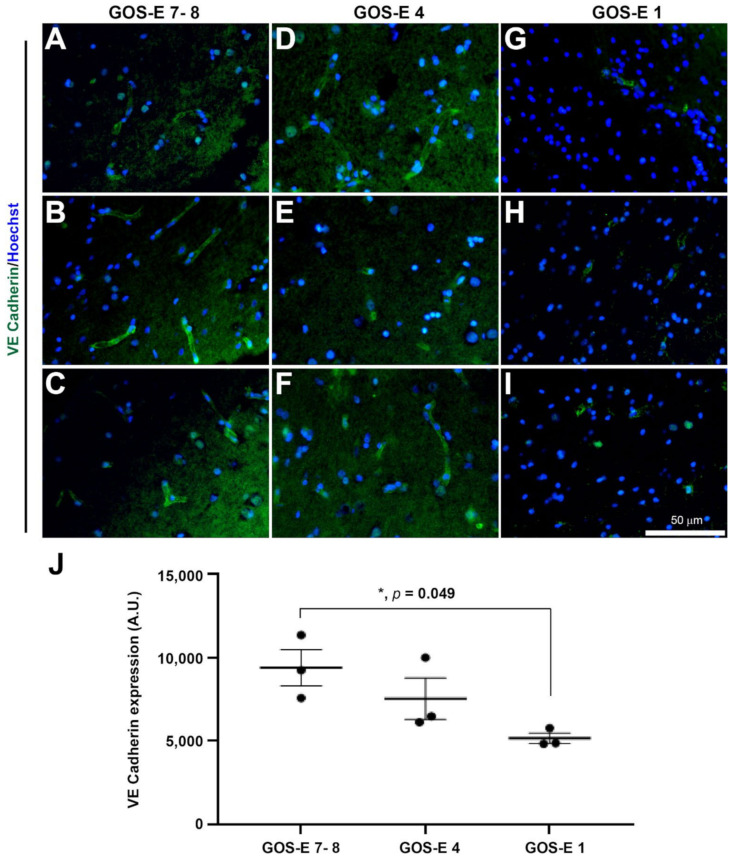
Traumatic brain injury (TBI) is an extremely complex disease and current systems classifying TBI as mild, moderate, and severe often fail to capture this complexity. Neuroimaging cannot resolve the cellular and molecular changes due to lack of resolution, and post-mortem tissue examination may not adequately represent acute disease. Therefore, we examined the cellular and molecular sequelae of TBI in fresh brain samples and related these to clinical outcomes. Brain biopsies, obtained shortly after injury from 25 living adult patients suffering severe TBI, underwent immunohistochemical analysis. There were no adverse events. Immunostaining revealed various qualitative cellular and biomolecular changes relating to neuronal injury, dendritic injury, neurovascular injury, and neuroinflammation, which we classified into 4 subgroups for each injury type using the newly devised Yip, Hasan and Uff (YHU) grading system. Based on the Glasgow Outcome Scale-Extended, a total YHU grade of ≤8 or ≥11 had a favourable and unfavourable outcome, respectively. Biomolecular changes observed in fresh brain samples enabled classification of this heterogeneous patient population into various injury severity categories based on the cellular and molecular pathophysiology according to the YHU grading system, which correlated with outcome. This is the first study investigating the acute biomolecular response to TBI.

Keywords: Glasgow Outcome Scale-Extended; brain biopsy; dendritic injury; neuroinflammation; neuronal injury; neurovasculature; traumatic brain injury.


Conflict of interest statement

The authors declare no conflict of interest.

Figures

Figure 1
Figure 1
Cerebral biopsy sample and fluorescent immunostaining. (A) An image of the cerebral biopsy obtained from a severe TBI patient and fixed in 10% formalin. (B) A cross-section of the biopsy stained with the neuronal marker NeuN (green, ×4 magnification). (C) Biopsy stained with NeuN (green), Iba1 (red) and Hoechst (blue) (×40 magnification). (D) Negative control of immunostaining with the primary antibody omitted. Scale bars: (A), 10 mm; (B), 500 µm and (C,D) 50 µm.
Figure 2
Figure 2
YHU grading system for neuronal injury in cerebral biopsies immunostained with NeuN (green) and Hoechst (nuclei, blue). (A,A1) Neurones with limited injury display large round/or polygonal cell bodies (grade I). (B,B1) Neurones with mild damage exhibit mild cellular shrinkage and/or small vacuolisation within the cytoplasm (grade II). (C,C1) Neurones with moderate damage exhibit moderate cellular shrinkage and/or many with large cytoplasmic vacuolisations (grade III). (D,D1) Severe neuronal death, indicated by atrophic cell bodies and few, if any, NeuN+ neurones (grade IV). (A1D1) Enlarged images of the corresponding dashed boxes. Scale bar is 50 µm.
Figure 3
Figure 3
YHU grading system for dendritic injury in cerebral biopsies immunostained with MAP2 (green) and Hoechst (nuclei, blue). (A,A1) Dendrites with limited injury display strong continuous MAP2+ staining within some cell bodies and along the dendrites (grade I). (B,B1) Dendrites with mild damage exhibit reduced MAP2 staining and some signs of dendritic beading (grade II). (C,C1) Moderate dendritic injury exhibited moderate dendritic beading and some complete loss of dendrites (grade III). (D,D1) Severe dendritic injury is indicated by few, if any, dendrites present and only dendrites with beading present (grade IV). (A1D1) Enlarged images of the corresponding dashed boxes. Scale bar is 50 µm.
Figure 4
Figure 4
YHU grading system for neurovascular injury in cerebral biopsies immunostained with claudin-5 (green), von Willebrand factor (vWF, red), and Hoechst (nuclei, blue). (AA2) Microvessels with limited damage display moderate claudin-5 and vWF staining within long uninjured segments of microvessels (grade I). (BB2) Mildly damaged microvessels exhibit stronger claudin-5 and vWF staining, with shorter microvessel segments (grade II). (CC2) Moderately damage microvessels predominantly exhibit very short segments (grade III). (DE2) Severe microvessel damage is indicated by few, if any, claudin-5- or vWF-stained microvessels present and/or microvessels showing signs of bursting morphology, with release of vWF bodies (grade IV). (A1E2) Enlarged images of the corresponding dashed boxes. Scale bar is 50 µm.
Figure 5
Figure 5
YHU grading system for neuroinflammation in cerebral biopsies immunostained with Iba1 (green, left panels), P2Y12 (green, right panels), and Hoechst (nuclei, blue). (AB1) Microglia exposed to limited brain injury display a ramified appearance with long and thin processes and moderate expression of either iba1 or P2Y12 (grade I). (CD1) Mild brain injury induces neuroinflammation with increase in microglial Iba1 and P2Y12 expression and thickening of processes (grade II). (EF1) In moderate neuroinflammation, the microglia display an ameboid morphology with very short processes (grade III). (GH1) In severe brain injury, few, if any, intact microglia are present, and signs of severe fragmentation occur (grade IV). (A1H1) Enlarged images of the corresponding dashed boxes. Scale bar is 50 µm.
Figure 6
Figure 6
Linear regression analysis between the YHU grade and GOS-E. The GOS-E was compared with the YHU grade for (A) neuronal injury, (B) dendritic injury, (C) neurovascular injury, and (D) neuroinflammation. Combination of all YHU grades for neuronal injury, dendritic injury, neurovascular injury, and neuroinflammation of each patient compared with (E) GCS, (F) GOS-E, (G) distance from injury site, and (H) method of biopsy. n.s. = non-significant, ** = p < 0.01, *** = p < 0.001.
Figure 7
Figure 7
Synaptophysin-immunoreactive synaptic terminal in brain biopsies after severe TBI. Photomicrographs of synaptophysin immunostaining in 3 individual biopsies from patients with a GOS-E 7–8 (AC). Photomicrographs of synaptophysin immunostaining in 3 individual biopsies from patients with a GOS-E 4 (DF). Photomicrographs of synaptophysin immunostaining in 3 individual biopsies from patients with a GOS-E 1 (GI). * p < 0.05, GOS-E 7–8 vs GOS-E 1. Results represent mean ± SEM (J). N = 3 per group. Scale bar 25 µm. Cellular nuclei stained with Hoechst (blue).
Figure 8
Figure 8
Tau phosphorylation and astrocytic-immunoreactivity in brain biopsies after severe TBI. Tau phosphorylation was stained using AT8 (green) and astrocytes was stained with GFAP (red). Photomicrographs of AT8 and GFAP immunostaining in 3 individual biopsies from patients with a GOS-E 7–8 (AC). Photomicrographs of AT8 and GFAP immunostaining in 3 individual biopsies from patients with a GOS-E 4 (DF). Photomicrographs of AT8 and GFAP immunostaining in 3 individual biopsies from patients with a GOS-E 1 (GI). No significance between immunoexpression in the GOS-E groups was detected for AT8 (J) and GFAP (K). Results represent mean ± SEM. N = 3 per group. Scale bar 50 µm. Cellular nuclei stained with Hoechst (blue).
Figure 9
Figure 9
VE cadherin-immunoreactive adherens junctions in brain biopsies after severe TBI. Photomicrographs of VE cadherin immunostaining in 3 individual biopsies from patients with a GOS-E 7–8 (AC). Photomicrographs of VE cadherin immunostaining in 3 individual biopsies from patients with a GOS-E 4 (DF). Photomicrographs of VE cadherin immunostaining in 3 individual biopsies from patients with a GOS-E 1 (GI). * p < 0.05, GOS-E 7–8 vs GOS-E 1. Results represent mean ± SEM (J). N = 3 per group. Scale bar 50 µm. Cellular nuclei stained with Hoechst (blue).
Figure 10
Figure 10
Classical anti-inflammatory arginase-1 marker and P2Y12-immunoreactivity in brain biopsies after severe TBI. Microglia are stained using P2Y12 (red) and the classical anti-inflammatory marker are stained with arginase-1 (green). Photomicrographs of P2Y12 and arginase-1 immunostaining in 3 individual biopsies from patients with a GOS-E 7–8 (AC). Photomicrographs of P2Y12 and arginase-1 immunostaining in 3 individual biopsies from patients with a GOS-E 4 (DF). Photomicrographs of P2Y12 and arginase-1 immunostaining in 3 individual biopsies from patients with a GOS-E 1 (GI). Inserts are enlarged dashed boxes showing cells with P2Y12 and arginase-1 coexpression (GI). No significance between immunoexpression in the GOS-E groups detected for overall arginase-1 expression (J) and the number of arginase-1 and P2Y12 positive cells (K). A few circular cells with both strong arginase-1 and P2Y12 detected, only present in the GOS-E 1 group (LN). Results represent mean ± SEM. N = 3 per group. Scale bars 50 µm (AI) and 25 µm (LN). Cellular nuclei stained with Hoechst (blue).
Figure 11
Figure 11
Classical pro-inflammatory CD16/32 marker and P2Y12-immunoreactivity in brain biopsies after severe TBI. Microglia are stained using P2Y12 (red) and the classical pro-inflammatory marker are stained with CD16/32 (green). Photomicrographs of P2Y12 and CD16/32 immunostaining in 3 individual biopsies from patients with a GOS-E 7–8 (AC). Photomicrographs of P2Y12 and CD16/32 immunostaining in 3 individual biopsies from patients with a GOS-E 4 (DF). Photomicrographs of P2Y12 and CD16/32 immunostaining in 3 individual biopsies from patients with a GOS-E 1 (GI). Inserts are enlarged dashed boxes showing cells with P2Y12 and CD16/32 coexpression (GI). No significance between immunoexpression in the GOS-E groups detected for overall CD16/32 expression (J) and the number of CD16/32 and P2Y12 positive cells (K). A limited number of circular cells with both strong CD16/32 and P2Y12 can be detected, but are only present in the GOS-E 1 group (LN). Results represent mean ± SEM. N = 3 per group. Scale bars 50 µm (AI) and 25 µm (LN). Cellular nuclei stained with Hoechst (blue).

Similar articles

Cited by

References

    1. Berg J., Tagliaferri F., Servadei F. Cost of trauma in Europe. Eur. J. Neurol. 2005;12((Suppl. 1)):85–90. doi: 10.1111/j.1468-1331.2005.01200.x. - DOI - PubMed
    1. Hardman J.M., Manoukian A. Pathology of head trauma. Neuroimaging Clin. 2002;12:175–187. doi: 10.1016/S1052-5149(02)00009-6. - DOI - PubMed
    1. Carney N., Totten A.M., O’Reilly C., Ullman J.S., Hawryluk G.W., Bell M.J., Bratton S.L., Chesnut R., Harris O.A., Kissoon N., et al. Guidelines for the Management of Severe Traumatic Brain Injury, Fourth Edition. Neurosurgery. 2017;80:6–15. doi: 10.1227/NEU.0000000000001432. - DOI - PubMed
    1. Ponsford J. Factors contributing to outcome following traumatic brain injury. NeuroRehabilitation. 2013;32:803–815. doi: 10.3233/NRE-130904. - DOI - PubMed
    1. Smith M. Monitoring intracranial pressure in traumatic brain injury. Anesth. Analg. 2008;106:240–248. doi: 10.1213/01.ane.0000297296.52006.8e. - DOI - PubMed

LinkOut - more resources