. 2022 Mar 2;10(3):583.
doi: 10.3390/biomedicines10030583.

Disruption of Colorectal Cancer Network by Polyphyllins Reveals Pivotal Entities with Implications for Chemoimmunotherapy

Affiliations

Disruption of Colorectal Cancer Network by Polyphyllins Reveals Pivotal Entities with Implications for Chemoimmunotherapy

Ram Siripuram et al. Biomedicines. .

Abstract

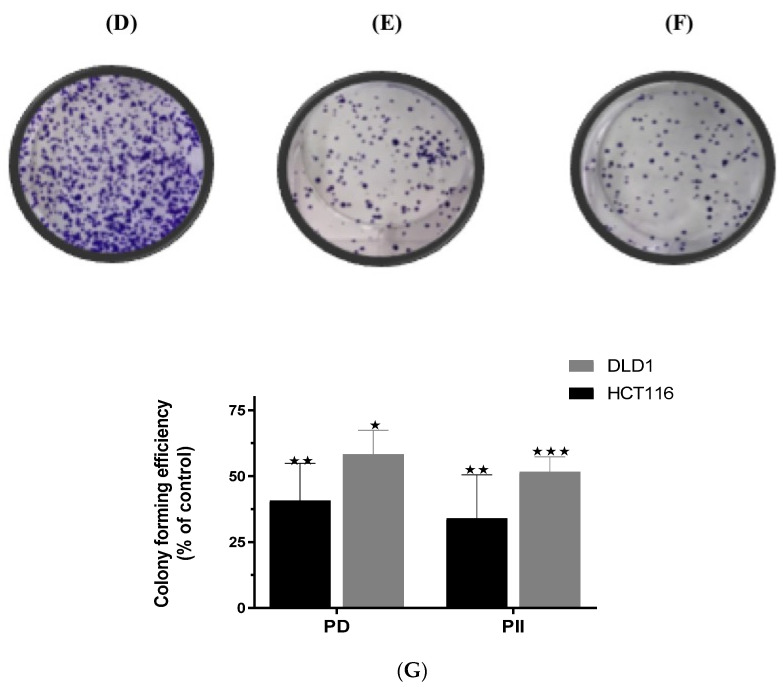
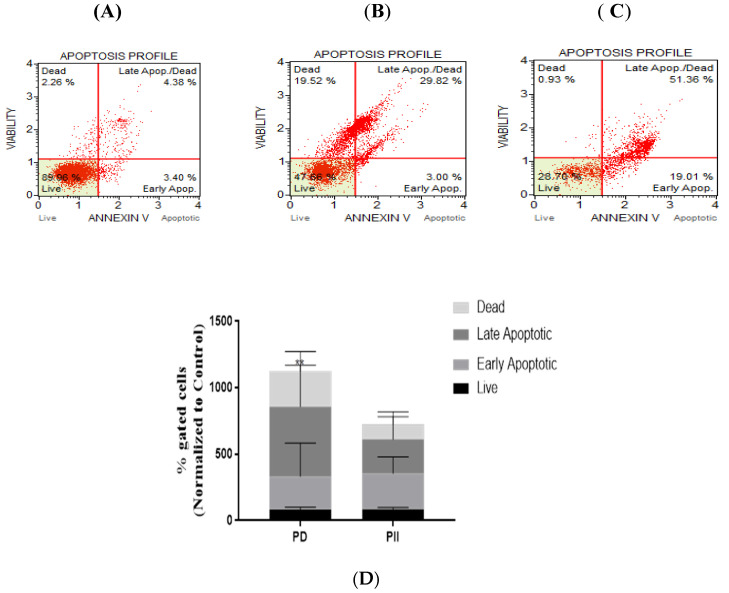
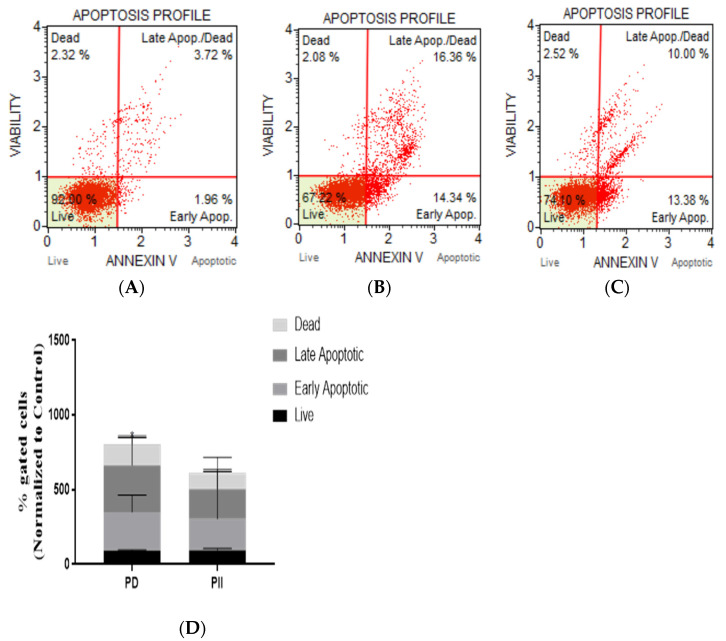
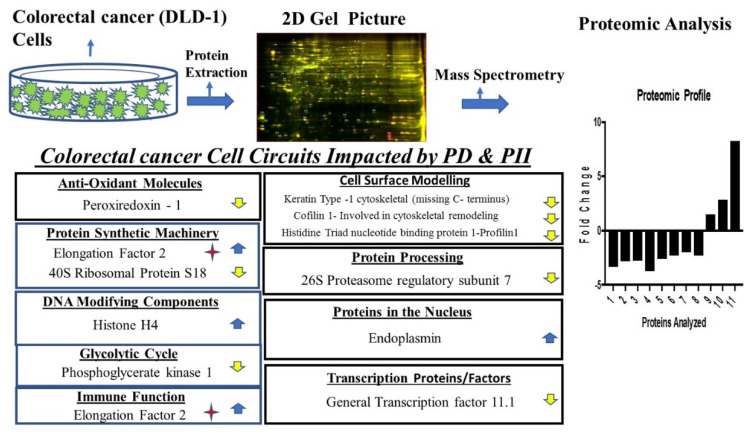
The prevalence of colorectal cancer has increased world-wide with high rates of mortality and morbidity. In the absence of efficacious drugs to treat this neoplasia, there is an imminent need to discover molecules with multifaceted effects. To this end, we opted to study the effect of steroidal saponins such as Polyphyllins. We performed anticancer activity studies with three analogs of Polyphyllins: Polyphyllin D (PD), Polyphyllin II (PII) and Polyphyllin G (PG). Here we show the potent effect of PD, PII (IC50 of 0.5-1 µM) and PG (IC50 of 3 µM) in inhibiting the viability of colorectal adenocarcinoma cells (DLD-1) and colorectal carcinoma cells (HCT116). PD and PII also showed inhibition of cell proliferation and sustained response upon withdrawal of the compounds when assessed by clonogenic assays in both the cell lines. Elucidation of the molecular mode of action revealed impact on the programmed cell death pathway. Additionally, proteomic profiling of DLD-1 revealed pivotal proteins differentially regulated by PD and PII, including a downregulated peroxiredoxin-1 which is considered as one of the novel targets to combat colorectal cancers and an upregulated elongation factor 2 (EF2), one of the key molecules considered as a tumor associated antigen (TAA) in colon cancer. Entities of cell metabolic pathways including downregulation of the key enzyme Phosphoglycerate kinase 1 of the glycolytic pathway was also observed. Importantly, the fold changes per se of the key components has led to the loss of viability of the colorectal cancer cells. We envision that the multifaceted function of PD and PII against the proliferation of colorectal carcinoma cells could have potential for novel treatments such as chemoimmunotherapy for colorectal adenocarcinomas. Future studies to develop these compounds as potent anti-colorectal cancer agents are warranted.

Keywords: DLD-1; HCT116; Polyphyllin D; Polyphyllin G; Polyphyllin II; apoptosis; proteomics.


Conflict of interest statement

The authors declare no conflict of interest.

Figures

Figure 1
Figure 1
Cytotoxicity of PD, PII and PG on DLD-1 and HCT116 cells. Cells were plated in 96 well-plates at a density of 5000 cells per well. After 24 h, the cells were treated with various concentrations of PD (A), PII (B), and PG (C) ranging from 0.1 µM to 100 µM and incubated for 72 h in triplicates. A CCK-8 assay was performed to assess the cell viability. The data points are the mean of three such independent experiments. Percent of viable cells in treatment groups was calculated by considering untreated control values as 100% and there was a significant decrease in cell viability in all treatment groups as per one-way ANOVA when compared to the untreated group. The p-value for DLD-1 cells was <0.0001, when treated with PD and PII from 0.5 µM onwards and from 2 µM onwards when treated with PG. The p-value for HCT116 cells was <0.0001, when treated with PD and PII from 1 µM onwards and from 2 µM onwards when treated with PG.
Figure 2
Figure 2
Colony forming efficiency of DLD-1 and HCT116 cells treated with PD and PII. Cells treated for 72 h with 0.5 µM of either PD or PII were seeded in 6 well-plates at a density of 500 cells per well in triplicates and allowed to form colonies over a period of 7–9 days. The colonies were fixed, and stained with crystal violet. For quantitative analysis, fixed colonies were lysed with 1% SDS, and absorbance readings were taken at 595 nm. The data points are the mean of three such independent trials. When the absorbance values of the treatment groups were normalized to the respective controls; there was a significant decrease in the colony forming efficiency of the treated cells when compared to control when assessed by one-way ANOVA. The p-value for DLD-1 cells was 0.03 when treated with PD and 0.0001 with PII treatment. For HCT116 cells, the p-value was <0.005 when treated with both PD and PII. (A) Representative image of clonogenic assay performed in DLD-1 control sample, (B) PD treated DLD-1sample, (C) PII treated DLD-1 sample. (D) Representative image of clonogenic assay performed in HCT116 control sample, (E) PD treated HCT116 sample, (F) PII treated HCT116 sample. (G) Colony forming efficiency of the treated samples normalized to the respective control samples are represented for both the cell systems. * p-value < 0.05; ** p-value < 0.01; *** p-value < 0.001.
Figure 2
Figure 2
Colony forming efficiency of DLD-1 and HCT116 cells treated with PD and PII. Cells treated for 72 h with 0.5 µM of either PD or PII were seeded in 6 well-plates at a density of 500 cells per well in triplicates and allowed to form colonies over a period of 7–9 days. The colonies were fixed, and stained with crystal violet. For quantitative analysis, fixed colonies were lysed with 1% SDS, and absorbance readings were taken at 595 nm. The data points are the mean of three such independent trials. When the absorbance values of the treatment groups were normalized to the respective controls; there was a significant decrease in the colony forming efficiency of the treated cells when compared to control when assessed by one-way ANOVA. The p-value for DLD-1 cells was 0.03 when treated with PD and 0.0001 with PII treatment. For HCT116 cells, the p-value was <0.005 when treated with both PD and PII. (A) Representative image of clonogenic assay performed in DLD-1 control sample, (B) PD treated DLD-1sample, (C) PII treated DLD-1 sample. (D) Representative image of clonogenic assay performed in HCT116 control sample, (E) PD treated HCT116 sample, (F) PII treated HCT116 sample. (G) Colony forming efficiency of the treated samples normalized to the respective control samples are represented for both the cell systems. * p-value < 0.05; ** p-value < 0.01; *** p-value < 0.001.
Figure 3
Figure 3
Analysis of apoptosis in DLD-1 cells treated with PD and PII. Representative scatter plots of three independent experiments performed for apoptotic population analysis by Annexin V detection. Cells treated with 0.5 µM of either PD or PII for 72 h were stained with the Muse Annexin V and Dead Cell reagent, and acquired on the Muse Cell Analyzer. Control sample (A), PD-treated sample (B), PII-treated sample (C), % gated profiles from the flow cytometry data normalized to the control for each of the treatments is shown (D), ** p-value = 0.0016.
Figure 4
Figure 4
Analysis of apoptosis in HCT116 cells treated with PD and PII. Representative scatter plots of three independent experiments performed for apoptotic population analysis by Annexin V detection. Cells were treated with 0.5 µM of either PD or PII for 72 h, stained with the Muse Annexin V and Dead Cell reagent, and acquired on the Muse Cell Analyzer. Control sample (A), PD-treated sample (B), PII-treated sample (C), % gated profiles from the flow cytometry data normalized to the control for each of the treatments is shown (D), * p-value = 0.032.
Figure 5
Figure 5
Proteomic analysis of DLD-1 cells treated with PD and PII. DLD-1 cells were treated with PD at 0.5 µM in duplicates of T-25 flask as mentioned in ‘Materials and Methods.’ Similarly, DLD-1 cells were treated with PII at 0.5 µM in duplicates and processed in an identical manner. In parallel, untreated DLD-1 cells (control group) were also processed in an identical manner. In (A), the 2D gel image is shown of the control (untreated) sample. 2D gel images of PD and PII treated samples are shown in (B,C). Gel image of an overlay of the control and PD-treated sample is shown in (D) and the PII-treated sample in (E). The number of differentially expressed proteins are shown in the heat map of proteins in (F) for PD and PII.
Figure 6
Figure 6
Schematic representation of pivotal pathways impacted by PD and PII in DLD-1 cells and the differentially regulated entities in each of the pathways identified. Arrows represent upregulated and downregulated molecules. The star represents its role in immune function. The numbers on the x-axis of the proteomic profile are the molecules numbered in the Table 1 for DLD-1.

Similar articles

Cited by

References

    1. United States Cancer Incidence, Centers for Disease Control and Prevention. [(accessed on 31 January 2022)]; Available online: https://gis.cdc.gov/Cancer/USCS/DataViz.html.
    1. Ayanian J.Z., Zaslavsky A.M., Fuchs C.S., Guadagnoli E., Creech C.M., Cress R.D., O’Connor L.C., West D.W., Allen M.E., Wolf R.E., et al. Use of adjuvant chemotherapy and radiation therapy for colorectal cancer in a population-based cohort. J. Clin. Oncol. 2003;21:1293–1300. doi: 10.1200/JCO.2003.06.178. - DOI - PubMed
    1. Edwards M.S., Chadda S.D., Zhao Z., Barber B.L., Sykes D.P. A systematic review of treatment guidelines for metastatic colorectal cancer. Colorectal Dis. 2012;14:e31–e47. doi: 10.1111/j.1463-1318.2011.02765.x. - DOI - PMC - PubMed
    1. Fakih M.G. Metastatic colorectal cancer: Current state and future directions. J. Clin. Oncol. 2015;33:1809–1824. doi: 10.1200/JCO.2014.59.7633. - DOI - PubMed
    1. Folprecht G., Grothey A., Alberts S., Raab H.R., Kohne C.H. Neoadjuvant treatment of unresectable colorectal liver metastases: Correlation between tumour response and resection rates. Ann. Oncol. 2005;16:1311–1319. doi: 10.1093/annonc/mdi246. - DOI - PubMed

LinkOut - more resources