. 2022 Mar 4;10(3):603.
doi: 10.3390/biomedicines10030603.

Influence of Fetomaternal Microchimerism on Maternal NK Cell Reactivity against the Child's Leukemic Blasts

Affiliations

Influence of Fetomaternal Microchimerism on Maternal NK Cell Reactivity against the Child's Leukemic Blasts

Lena-Marie Martin et al. Biomedicines. .

Abstract

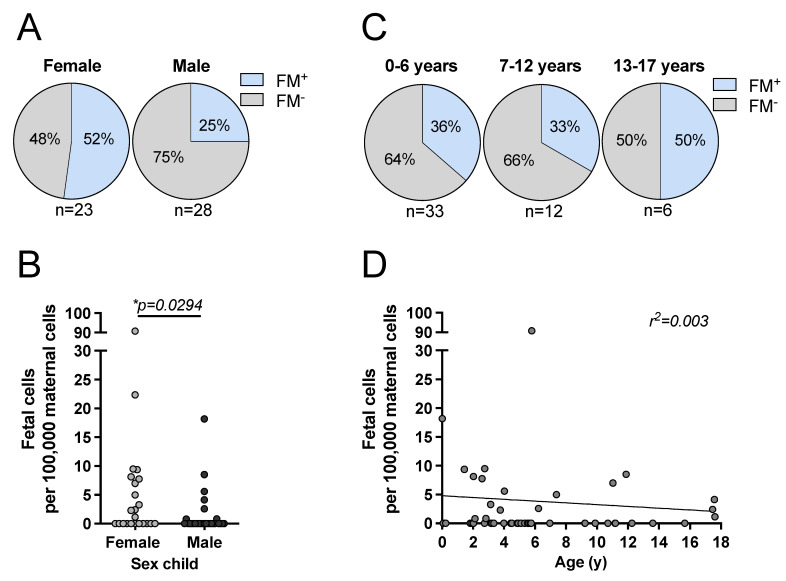
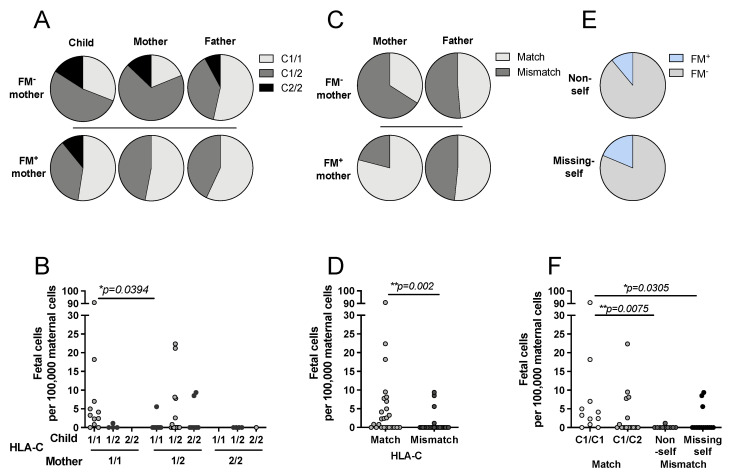
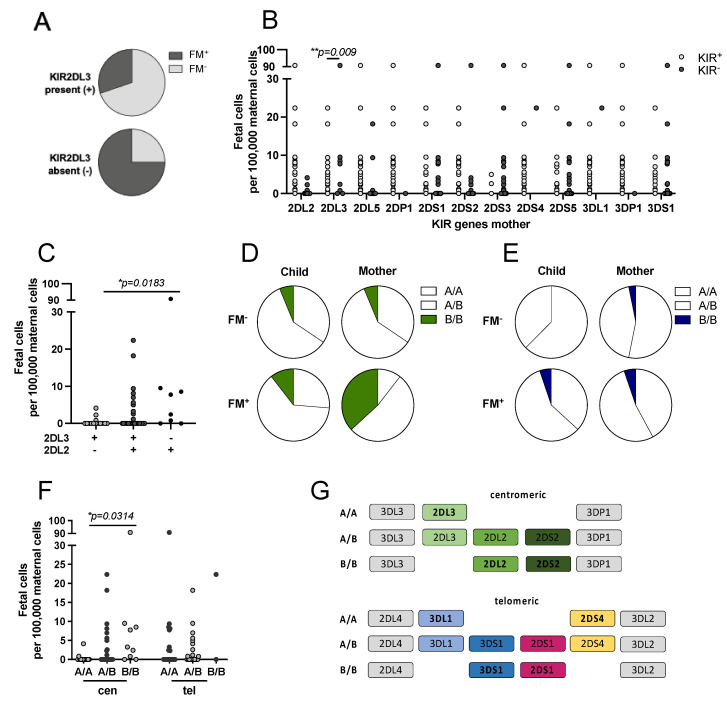
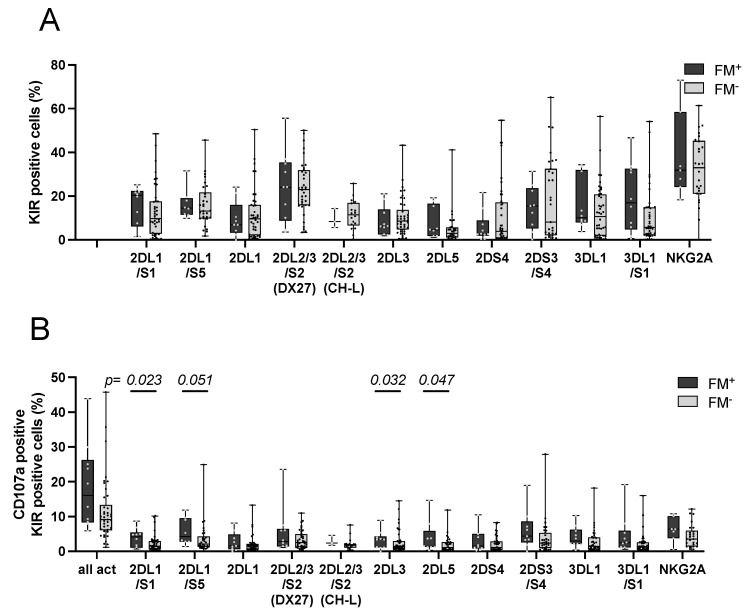
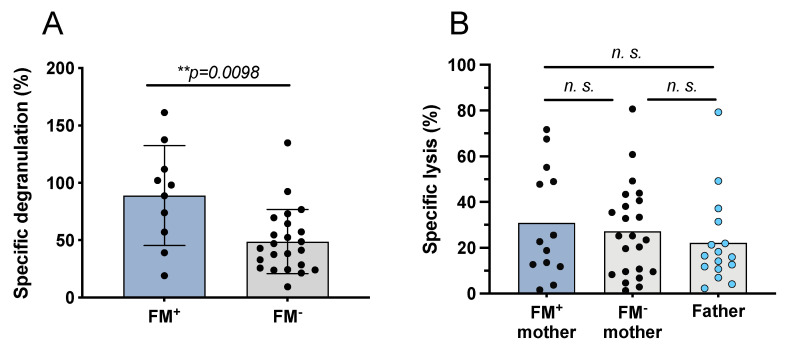
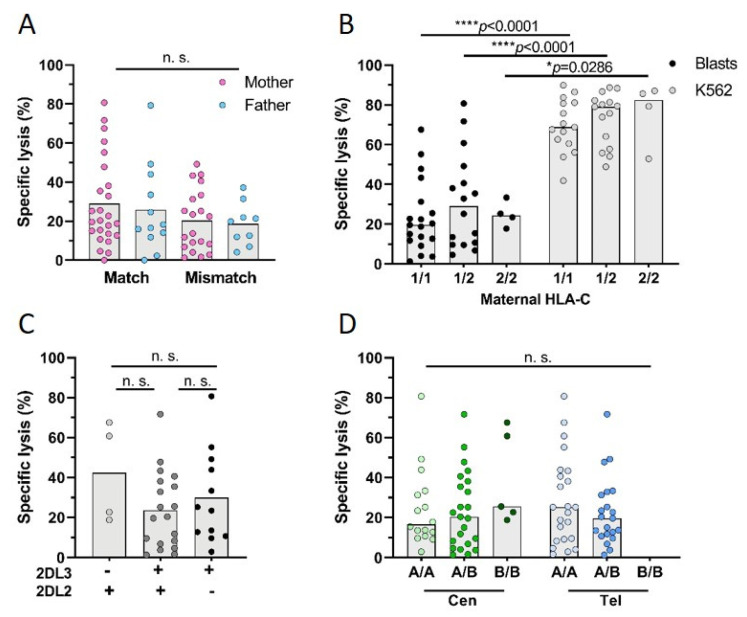
Persistence of fetal cells in the circulation of the mother (fetal microchimerism, FM) is associated with increased survival and reduced relapse of children with leukemia receiving a haploidentical hematopoietic stem cell transplantation (hHSCT). NK cells play an important role in maternal tolerance towards the unborn child. In this study, 70 mother-child pairs were prospectively analyzed for the occurrence of FM, KIR genotype and HLA-C type. We found that occurrence and level of FM were influenced by three maternal genetic factors: presence of an HLA-C1 allele, absence of KIR2DL3 and presence of a cen-B/B motif. Furthermore, an HLA-C match between mother and child favored persistence of FM. NK cells from FM+ mothers showed a 40% higher specific degranulation against their filial leukemic blasts than NK cells from FM- mothers, suggesting the presence of educated maternal NK cells. Nevertheless, cytotoxicity of parental NK cells against filial leukemic blasts was independent of KIR genetics (haplotype, B content score, centromeric and telomeric KIR gene regions) and independent of FM, indicating that additional immune effector mechanisms contribute to the beneficial effect of persisting FM in hHSCT.

Keywords: HLA; KIR; NK cell alloreactivity; fetal microchimerism; haploidentical stem cell transplantation.


Conflict of interest statement

The authors declare no conflict of interest.

Figures

Figure 1
Figure 1
Correlation of child’s sex and age on the occurrence with the level of FM cells. FM was determined in mothers using ddPCR. The frequency of microchimeric cells was compared between mothers grouped depending on their children’s (A) sex, (C) age, and the level of FM was compared within the groups (B,D). Statistical analyses were performed using (A) Fisher’s exact test, (B) Mann–Whitney test, (C) Chi2 test and (D) a simple linear regression analysis. Significance level * p < 0.05.
Figure 2
Figure 2
FM is favored in HLA-C matched mother–child pairs. Frequency and level of FM were analyzed in regard to filial or parental HLA-C genotypes. Child, mother, and father were grouped according to their HLA-C genotype into C1 or C2 homozygous or C1/C2 heterozygous. (A) Frequencies in child, mother and father grouped into FM+ and FM. (B) Level of FM in mother–child pairs grouped depending on their HLA-C genotype. (C) Frequencies of HLA-C match or mismatch between parent and child were compared in the FM+ and FM groups. (D) Level of FM was compared between matched or mismatched mothers. (E) Frequencies of FM+ and FM mothers, grouped depending on their mismatch either in non-self or missing-self. (F) Level of FM in all mothers grouped into match or mismatch; the mismatch cohort was further subdivided into non-self or missing-self. Criteria for grouping into HLA-C match and mismatch are depicted in Supplementary Figure S1B. FM was determined in mothers using ddPCR. Exact n values are provided in Supplementary Table S2. Statistical analysis of frequencies was performed using Fisher’s exact test for two groups or Chi2 for more than two. Mann–Whitney test or Kruskal–Wallis test followed by Dunn´s multiple comparison test was used to analyze differences in FM levels. Statistical significance * p < 0.05; ** p < 0.01.
Figure 3
Figure 3
Influence of KIR genes on the occurrence and level of FM. (A) Frequency of KIR2DL3 gene presence or absence in FM and FM+ mothers. (B) Mothers were KIR genotyped and grouped depending on presence or absence of KIR genes. Level of FM was compared in KIR positive and KIR negative groups. (C) Mothers were grouped depending on their KIR2DL2 and KIR2DL3 combinations and the level of FM was compared between the groups. (D,E) Child and mother were grouped depending on their centromeric and telomeric KIR genes and the presence or absence of FM. (D) Centromeric motif and (E) telomeric motif frequencies classified as depicted in (G). (F) Influence of maternal centromeric and telomeric KIR gene regions on the amount of microchimeric cells. (G) Illustration of the centromeric and telomeric KIR gene regions. Exact n values are provided in Supplementary Table S2. Statistical analysis of frequencies was performed using Fisher’s exact test for two groups or Chi2 for more than two. Mann–Whitney test was used for comparison of two groups; Kruskal–Wallis test followed by Dunn´s multiple comparison test was used for more than two groups. Statistical significance * p < 0.05; ** p < 0.01.
Figure 4
Figure 4
KIR expression in FM+ and FM mothers after co-culture with leukemic blasts. Maternal NK cells were isolated and IL-2/IL-15 pre-activated. The next day, cells were co-cultured with filial blasts in an E:T of 1:1 for four hours with addition of CD107a. After incubation, cells were stained with anti-KIR antibodies to determine the NK cell KIR phenotype. Mothers were grouped into FM+ and FM. (A) All cells positive for the respective KIR+, (B) CD107a+ activated cells of the respective KIR. For KIR2DL2/L3/S2, two different clones were used: DX27 and CH-L. FM+ n = 3–10, FM n = 31–42. Depicted are box and whiskers from min to max with each point representing one sample. Statistical analysis was performed using Mann–Whitney U test for comparison of FM+ to FM groups. Significance level p < 0.05.
Figure 5
Figure 5
Specific degranulation and lysis of activated NK cells of FM+ and FM mothers after co-culture with leukemic blasts or K562. (A) Maternal NK cells were isolated and IL-2/IL-15 pre-activated overnight. The next day, cells were co-cultured with filial leukemic blasts or K562 in an effector to target cell ratio (E:T) of 1:10, for four hours. Mothers were grouped into FM+ and FM. Specific degranulation of NK cells against filial blasts was calculated considering degranulation against K562 as maximum degranulation. (B) Analysis of maternal and paternal NK cell killing of leukemic blasts (E:T 10:1). Influence of a persisting FM (FM+) in mothers on NK cell cytotoxicity against filial blasts compared to fathers. Statistical analysis was performed using Wilcoxon test for paired samples and Mann–Whitney test for unpaired samples. Significance level ** p < 0.01, n. s. not significant.
Figure 6
Figure 6
Parental cytotoxicity against filial leukemic blasts: detailed analysis of subgroups. Parental NK cells were isolated and IL-2/IL-15 pre-activated overnight. The next day, their cytotoxicity was analyzed against filial blasts and the control cell line K562 in a FACS-based killing assay. (A) Analysis of maternal and paternal NK cell killing of leukemic blasts (E:T 10:1) grouped into HLA-C match or mismatch between child and either mother or father. (B) Mothers were grouped depending on their HLA-C genotype and lysis of blasts or K562 was analyzed. Influence of (C) maternal KIR2DL2 and KIR2DL3 genotype or (D) maternal centromeric (cen) or telomeric (tel) KIR gene motifs on maternal NK cells’ specific lysis of leukemic blasts. Each dot represents one sample, bars show mean of the group. Exact n values are provided in Supplementary Table S2. Statistical analysis was performed using Mann–Whitney test for comparisons of two groups and Kruskal–Wallis test followed by Dunn’s multiple comparison test for more than two groups. Statistical significance * p < 0.05; **** p < 0.0001, n. s. not significant.

Similar articles

Cited by

References

    1. Reisner Y., Hagin D., Martelli M.F. Haploidentical hematopoietic transplantation: Current status and future perspectives. Blood. 2011;118:6006–6017. doi: 10.1182/blood-2011-07-338822. - DOI - PubMed
    1. Marks D.I., Khattry N., Cummins M., Goulden N., Green A., Harvey J., Hunt L.P., Keen L., Robinson S.P., Steward C.G., et al. Haploidentical stem cell transplantation for children with acute leukaemia. Br. J. Haematol. 2006;134:196–201. doi: 10.1111/j.1365-2141.2006.06140.x. - DOI - PubMed
    1. Wang Y., Chang Y.J., Xu L.P., Liu K.Y., Liu D.H., Zhang X.H., Chen H., Han W., Chen Y.H., Wang F.R., et al. Who is the best donor for a related HLA haplotype-mismatched transplant? Blood. 2014;124:843–850. doi: 10.1182/blood-2014-03-563130. - DOI - PubMed
    1. Stern M., Ruggeri L., Mancusi A., Bernardo M.E., de Angelis C., Bucher C., Locatelli F., Aversa F., Velardi A. Survival after T cell-depleted haploidentical stem cell transplantation is improved using the mother as donor. Blood. 2008;112:2990–2995. doi: 10.1182/blood-2008-01-135285. - DOI - PMC - PubMed
    1. Ruggeri L., Eikema D.J., Bondanza A., Noviello M., van Biezen A., de Wreede L.C., Crucitti L., Vago L., Ciardelli S., Bader P., et al. Mother donors improve outcomes after HLA haploidentical transplantation: A Study by the Cellular Therapy and Immunobiology Working Party of the EBMT. Transplant. Cell. Ther. 2022 doi: 10.1016/j.jtct.2022.01.001. in press. - DOI - PubMed