. 2022 Mar 6;10(3):616.
doi: 10.3390/biomedicines10030616.

Bezafibrate Reduces Elevated Hepatic Fumarate in Insulin-Deficient Mice

Affiliations

Bezafibrate Reduces Elevated Hepatic Fumarate in Insulin-Deficient Mice

Andras Franko et al. Biomedicines. .

Abstract

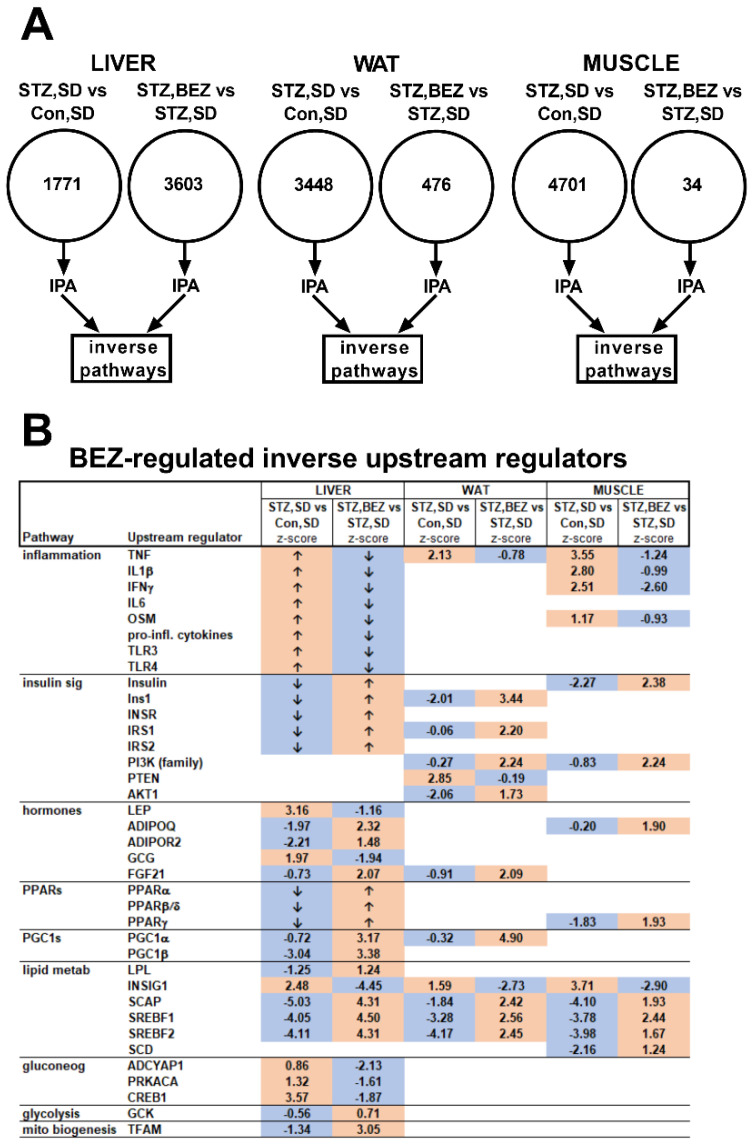
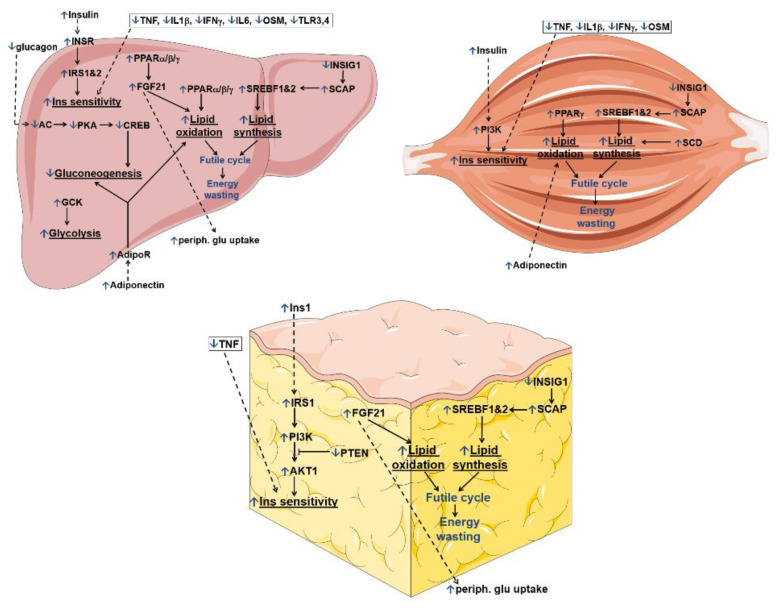
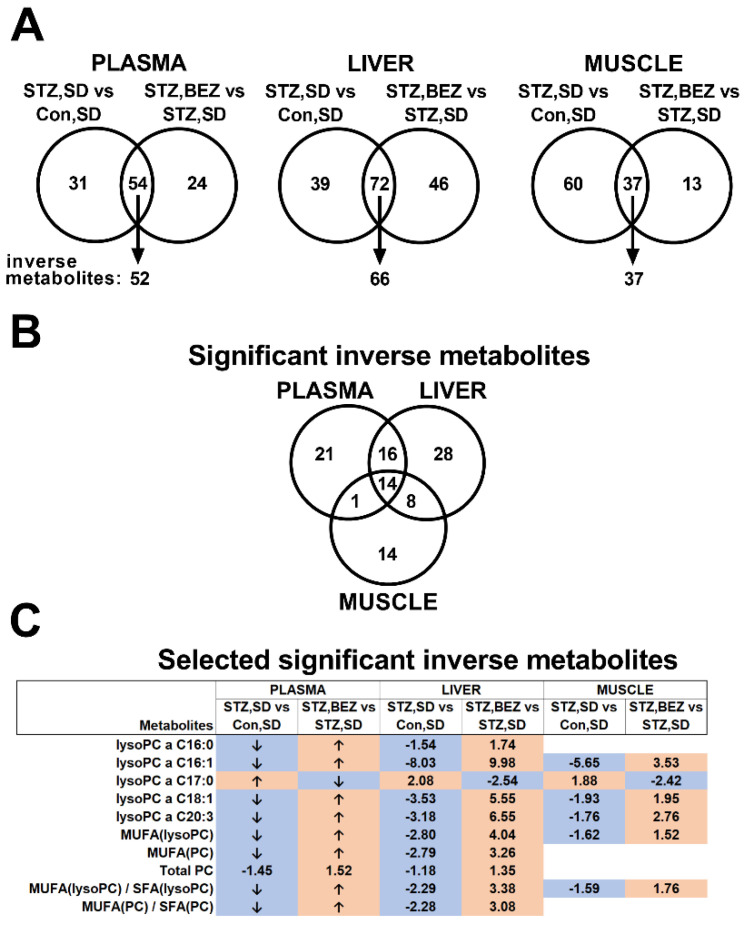
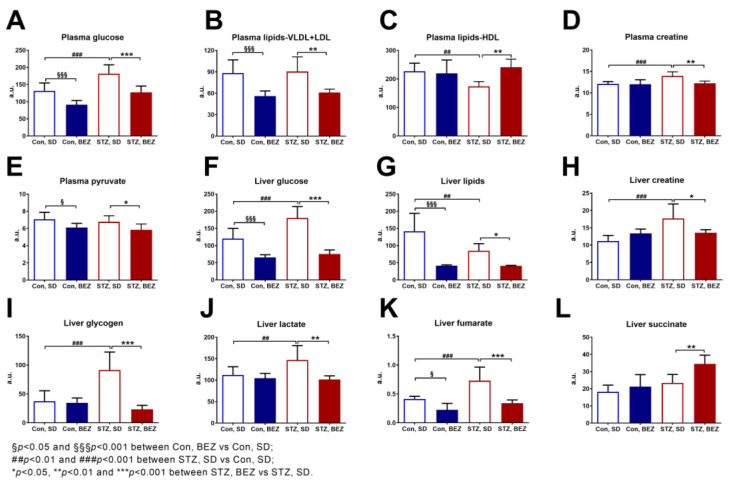
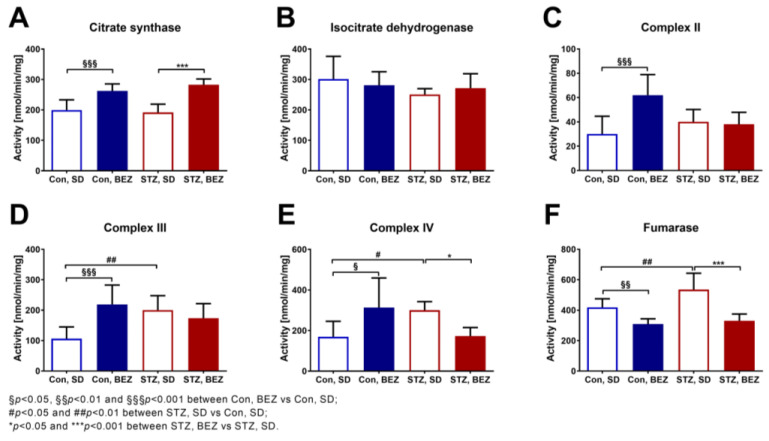
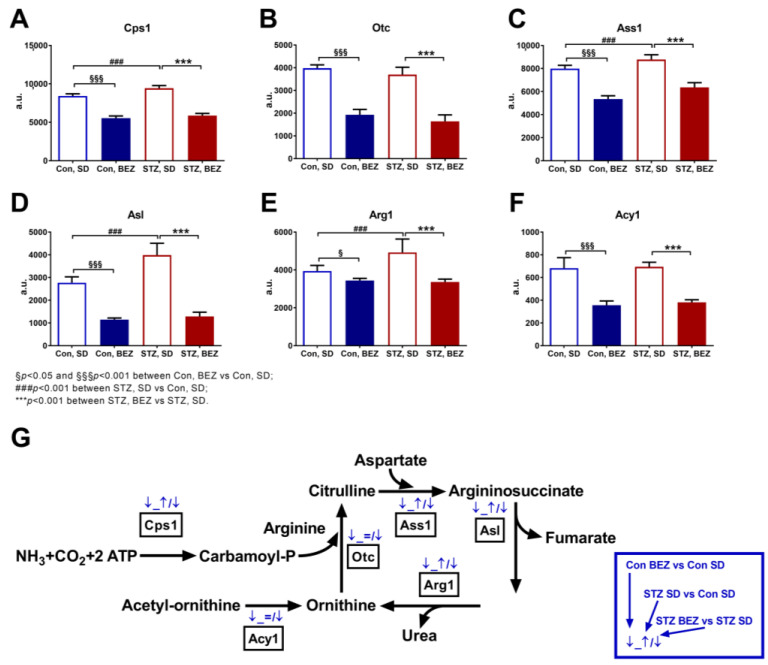
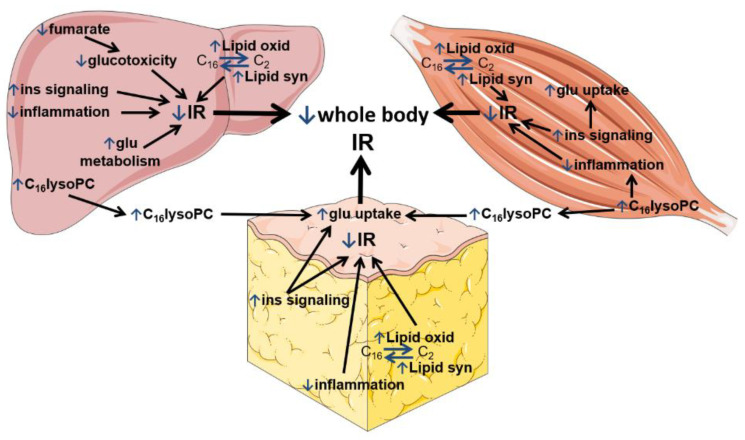
Glucotoxic metabolites and pathways play a crucial role in diabetic complications, and new treatment options which improve glucotoxicity are highly warranted. In this study, we analyzed bezafibrate (BEZ) treated, streptozotocin (STZ) injected mice, which showed an improved glucose metabolism compared to untreated STZ animals. In order to identify key molecules and pathways which participate in the beneficial effects of BEZ, we studied plasma, skeletal muscle, white adipose tissue (WAT) and liver samples using non-targeted metabolomics (NMR spectroscopy), targeted metabolomics (mass spectrometry), microarrays and mitochondrial enzyme activity measurements, with a particular focus on the liver. The analysis of muscle and WAT demonstrated that STZ treatment elevated inflammatory pathways and reduced insulin signaling and lipid pathways, whereas BEZ decreased inflammatory pathways and increased insulin signaling and lipid pathways, which can partly explain the beneficial effects of BEZ on glucose metabolism. Furthermore, lysophosphatidylcholine levels were lower in the liver and skeletal muscle of STZ mice, which were reverted in BEZ-treated animals. BEZ also improved circulating and hepatic glucose levels as well as lipid profiles. In the liver, BEZ treatment reduced elevated fumarate levels in STZ mice, which was probably due to a decreased expression of urea cycle genes. Since fumarate has been shown to participate in glucotoxic pathways, our data suggests that BEZ treatment attenuates the urea cycle in the liver, decreases fumarate levels and, in turn, ameliorates glucotoxicity and reduces insulin resistance in STZ mice.

Keywords: bezafibrate; diabetes; fumarate; insulin resistance; lysophosphatidylcholine.


Conflict of interest statement

The authors declare no conflict of interest. A.F. is an employee of JOTEC GmbH, however, the company had no role in the design of the study; in the collection, analyses, or interpretation of data; in the writing of the manuscript, or in the decision to publish the results.

Figures

Figure 1
Figure 1
Microarray analysis in liver, white adipose tissue (WAT) and skeletal muscle samples of BEZ-treated STZ mice. (A) Schematic representation of microarray results. The numbers given in the circles depict the number of significantly differently expressed genes comparing STZ, SD vs. Con, SD as well as STZ, BEZ vs. STZ, SD, respectively. The statistical analysis was performed using significance analysis of microarrays algorithm with FDR of 10%. Upstream regulator tool of ingenuity pathway analysis (IPA) was applied on these significant genes with the focus on inverse pathways, n = 5–7. (B) Inverse upstream regulator pathways of IPA analysis between STZ, SD vs. Con, SD as well as STZ, BEZ vs. STZ, SD comparisons. Numbers and arrows denote z-scores of upstream regulator IPA pathways. The z-scores > 0 represent activated, whereas z-scores < 0 represent inhibited pathways. Values > 2 or <−2 indicate significant results, whereas values between −2 and 2 depict trends. “↑” or “↓” arrows show activated or inhibited upstream regulators described in [1] and the publisher granted permission to reuse the data. Orange or blue colors indicate activated or inhibited pathways, respectively. The theoretical order of the identified pathways, which are possibly involved in insulin sensitivity, glucose and lipid metabolism, are shown in Figure 2. Abbreviations: TNF: tumor necrosis factor, IL: interleukin, IFN: interferon, OSM: oncostatin M, pro-inf: pro-inflammatory, TLR: toll-like receptor, Ins1: insulin 1, INSR: insulin receptor, IRS: insulin receptor substrate, PI3K: phosphatidylinositol-4,5-bisphosphate 3-kinase, PTEN: phosphatase and tensin homolog, AKT: AKT serine/threonine kinase, LEP: leptin, ADIPOQ: adiponectin, ADIPOR: adiponectin receptor, GCG: glucagon, FGF: fibroblast growth factor, PPAR: peroxisome proliferator-activated receptor, PGC: peroxisome proliferator-activated receptor gamma coactivator, LPL: lipoprotein lipase, INSIG: insulin-induced gene, SCAP: SREBF chaperone, SREBF: sterol regulatory element-binding transcription factor, SCD: stearoyl-CoA desaturase, ADCYAP1: adenylate cyclase activating polypeptide 1, PRKACA: protein kinase A, CREB: cAMP response element-binding protein, GCK: glucokinase, TFAM: mitochondrial transcription factor A.
Figure 2
Figure 2
Theoretical order of the IPA transcriptional upstream regulator pathways, which are altered upon BEZ treatment. All IPA upstream regulator pathways of the liver, WAT and skeletal muscle tissues are shown in Figure 1. This figure summarizes those pathways, which are possibly involved in insulin (Ins) sensitivity, glucose as well as lipid metabolism. Blue “↑” or “↓” arrows show BEZ-activated or BEZ-inhibited pathways. Black arrows represent direct, whereas dashed arrows denote indirect regulations.
Figure 3
Figure 3
Targeted metabolomics analysis in plasma, liver and skeletal muscle samples of BEZ-treated STZ mice. (A) Schematic representation of targeted metabolomics results. Significantly altered common metabolites and metabolite ratios comparing STZ, SD vs. Con, SD and STZ, BEZ vs. STZ, SD, respectively, were identified in plasma, liver and skeletal muscle samples. Wilcoxon–Mann–Whitney test with FDR of 10% was applied, n = 5–7. Those metabolites and metabolite ratios, which showed inverse regulation, were further analyzed. (B) The number of significant inversely regulated metabolites in plasma, liver and skeletal muscle tissues, which are common in the analyzed tissues. (C) Fold changes of selected significantly inversely regulated metabolites are shown, which are common in the analyzed tissues. Fold changes were calculated by dividing the appropriate mean of groups. “↑” or “↓” arrows show increased or decreased metabolites already described in [1] and the publisher granted permission to reuse the data. Orange or blue colors indicate increased or decreased metabolites, respectively. Abbreviations: PC: phosphatidylcholine, lysoPC: lysophosphatidylcholine, SFA: saturated fatty acid, MUFA: monounsaturated fatty acid, a: acyl.
Figure 4
Figure 4
NMR-based metabolomics analyses in plasma and liver samples of BEZ-treated STZ mice. Metabolites measured in (AE) plasma and (FL) liver samples. Columns represent averages ± standard deviation; n = 6–8. ANOVA with post hoc Holm–Sidák multiple comparison test was applied. Abbreviations: VLDL: very-low-density lipoprotein, LDL: low-density lipoprotein, HDL: high-density lipoprotein, a.u.: arbitrary unit.
Figure 5
Figure 5
Mitochondrial enzyme activities were measured in liver samples of BEZ-treated STZ mice (AF). Columns represent averages ± standard deviation; n = 6–8. ANOVA with post hoc Holm–Sidák multiple comparison test was applied.
Figure 6
Figure 6
Transcript levels of urea cycle enzymes in liver samples of BEZ-treated STZ mice. (AF) Columns represent averages ± standard deviation; n = 5–7. ANOVA with post hoc Holm–Sidák multiple comparison test was applied. (G) This figure summarizes the hepatic urea cycle genes, which were significantly differentially expressed upon BEZ treatment. The first blue arrow shows the comparison of Con, BEZ vs. Con, SD; the second blue arrow shows the comparison of STZ, SD vs. Con, SD; and the third blue arrow shows the comparison of STZ, BEZ vs. STZ, SD groups (for details see the blue rectangle on the right side). Blue “↑” or “↓” arrows show BEZ-activated or BEZ-inhibited genes. Abbreviations: Cps1: carbamoyl-phosphate synthase 1, Otc: ornithine transcarbamylase, Ass1: argininosuccinate synthase 1, Asl: argininosuccinate lyase, Arg1: arginase 1, Acy1: aminoacylase 1, a.u.: arbitrary unit.
Figure 7
Figure 7
BEZ-modified metabolic pathways, which reduce whole-body insulin resistance (IR). The figure summarizes the beneficial effects of BEZ in the liver (left side), skeletal muscle (right side) and white adipose tissue (in the middle), which are possibly involved in insulin sensitivity, glucose and lipid metabolism reducing whole-body insulin resistance (IR). Blue “↑” or “↓” arrows show BEZ-activated or BEZ-inhibited pathways. Abbreviations: lipid oxid: lipid oxidation, lipid syn: lipid synthesis, ins: insulin, glu: glucose, lysoPC: lysophosphatidylcholine, IR: insulin resistance.

Similar articles

Cited by

References

    1. Franko A., Huypens P., Neschen S., Irmler M., Rozman J., Rathkolb B., Neff F., Prehn C., Dubois G., Baumann M., et al. Bezafibrate Improves Insulin Sensitivity and Metabolic Flexibility in STZ-Induced Diabetic Mice. Diabetes. 2016;65:2540–2552. doi: 10.2337/db15-1670. - DOI - PubMed
    1. Grygiel-Gorniak B. Peroxisome proliferator-activated receptors and their ligands: Nutritional and clinical implications—A review. Nutr. J. 2014;13:17. doi: 10.1186/1475-2891-13-17. - DOI - PMC - PubMed
    1. Shipman K.E., Strange R.C., Ramachandran S. Use of fibrates in the metabolic syndrome: A review. World J. Diabetes. 2016;7:74–88. doi: 10.4239/wjd.v7.i5.74. - DOI - PMC - PubMed
    1. King A.J. The use of animal models in diabetes research. Br. J. Pharmacol. 2012;166:877–894. doi: 10.1111/j.1476-5381.2012.01911.x. - DOI - PMC - PubMed
    1. Montaigne D., Butruille L., Staels B. PPAR control of metabolism and cardiovascular functions. Nat. Rev. Cardiol. 2021;18:809–823. doi: 10.1038/s41569-021-00569-6. - DOI - PubMed