Different HSP90 Inhibitors Exert Divergent Effect on Myxoid Liposarcoma In Vitro and In Vivo
- PMID: 35327426
- PMCID: PMC8945459
- DOI: 10.3390/biomedicines10030624
Different HSP90 Inhibitors Exert Divergent Effect on Myxoid Liposarcoma In Vitro and In Vivo
Abstract
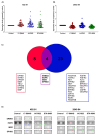
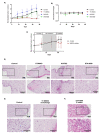
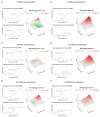
The therapeutic options for patients with relapsed or metastatic myxoid liposarcoma (MLS) remain scarce and there is currently no targeted therapy available. Inhibition of the HSP90 family of chaperones has been suggested as a possible therapeutic option for patients with MLS. However, the clinical effect of different HSP90 inhibitors vary considerably and no comparative study in MLS has been performed. Here, we evaluated the effects of the HSP90 inhibitors 17-DMAG, AUY922 and STA-9090 on MLS cell lines and in an MLS patient-derived xenograft (PDX) model. Albeit all drugs inhibited in vitro growth of MLS cell lines, the in vivo responses were discrepant. Whereas 17-DMAG inhibited tumor growth, AUY922 surprisingly led to increased tumor growth and a more aggressive morphological phenotype. In vitro, 17-DMAG and STA-9090 reduced the activity of the MAPK and PI3K/AKT signaling pathways, whereas AUY922 led to a compensatory upregulation of downstream ERK. Furthermore, all three tested HSP90 inhibitors displayed a synergistic combination effect with trabectidin, but not with doxorubicin. In conclusion, our results indicate that different HSP90 inhibitors, albeit having the same target, can vary significantly in downstream effects and treatment outcomes. These results should be considered before proceeding into clinical trials against MLS or other malignancies.
Keywords: HSP90 inhibition; combination therapy; drug treatment; myxoid liposarcoma; receptor tyrosine kinase signaling.
Conflict of interest statement
A.S. declares stock ownership and is a board member in Tulebovaasta, Iscaff Pharma and SiMSen Diagnostics AB. The other authors declare no conflict of interest. The funders had no role in the design of the study; in the collection, analyses, or interpretation of data; in the writing of the manuscript, or in the decision to publish the results.
Figures


Similar articles
-
Hsp90 inhibition by AUY922 as an effective treatment strategy against myxoid liposarcoma.Cancer Lett. 2015 Oct 28;367(2):147-56. doi: 10.1016/j.canlet.2015.07.025. Epub 2015 Jul 28. Cancer Lett. 2015. PMID: 26225840
-
HSP90 inhibition blocks ERBB3 and RET phosphorylation in myxoid/round cell liposarcoma and causes massive cell death in vitro and in vivo.Oncotarget. 2016 Jan 5;7(1):433-45. doi: 10.18632/oncotarget.6336. Oncotarget. 2016. PMID: 26595521 Free PMC article.
-
Phosphatidylinositol-3-kinase (PI3K)/Akt Signaling is Functionally Essential in Myxoid Liposarcoma.Mol Cancer Ther. 2019 Apr;18(4):834-844. doi: 10.1158/1535-7163.MCT-18-0763. Epub 2019 Feb 20. Mol Cancer Ther. 2019. PMID: 30787173
-
Tumor Suppression Efficacy of Heat Shock Protein 90 Inhibitor 17AAG in a Liposarcoma Mouse Model.Anticancer Res. 2017 Nov;37(11):6291-6302. doi: 10.21873/anticanres.12080. Anticancer Res. 2017. PMID: 29061812
-
A comprehensive review of the current evidence for trabectedin in advanced myxoid liposarcoma.Cancer Treat Rev. 2019 Jan;72:37-44. doi: 10.1016/j.ctrv.2018.11.003. Epub 2018 Nov 15. Cancer Treat Rev. 2019. PMID: 30468937 Review.
References
-
- Rodriguez R., Tornin J., Suarez C., Astudillo A., Rubio R., Yauk C., Williams A., Rosu-Myles M., Funes J.M., Boshoff C., et al. Expression of FUS-CHOP fusion protein in immortalized/transformed human mesenchymal stem cells drives mixoid liposarcoma formation. Stem Cells. 2013;31:2061–2072. doi: 10.1002/stem.1472. - DOI - PubMed
Grants and funding
- FB21-34/Assar Gabrielsson Foundation
- Johan Jansson Foundation for Cancer Research
- Anna-Lisa and Bror Björnsson Foundation
- 19-0306/Swedish Cancer Society
- 20-1098/Swedish Cancer Society
- Wilhelm and Martina Lundgren Foundation for Scientific Research
- Lions cancerfund West
- Sweden's Innovation Agency
- Region Västra Götaland
- 2020-01008/Swedish Research Council
- The Sjöberg Foundation
- ALFGBG-875751/The Swedish state under the agreement between the Swedish government and the county councils, the ALF-agreement
- 722211/The Swedish state under the agreement between the Swedish government and the county councils, the ALF-agreement
- 965065/The Swedish state under the agreement between the Swedish government and the county councils, the ALF-agreement
- 716321/The Swedish state under the agreement between the Swedish government and the county councils, the ALF-agreement
LinkOut - more resources
Full Text Sources
Miscellaneous

