. 2022 Mar 9;10(3):636.
doi: 10.3390/biomedicines10030636.

SARS-CoV-2 mRNA Vaccine-Induced Cellular and Humoral Immunity in Hemodialysis Patients

Affiliations

SARS-CoV-2 mRNA Vaccine-Induced Cellular and Humoral Immunity in Hemodialysis Patients

Ewa Kwiatkowska et al. Biomedicines. .

Abstract

Background/aims: Chronic kidney disease CKD patients on intermittent hemodialysis IHD are exposed to SARS-CoV-2 infection and carry a risk of developing severe symptoms. The aim of this study was to evaluate the humoral and cellular immunity induced by two doses of mRNA vaccines, the Pfizer-BioNTech (Comirnaty) COVID-19 Vaccine and the Moderna (mRNA-1273) COVID-19 vaccine.

Patients and methods: The study included 281 patients from five dialysis centers in northern Poland. Within 2 weeks prior to the first dose of the vaccine, a blood sample was collected for an evaluation of SARS-CoV-2 antibodies. Thirty to forty-five days after the second dose of the vaccine, a blood sample was taken to evaluate humoral and cellular response.

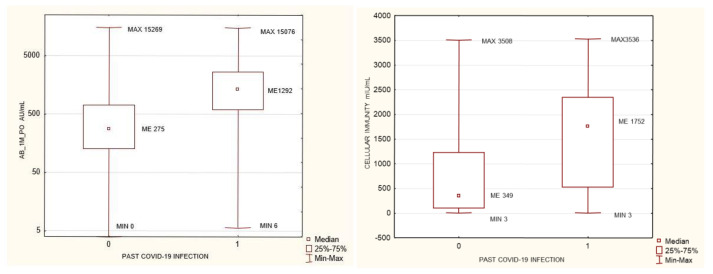
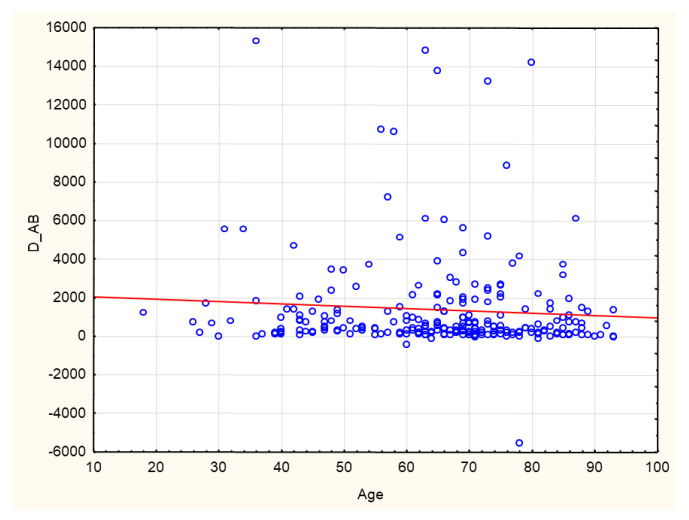
Results: Patients with stage 5 CKD on IHD were characterized by a considerable SARS-CoV-2 vaccine-induced seroconversion rate. The strongest factors influencing the antibodies AB level after vaccination were a pre-vaccination history of SARS-CoV-2 infection, age, the neutrophil-to-lymphocyte ratio NLR, neutrophil absolute count, and the hemoglobin level. Cellular immunity was higher in patients with a pre-vaccination history of SARS-CoV-2 infection. Cellular immunity depended on the albumin level. Positive cellular response to vaccination was a positive factor reducing all-cause mortality, except for COVID-19 mortality (no such deaths were reported during our follow-up). Cellular immunity and humoral immunity were positively mutually dependent. High levels of albumin and hemoglobin, low neutrophil count, and a reduced NLR, translated into better response to vaccination.

Conclusions: Patients with stage 5 CKD on IHD were characterized by a considerable SARS-CoV-2 vaccine-induced seroconversion rate and a good rate of cellular immunity. The factors that change with exacerbating inflammation and malnutrition (albumin, hemoglobin, neutrophil count, the NLR) affected the efficacy of the vaccination.

Keywords: SARS-CoV-2; cellular immunity; humoral immunity; mRNA vaccination.


Conflict of interest statement

The authors declare no conflict of interest.

Figures

Figure 1
Figure 1
Anti-SARS-CoV-2 antibody levels prior to and after vaccination in groups that developed positive or negative cellular immunity. p = 0.004 and p = 1.77 × 10–05, respectively. Mann–Whitney U test. AB_1M_PO- anti SARS-CoV2 antibody level one month after completed vaccination, CELLULAR IMMUNITY after completed vaccination: INFγ concentration > 200 mIU/mL positive, <100 mIU/mL negative.
Figure 2
Figure 2
Anti-SARS-CoV-2 antibody levels prior to and after vaccination in groups that developed positive or negative cellular immunity. P = 0.004 and p = 1.77 × 10–05, respectively. Mann-Whitney U test. AB_1M_PO- anti SARS-CoV2 antibody level one month after completed vaccination, CELLULAR IMMUNITY after completed vaccination: INFγ concentration >200 mIU/mL positive, <100 mIU/mL negative.
Figure 3
Figure 3
Statistically significant differences in antibody levels against SARS-CoV2 before vaccination between the extreme terciles of AB levels after SARS-CoV-2 vaccination <237 AU/mL and >970 AU/mL p = 5.26 × 10⁻¹¹. Mann–Whitney U test. AB: antibody.
Figure 4
Figure 4
Statistically significant differences in cellular immunity between the extreme terciles of AB levels after SARS-CoV-2 vaccination <237 AU/mL and >970 AU/mL p = 5.66 × 10–08. Mann–Whitney U test. CELLULAR IMMUNITY after completed vaccination: INFγ concentration mIU/mL, AB: antibody.
Figure 5
Figure 5
Statistically significant differences in weekly time on HD between the extreme terciles of AB levels after SARS-CoV-2 vaccination <237 AU/mL and >970 AU/mL p = 0.018. Mann–Whitney U test. AB: antibody.
Figure 6
Figure 6
Statistically significant differences in neutrophiles concentration (g/L) between the extreme terciles of AB levels after SARS-CoV-2 vaccination <237 AU/mL and >970 AU/mL p = 0.03. Mann–Whitney U test. AB: antibody.
Figure 7
Figure 7
Statistically significant differences in creatinine concentration (mg/dL) before HD between the extreme terciles of AB levels after SARS-CoV-2 vaccination <237 AU/mL and >970 AU/mL p = 0.03. Mann–Whitney U test. AB: antibody.
Figure 8
Figure 8
The group of patients with no history of SARS-CoV-2 infection prior to vaccination. Statistically significant differences in cellular immunity between the extreme terciles of post-SARS-CoV-2 vaccination antibody levels <237 AU/mL and >970 AU/mL. p = 1.14 × 10⁻¹¹. Mann–Whitney U test. AB: antibody.
Figure 9
Figure 9
The group of patients with no history of SARS-CoV-2 infection prior to vaccination. Statistically significant differences in neutrophiles concentration (g/L) between the extreme terciles of post-SARS-CoV-2 vaccination antibody levels <237 AU/mL and >970 AU/mL. Mann–Whitney U test. p = 0.03. AB: antibody.
Figure 10
Figure 10
The group of patients with no history of SARS-CoV-2 infection prior to vaccination. Statistically significant differences in the neutrophil-to-lymphocyte ratio between the extreme terciles of post-SARS-CoV-2 vaccination antibody levels <237 AU/mL and >970 AU/mL. Mann–Whitney U test. p = 0.03. AB: antibody, NLR: neutrophil-to-lymphocyte ratio.
Figure 11
Figure 11
Negative correlation between age (years) and anti-SARS-CoV-2 antibody levels (AU/mL) at 1 month after completion of the vaccination course (p = 0.04; R −0.12). Spearman’s rank correlation test. AB: antibody.
Figure 12
Figure 12
Negative correlation between the delta of antibodies (AU/mL) before and after vaccination and age (years). (p = 0.026; R −0.14) Spearman’s rank correlation test. D_AB: delta of antibody. Antibody levels before and after completion of the vaccination course.
Figure 13
Figure 13
Positive correlation between pre-vaccination AB levels and the AB levels at 1 month after the 2nd dose of SARS-CoV-2 vaccine (AU/mL). (p = 1.1 × 10⁻¹⁴, R 0.47). Spearman’s rank correlation test. AB: antibody.
Figure 14
Figure 14
Positive correlation between pre-vaccination AB levels (AU/mL) and cellular immunity (INFγ concentration mIU/mL) at 1 month after the 2nd dose of SARS-CoV-2 vaccine (p = 7.95 × 1009, R 0.43). Spearman’s rank correlation test.
Figure 15
Figure 15
Positive correlation between AB levels (AU/mL) at 1 month after the 2nd dose of SARS-CoV-2 vaccine and cellular immunity (INFγ concentration mIU/mL) at the same time (p = 8.6 × 10⁻¹¹, R 0.44). Spearman’s rank correlation test.
Figure 16
Figure 16
Positive correlation between AB levels (AU/mL) at 1 month after the 2nd dose of SARS-CoV-2 vaccine and the weekly time (hours) on HD (p = 0.017, R 0.14). Spearman’s rank correlation test. AB: antibody, HD: hemodialysis.
Figure 17
Figure 17
Negative correlation between AB levels (AU/mL) at 1 month after the 2nd dose of SARS-CoV-2 vaccine and neutrophil concentrations (g/L) (p = 0.03, R −0.13). Spearman’s rank correlation test. AB: antibody, NEU: neutrophil.
Figure 18
Figure 18
Positive correlation between AB levels (AU/mL) at 1 month after the 2nd dose of SARS-CoV-2 vaccine and creatinine concentrations before HD (p = 0.018, R 0.17). Spearman’s rank correlation test. AB: antibody.
Figure 19
Figure 19
Positive correlation between cellular immunity (INFγ concentration mIU/mL) at 1 month after the 2nd dose of SARS-CoV-2 vaccine and albumin concentrations (g/L) (p = 0.02, R 0.16). Spearman’s rank correlation test.

References

    1. Mahase E. COVID-19: First coronavirus was described in The BMJ in 1965. BMJ. 2020;369:m1547. doi: 10.1136/bmj.m1547. - DOI - PubMed
    1. Inchingolo A.D., Inchingolo A.M., Bordea I.R., Malcangi G., Xhajanka E., Scarano A., Lorusso F., Farronato M., Tartaglia G.M., Isacco C.G., et al. SARS-CoV-2 Disease through Viral Genomic and Receptor Implications: An Overview of Diagnostic and Immunology Breakthroughs. Microorganisms. 2021;9:793. doi: 10.3390/microorganisms9040793. - DOI - PMC - PubMed
    1. Bordea I.R., Candrea S., Sălăgean T., Pop I.D., Lucaciu O., Ilea A., Manole M., Băbțan A.-M., Sirbu A., Hanna R. Impact of COVID-19 Pandemic on Healthcare Professionals and Oral Care Operational Services: A Systemic Review. Risk Manag. Heal. Policy. 2021;14:453–463. doi: 10.2147/RMHP.S284557. - DOI - PMC - PubMed
    1. Francis A., Baigent C., Ikizler T.A., Cockwell P., Jha V. The urgent need to vaccinate dialysis patients against severe acute respiratory syndrome coronavirus 2: A call to action. Kidney Int. 2021;99:791–793. doi: 10.1016/j.kint.2021.02.003. - DOI - PMC - PubMed
    1. De Meester J., De Bacquer D., Naesens M. Incidence, characteristics, and outcome of COVID-19 in adults on kidney replacement therapy: A regionwide registry study. J. Am. Soc. Nephrol. 2021;32:385–396. doi: 10.1681/ASN.2020060875. - DOI - PMC - PubMed

LinkOut - more resources