. 2022 Mar 12;10(3):660.
doi: 10.3390/biomedicines10030660.

Extracellular Vesicles Derived from Acidified Metastatic Melanoma Cells Stimulate Growth, Migration, and Stemness of Normal Keratinocytes

Affiliations

Extracellular Vesicles Derived from Acidified Metastatic Melanoma Cells Stimulate Growth, Migration, and Stemness of Normal Keratinocytes

Maxim L Bychkov et al. Biomedicines. .

Abstract

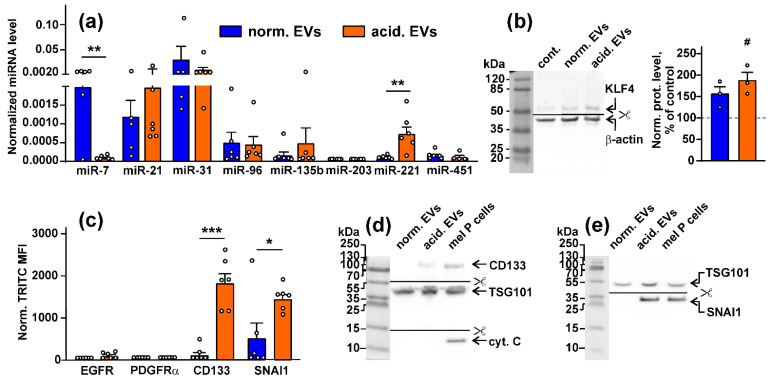
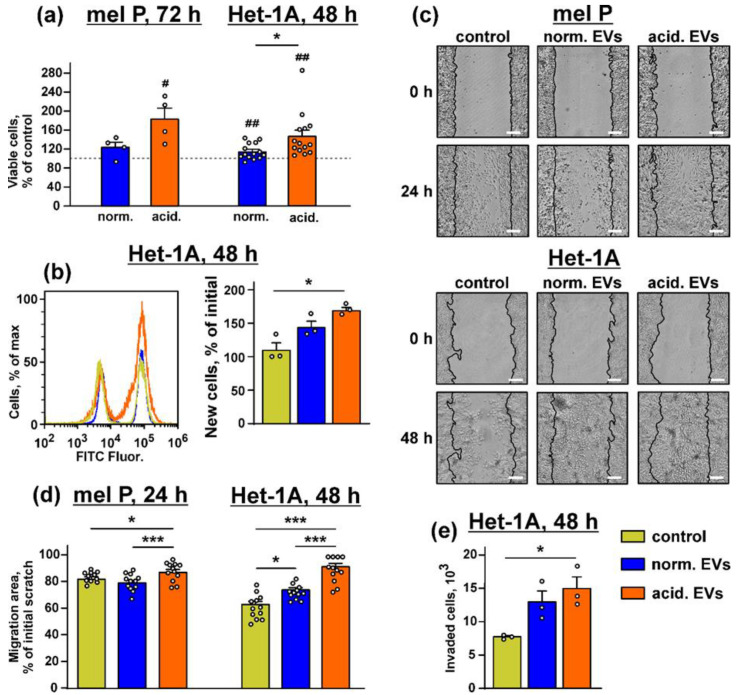
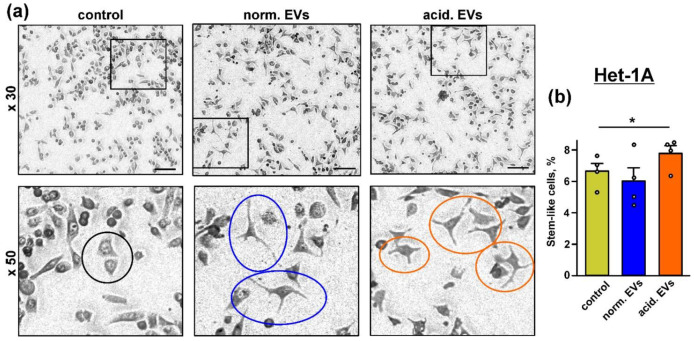
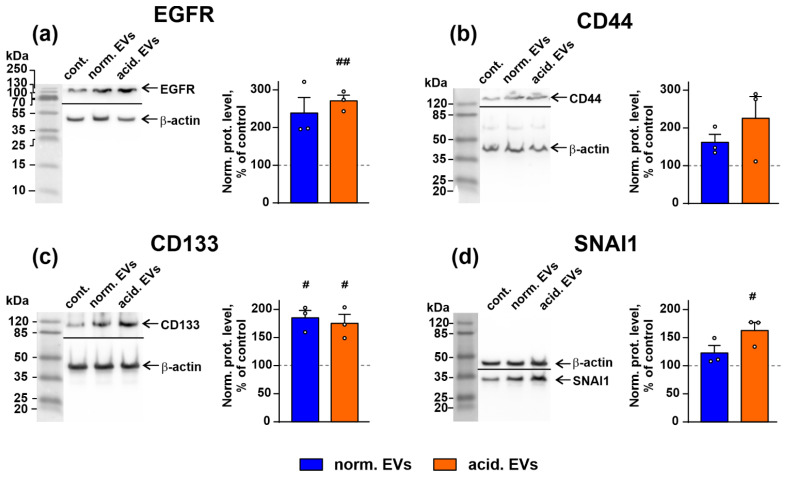
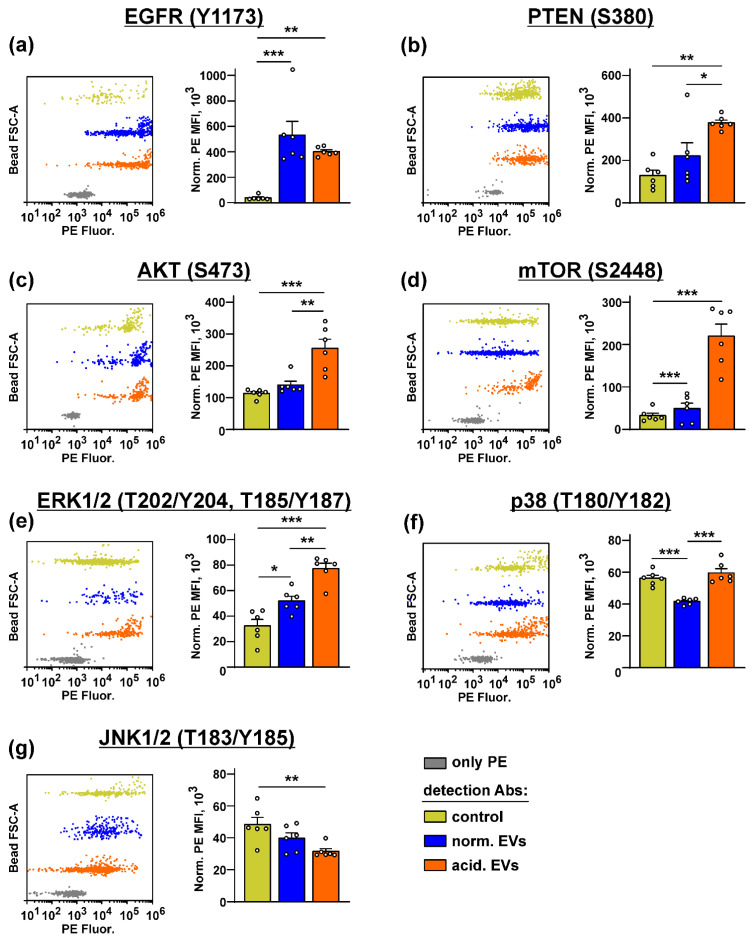
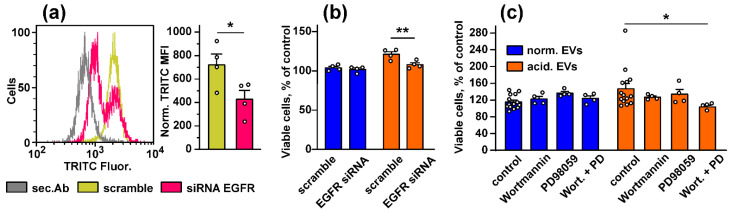
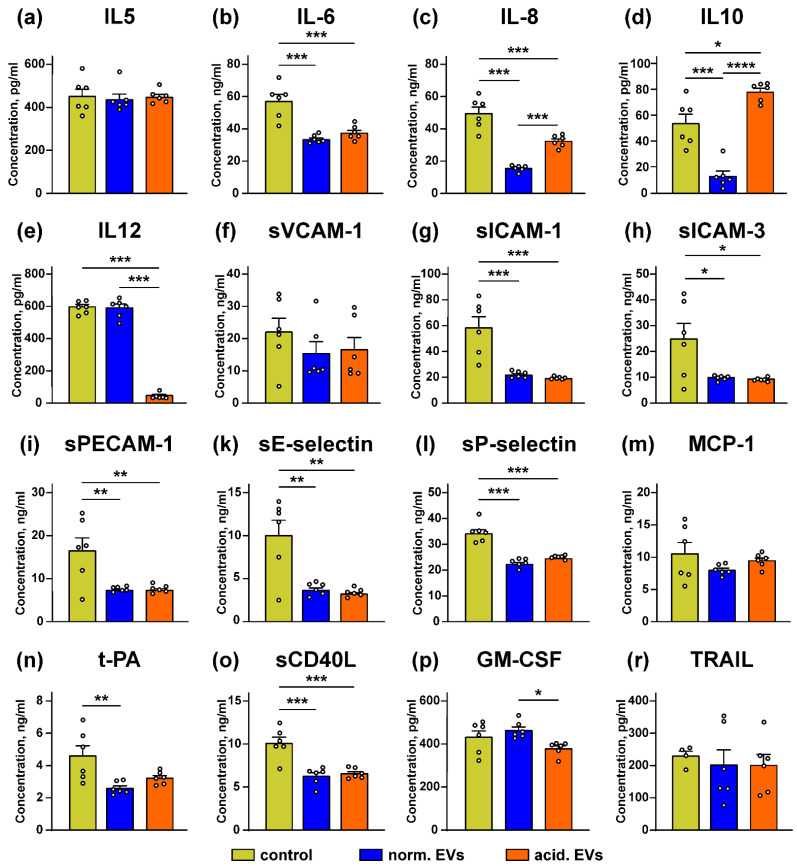
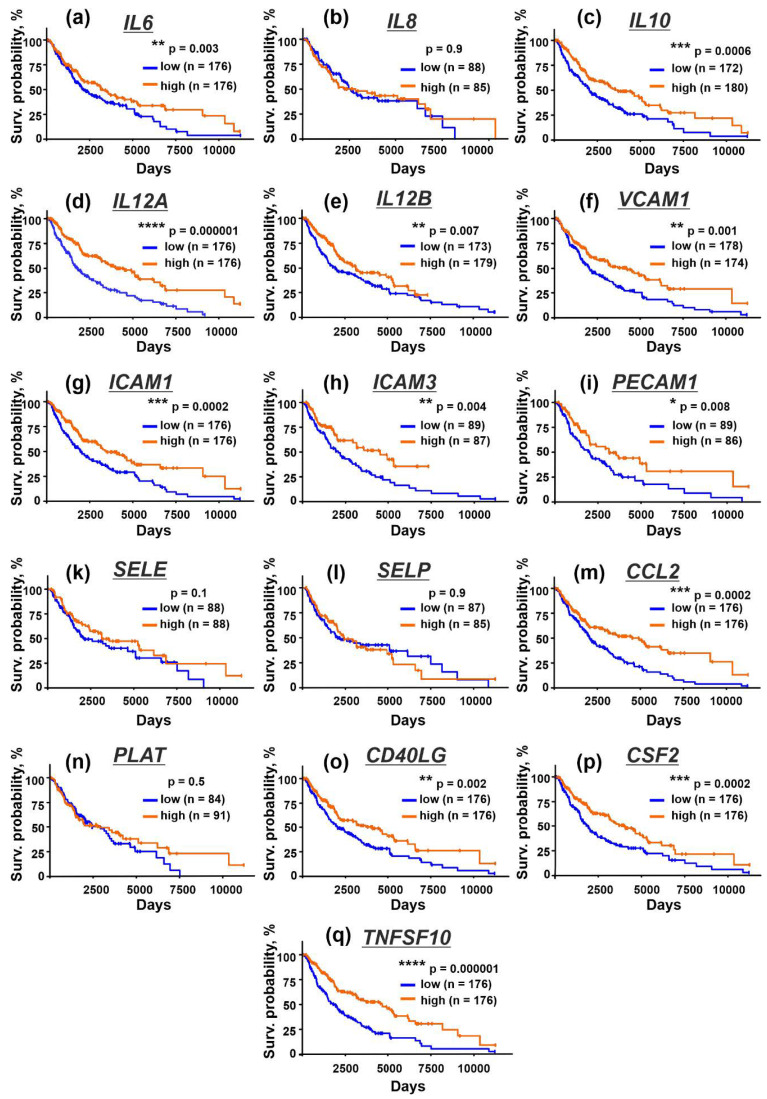
Metastatic melanoma is a highly malignant tumor. Melanoma cells release extracellular vesicles (EVs), which contribute to the growth, metastasis, and malignancy of neighboring cells by transfer of tumor-promoting miRNAs, mRNA, and proteins. Melanoma microenvironment acidification promotes tumor progression and determines EVs' properties. We studied the influence of EVs derived from metastatic melanoma cells cultivated at acidic (6.5) and normal (7.4) pH on the morphology and homeostasis of normal keratinocytes. Acidification of metastatic melanoma environment made EVs more prooncogenic with increased expression of prooncogenic mi221 RNA, stemless factor CD133, and pro-migration factor SNAI1, as well as with downregulated antitumor mir7 RNA. Incubation with EVs stimulated growth and migration both of metastatic melanoma cells and keratinocytes and changed the morphology of keratinocytes to stem-like phenotype, which was confirmed by increased expression of the stemness factors KLF and CD133. Activation of the AKT/mTOR and ERK signaling pathways and increased expression of epidermal growth factor receptor EGFR and SNAI1 were detected in keratinocytes upon incubation with EVs. Moreover, EVs reduced the production of different cytokines (IL6, IL10, and IL12) and adhesion factors (sICAM-1, sICAM-3, sPecam-1, and sCD40L) usually secreted by keratinocytes to control melanoma progression. Bioinformatic analysis revealed the correlation between decreased expression of these secreted factors and worse survival prognosis for patients with metastatic melanoma. Altogether, our data mean that metastatic melanoma EVs are important players in the transformation of normal keratinocytes.

Keywords: SNAI; adhesion factors; cancer; cytokines; extracellular vesicles; mRNA; melanoma; metastasis; miRNA; migration.


Conflict of interest statement

The authors declare no conflict of interest.

Figures

Figure 1
Figure 1
Analysis of the composition of EVs derived from the mel P cells cultivated at pH 6.5 (“acidified”) and pH 7.4 (“normal”): (a) expression of different miRNA in “normal” and “acidified” EVs was assayed by real-time PCR with stem-loop primers and normalized to the U6 non-coding RNA. Data presented as the relative miRNA level ± SEM (n = 6). ** (p < 0.01) indicates significant difference between the data groups according to the two-tailed t-test; (b) influence of “normal” and “acidified” EVs on expression of KLF4 (miR-7 target) in the Het-1A keratinocytes. Representative Western blot image of KLF4 stained by the specific antibodies in the keratinocytes and the normalized KLF expression level are shown on the left and right panels, respectively. Data presented as a ratio of the KLF expression to the β-actin expression, normalized to the same in the untreated cells ± SEM (n = 3). # (p < 0.05) indicates significant difference between the treated and untreated cells (control, shown by dashed line) according to the one-sample t-test. Whole Western blotting membranes are presented in Figure S9; (c) analysis of the EGFR, PDGFRα, CD133, and SNAI1 expression in “normal” and “acidified” EVs by flow cytometry. Data presented as normalized MFI ± SEM (n = 6). * (p < 0.05) and *** (p < 0.001) indicate significant differences between the data groups by the two-tailed t-test; (d,e) analysis of the CD133, SNAI1, TSG101, and cytochrome C expression in EVs by Western blotting. Whole Western blotting membranes are presented in Figure S9.
Figure 2
Figure 2
Effect of “normal” and “acidified” EVs on growth and migration of the mel P cells and keratinocytes. (a) Influence of “normal” and “acidified” EVs on viability of the mel P and Het-1A cells upon 72 h and 48 h incubation, respectively. Cell viability was assayed by the WST-1 test. Data were normalized to the viability of the untreated cells (control, shown by dashed lines). Data are % of the untreated cells ± SEM (n = 4–14), # (p < 0.05) and ## (p < 0.05) indicate significant difference from the untreated cells by the one-sample t-test, and * (p < 0.05) indicates significant difference between the data groups by the two-tailed t-test; (b) analysis of proliferation of the Het-1A cells by the BrdU assay. Data are % of newly divided cells, and * (p < 0.05) indicates significant difference between the data groups by the one-way ANOVA followed by Tukey’s post hoc test; (c) representative pictures of the scratch test for the mel P and Het-1A cells upon the incubation with “normal” and “acidified” EVs for 24 h and 48 h, respectively; (d) scratch square occupied by the migrating mel P and Het-1A cells. Data are presented as % of the scratch surface, occupied by the migrating cells ± SEM (n = 12), * (p < 0.05) and *** (p < 0.001) indicate significant difference between the data groups by the one-way ANOVA followed by Tukey’s post hoc test; (e) analysis of invasion of the Het-1A cells through the 8 µm pore chamber. Data presented as the number of cells invaded through the membrane ± SEM (n = 3). * p < 0.05 indicates significant difference between the data groups by the one-way ANOVA followed by Tukey’s post hoc test.
Figure 3
Figure 3
Influence of “normal” and “acidified” EVs on the keratinocytes morphology: (a) representative pictures showing the examples of the normal morphology in the untreated Het-1A keratinocytes (black circle) and the “stem”-like morphology in the keratinocytes upon the incubation with “normal” (blue circles) and “acidified” (red circles) EVs. Scale bar 50 µm; (b) number of the keratinocytes with the “stem”-like morphology in the untreated cells (control) and after the 48 h incubation with “normal” and “acidified” EVs. Data presented as % of the cells with the “stem”-like morphology ± SEM (n = 4); * (p < 0.05) indicates significant difference between the data groups by the one-way ANOVA followed by Tukey’s post hoc test.
Figure 4
Figure 4
Influence of “normal” and “acidified” EVs on the expression of EGFR (a), CD44 (b), CD133 (c), and SNAI1 (d) in the keratinocytes. Representative Western blot images of EGFR, CD133, CD44, and SNAI1 stained by the specific antibodies in the keratinocytes and the normalized expression levels of the corresponding proteins are shown on the left and right panels, respectively. Data presented as the ratio of the expression level of the target protein to the level of β-actin, normalized to the untreated cells ± SEM (n = 3). # (p < 0.05) and ## (p < 0.01) indicate significant differences between the treated and untreated cells (control, shown by dashed lines) according to the one-sample t-test. Whole Western blotting membranes are presented in Figure S13.
Figure 5
Figure 5
Influence of “normal” and “acidified” EVs on the activity of the different intracellular signaling pathways in the keratinocytes. Het1-A cells were incubated with “normal” and “acidified” EVs for 48 h, and the phosphorylation of EGFR (Y1173) (a), PTEN (S380) (b), AKT (S473) (c), mTOR (S2448) (d), ERK1/2 (T202/Y204, T185/Y187) (e), p38 MAP kinase (T180/Y182) (f), and JNK1/2 (T183/Y185) (g) was assayed by the Bio-Plex magnetic beads assay. Representative distributions of the magnetic beads incubated with the lysates of the untreated (control) or treated by EVs’ keratinocytes and the beads stained only by PE are shown on the left panels (every bead probe was analyzed separately and combined on the one panel for illustration). Data on the analysis of the phosphorylation level of the messengers are shown on the right panels. Data were acquired by the Attune NxT flow cytometer and presented as normalized MFI ± SEM (n = 6). * (p < 0.05), ** (p < 0.01), and *** (p < 0.001) indicate significant difference between the data groups by the one-way ANOVA followed by Tukey’s post hoc test.
Figure 6
Figure 6
Influence of the EGFR knock-down and inhibition of the PI3K/AKT/mTOR and MEK/ERK pathways on stimulated growth of the keratinocytes induced by EVs. (a) Analysis of the EGFR knock-down in the keratinocytes. The representative cell distribution histograms after transfection of the keratinocytes by scramble siRNA and EGFR-specific siRNA and quantification of the EGFR expression are shown on the left and right panels, respectively. Data presented as normalized MFI ± SEM (n = 4). * (p < 0.05) indicates significant difference between the data groups by the two-tailed t-test; (b) influence of the EGFR knock-down on viability of the keratinocytes stimulated by “normal” and “acidified” EVs. Data are % of the untreated cells ± SEM (n = 4–14), ** (p < 0.01) indicates significant difference between the data groups by the two-tailed t-test; (c) influence of the inhibitors of the PI3K/AKT/mTOR and MEK/ERK pathways (Wortmannin and PD98059, respectively) on the effects of “normal” and “acidified” EVs on viability of the keratinocytes. Control is the cells treated by only EVs (without the inhibitors). Data are % of the untreated cells ± SEM (n = 4–14); * (p < 0.05) indicates the significant difference between the data groups by the one-way ANOVA followed by Dunnet’s post hoc test.
Figure 7
Figure 7
Effect of “normal” and “acidified” EVs on secretion of the different cytokines and adhesion factors by the keratinocytes. Het1-A cells were incubated with “normal” and “acidified” EVs for 48 h, and the concentration of IL5 (a), IL10 (d), IL12 (e), GM-CSF (p), and TRAIL (r) was assayed by ELISA. Concentration of IL6 (b), IL8 (c), sVCAM-1 (f), sICAM-1 (g), sICAM-3 (h), sPECAM-1 (i), sE-selectin (k), sP-selectin (l), MCP-1 (m), t-PA (n), and sCD40L (o) was analyzed by the Flow Cytomix kits. Data presented as the normalized protein concentration ± SEM (n = 6). Control corresponds to the untreated cells. * (p < 0.05), ** (p < 0.01), *** (p < 0.001), and **** (p < 0.0001) indicate significant difference between the data groups by the one-way ANOVA followed by Tukey’s post hoc test.
Figure 8
Figure 8
Kaplan–Meier analysis of the correlation between the survival of the patients with metastatic melanoma and the different expression of the genes coding IL6 (a), IL8/CXCL8 (b), IL10 (c), IL12A (d), IL12B (e), VCAM1 (f), ICAM1 (g), ICAM3 (h), PECAM1 (i), SELE (k), SELP (l), CCL2 (m), PLAT (n), CD40LG (o), CSF2 (p), and TNSF10 (q). * (p <0.05), ** (p < 0.01), *** (p < 0.001), and **** (p < 0.0001) indicate significant difference between the overall survival prognosis for the patients with the high (above median) and low (below median) gene expression according to the log-rank test.

Similar articles

Cited by

References

    1. Falcone I., Conciatori F., Bazzichetto C., Ferretti G., Cognetti F., Ciuffreda L., Milella M. Tumor Microenvironment: Implications in Melanoma Resistance to Targeted Therapy and Immunotherapy. Cancers. 2020;12:2870. doi: 10.3390/cancers12102870. - DOI - PMC - PubMed
    1. Dratkiewicz E., Simiczyjew A., Mazurkiewicz J., Ziętek M., Matkowski R., Nowak D. Hypoxia and Extracellular Acidification as Drivers of Melanoma Progression and Drug Resistance. Cells. 2021;10:862. doi: 10.3390/cells10040862. - DOI - PMC - PubMed
    1. Cho J.H., Robinson J.P., Arave R.A., Burnett W.J., Kircher D.A., Chen G., Davies M.A., Grossmann A.H., VanBrocklin M.W., McMahon M., et al. AKT1 Activation Promotes Development of Melanoma Metastases. Cell Rep. 2015;13:898–905. doi: 10.1016/j.celrep.2015.09.057. - DOI - PMC - PubMed
    1. Tucci M., Mannavola F., Passarelli A., Stucci L.S., Cives M., Silvestris F. Exosomes in Melanoma: A Role in Tumor Progression, Metastasis and Impaired Immune System Activity. Oncotarget. 2018;9:20826–20837. doi: 10.18632/oncotarget.24846. - DOI - PMC - PubMed
    1. Chang W.-H., Cerione R.A., Antonyak M.A. Extracellular Vesicles and Their Roles in Cancer Progression. Methods Mol. Biol. 2021;2174:143–170. doi: 10.1007/978-1-0716-0759-6_10. - DOI - PMC - PubMed