. 2022 Mar 17;10(3):699.
doi: 10.3390/biomedicines10030699.

Clinical Interest of Serum Alpha-2 Macroglobulin, Apolipoprotein A1, and Haptoglobin in Patients with Non-Alcoholic Fatty Liver Disease, with and without Type 2 Diabetes, before or during COVID-19

Affiliations

Clinical Interest of Serum Alpha-2 Macroglobulin, Apolipoprotein A1, and Haptoglobin in Patients with Non-Alcoholic Fatty Liver Disease, with and without Type 2 Diabetes, before or during COVID-19

Olivier Deckmyn et al. Biomedicines. .

Abstract

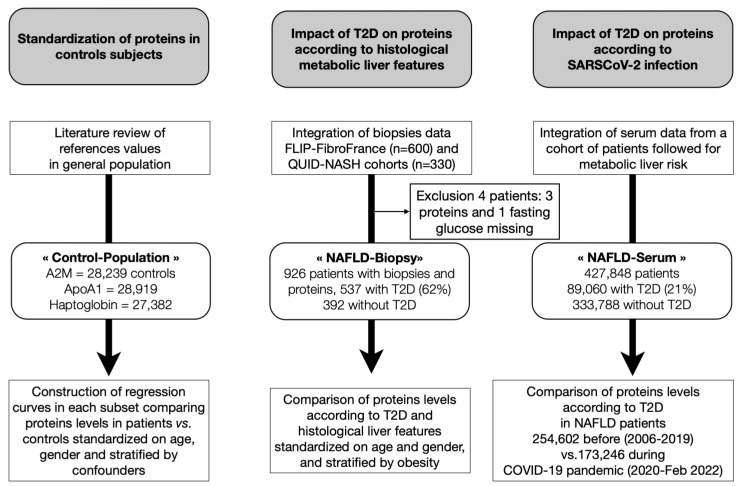
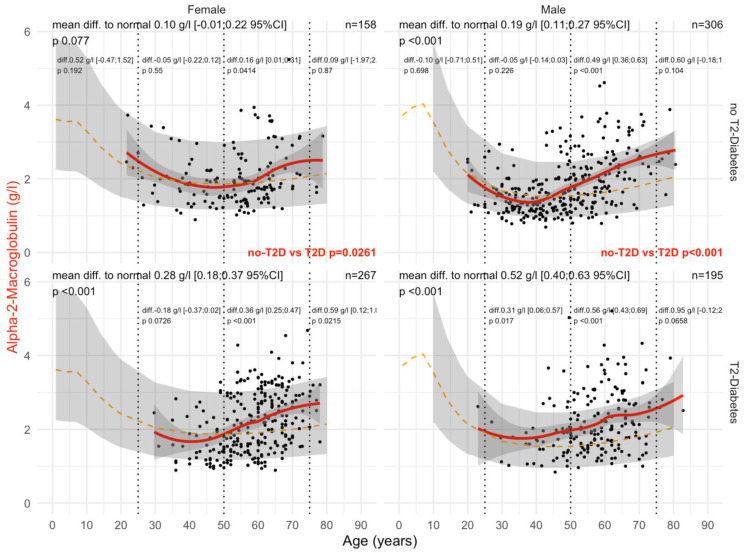
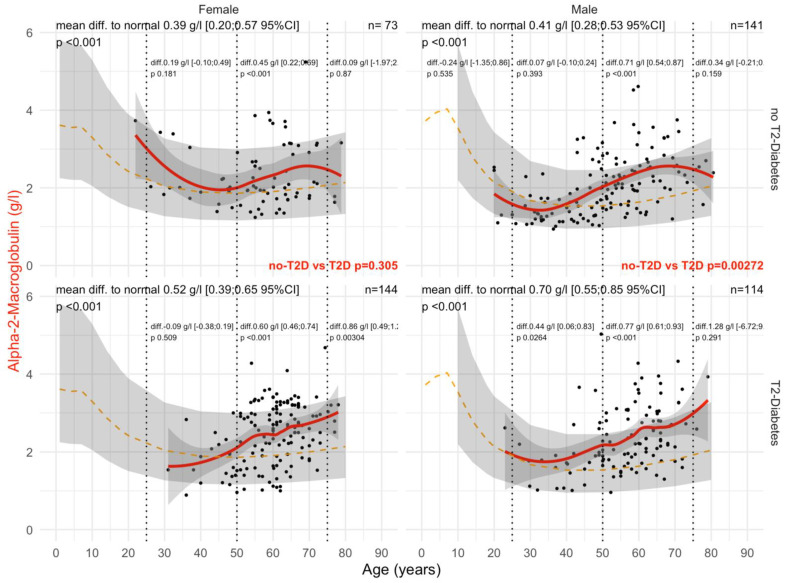
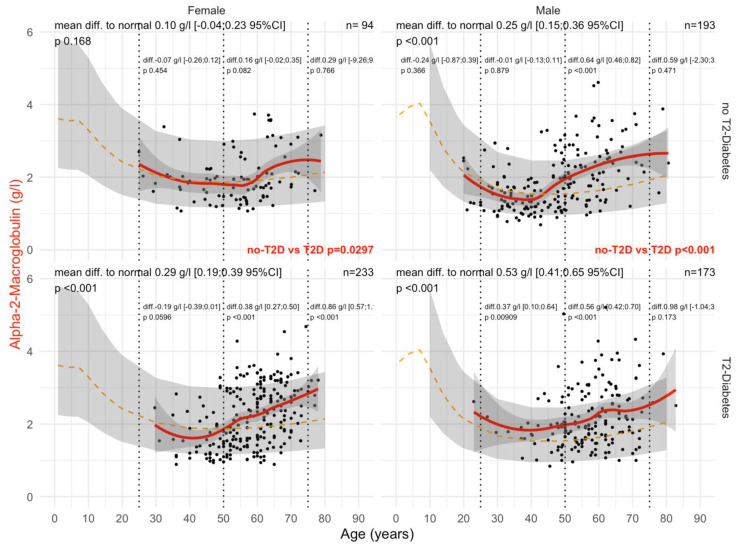
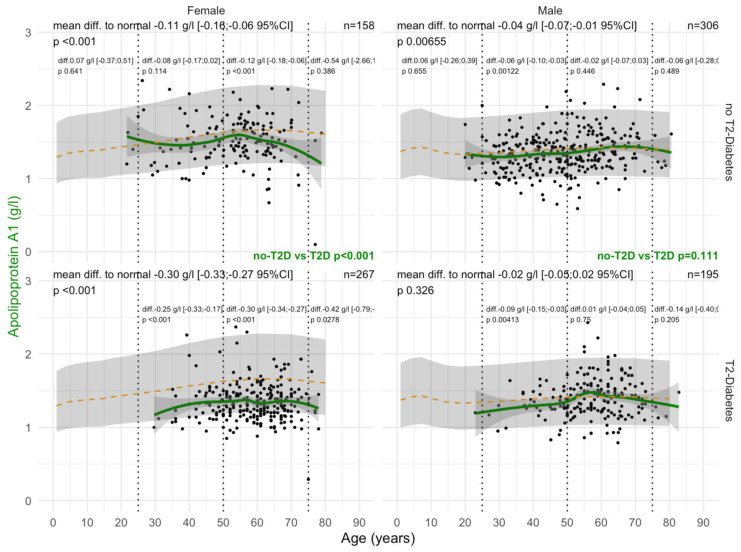
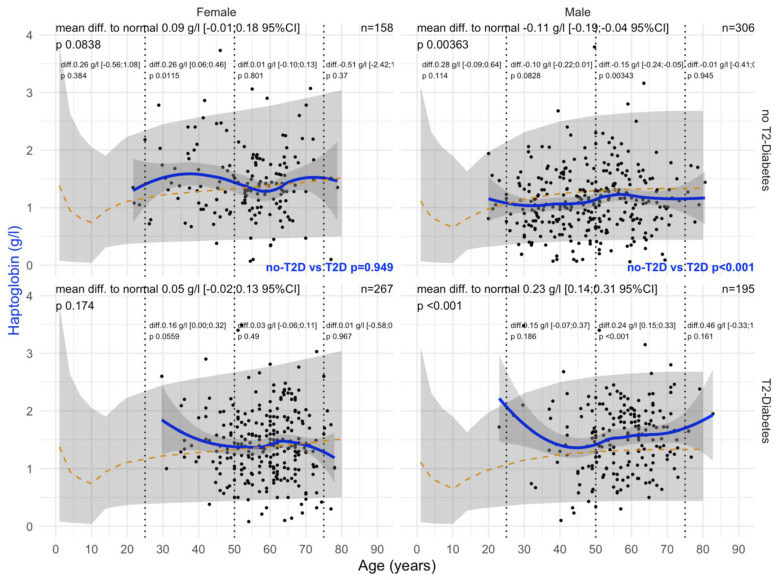
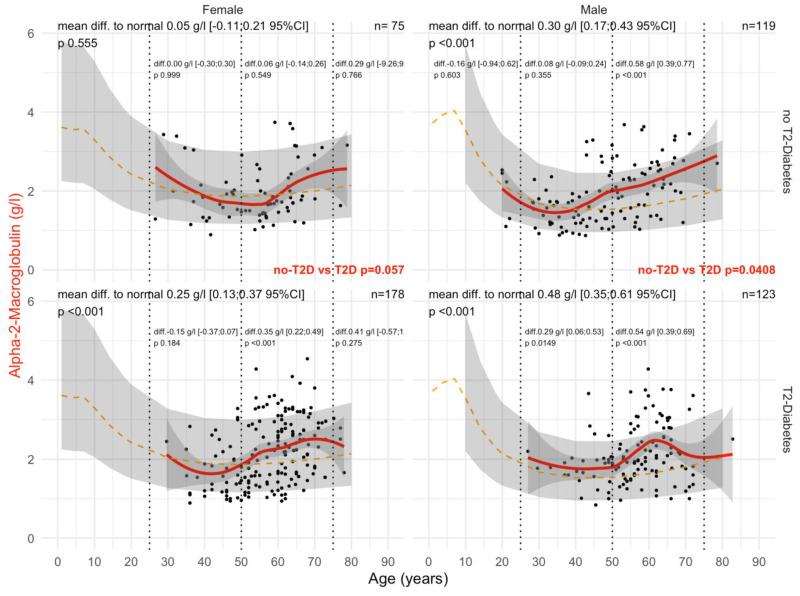
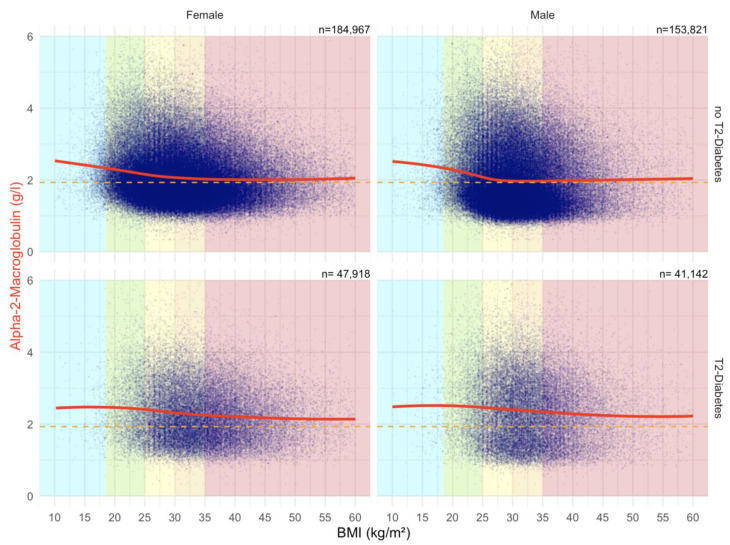
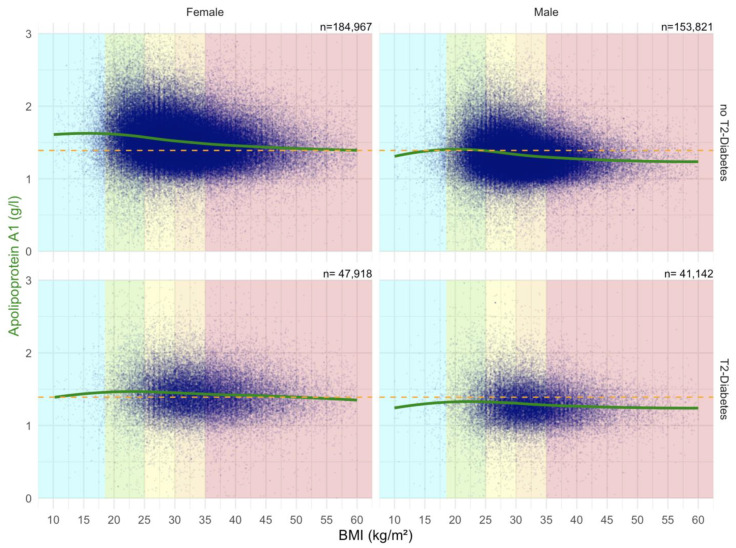
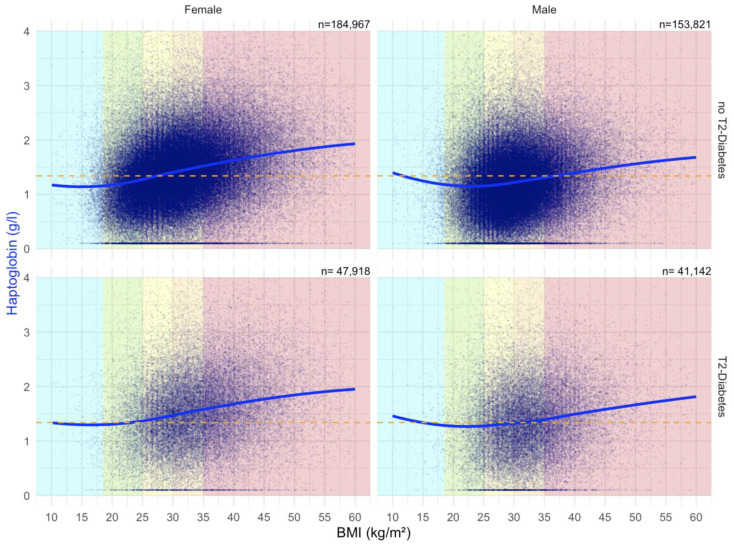
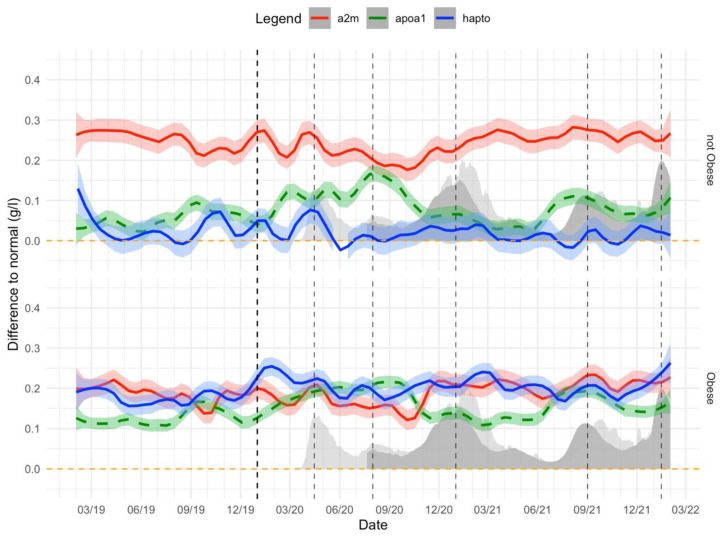
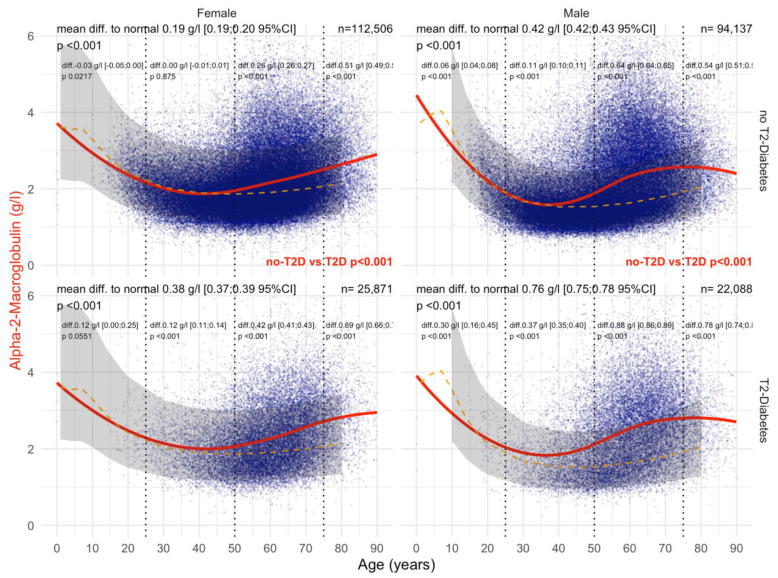
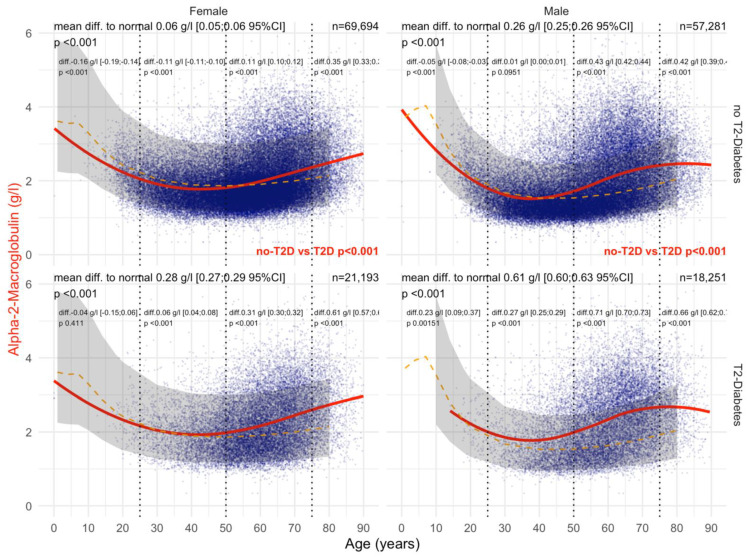
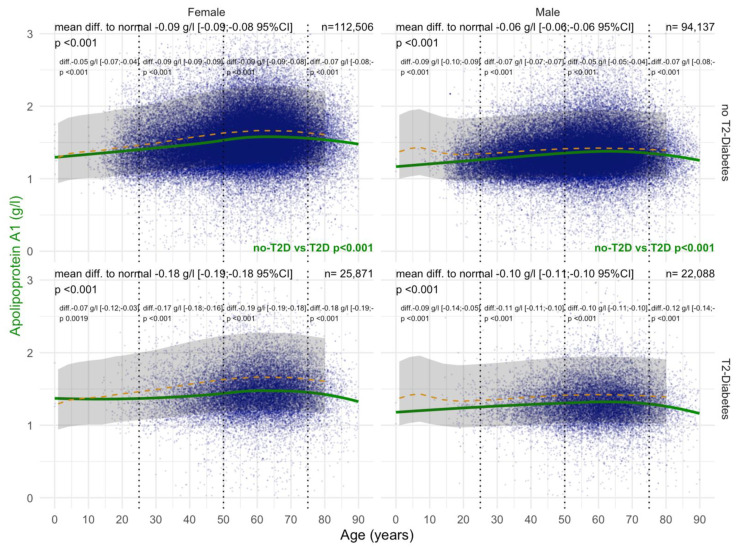
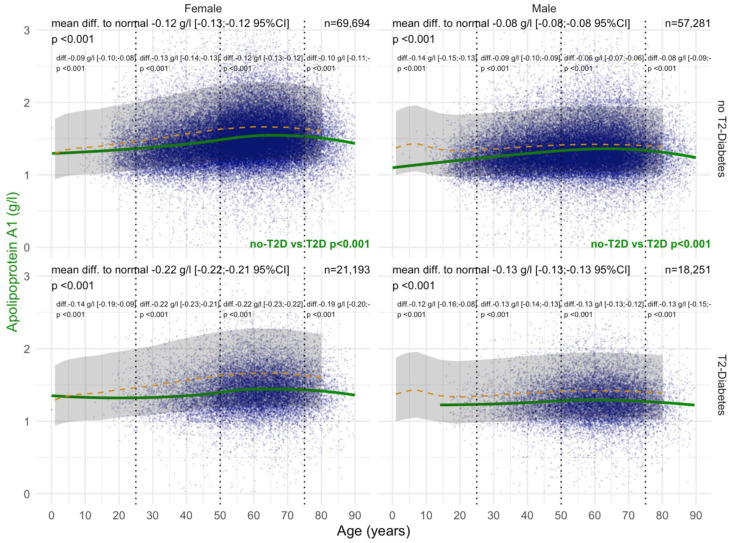
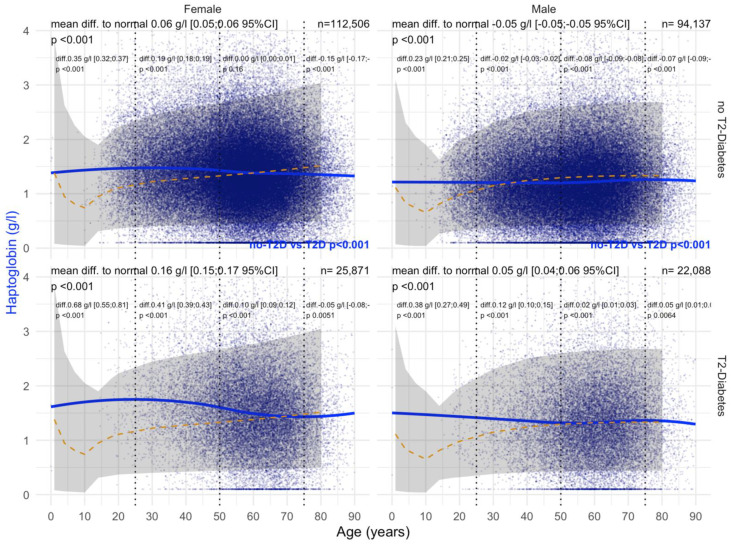
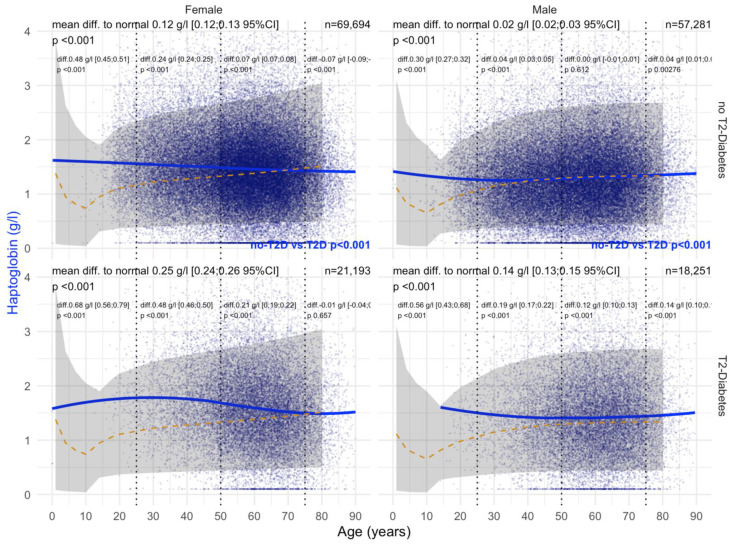
In patients with non-alcoholic fatty liver disease (NAFLD) with or without type 2 diabetes mellitus (T2DM), alpha-2 macroglobulin (A2M), apolipoprotein A1 (ApoA1), and haptoglobin are associated with the risk of liver fibrosis, inflammation (NASH), and COVID-19. We assessed if these associations were worsened by T2DM after adjustment by age, sex, obesity, and COVID-19. Three datasets were used: the “Control Population”, which enabled standardization of protein serum levels according to age and sex (N = 27,382); the “NAFLD-Biopsy” cohort for associations with liver features (N = 926); and the USA “NAFLD-Serum” cohort for protein kinetics before and during COVID-19 (N = 421,021). The impact of T2DM was assessed by comparing regression curves adjusted by age, sex, and obesity for the liver features in “NAFLD-Biopsy”, and before and during COVID-19 pandemic peaks in “NAFLD-Serum”. Patients with NAFLD without T2DM, compared with the values of controls, had increased A2M, decreased ApoA1, and increased haptoglobin serum levels. In patients with both NAFLD and T2DM, these significant mean differences were magnified, and even more during the COVID-19 pandemic in comparison with the year 2019 (all p < 0.001), with a maximum ApoA1 decrease of 0.21 g/L in women, and a maximum haptoglobin increase of 0.17 g/L in men. In conclusion, T2DM is associated with abnormal levels of A2M, ApoA1, and haptoglobin independently of NAFLD, age, sex, obesity, and COVID-19.

Keywords: COVID-19; SAF-scoring system; alpha-2 macroglobulin; apolipoprotein A1; haptoglobin; liver fibrosis; non-alcoholic fatty liver disease NAFLD; non-alcoholic steatohepatitis NASH; steatosis; type 2 diabetes.


Conflict of interest statement

TP is the inventor of FibroTest (FibroSure in USA) and NASH-FibroTest, and the co-founder of BioPredictive. The patents belong to French public organizations Assistance Publique Hôpitaux de Paris and Sorbonne University. OD is cofounder BioPredictive. OD and VP are full employee of BioPredictive. The other coauthors declare no conflict of interest.

Figures

Figure 1
Figure 1
Study design.
Figure 2
Figure 2
A2M levels in all “NAFLD-Biopsy” patients. Impact of T2DM on A2M concentration in all “NAFLD-Biopsy” patients (n = 926). Normal serum mean values according to age and sex (dashed–orange lines), with 95% confidence intervals (light-gray ribbon). Three vertical dotted lines mark the four age groups (before 25 years, between 25 and 50 years, between 50 and 75 years, and above 75 years old). Each point is a patient’s protein value. The red curve is a Loess regression of the median A2M value, along with its 95% confidence interval (darker gray). For each age group, the mean difference (%95CI) between the patient protein value and the expected normal value (for age and sex) with its significant p-value is displayed at the top of the figure. The significance between the non-T2DM and T2DM patients is displayed in red between the two panels.
Figure 3
Figure 3
A2M levels in “NAFLD-Biopsy” patients with significant fibrosis stages F2F3F4. Impact of T2DM on A2M concentration in NAFLD-biopsied patients with clinically significant fibrosis F2F3F4 (n = 472). Normal serum means values according to age and sex (dashed–orange lines), with 95% confidence intervals (light-gray ribbon). Three vertical–dotted lines mark the four age groups (before 25, between 25 and 50, between 50 and 75, and above 75 years old). Each point is a patient’s protein value. The red curve is a Loess regression of the median A2M values, along with its 95% confidence interval (darker gray). For each age group, the mean difference (%95CI) between the patient protein value and the expected normal value (for age and sex) with its significance p-value is displayed at the top of the figure. The significance between the non-T2DM and T2DM patients is displayed in red between the 2 panels.
Figure 4
Figure 4
A2M levels in “NAFLD-Biopsy” patients with significant steatosis stages S2S3. Impact of T2DM on A2M concentration in NAFD-biopsied patients with significant steatosis S2S3 (n = 693). Normal serum means values according to age and sex (dashed–orange lines), with 95% confidence intervals (light-gray ribbon). Three vertical–dotted lines mark the four age groups (before 25, between 25 and 50, between 50 and 75, and above 75 years old). Each point is a patient’s protein value. The red curve is a Loess regression of the median of A2M values, along with its 95% confidence interval (darker gray). For each age group, the mean difference (%95CI) between patient protein value and the expected normal value (for age and sex) with its significance p-value is displayed at the top of the figure. The significance between the non-T2DM and T2DM patients is displayed in red between the 2 panels.
Figure 5
Figure 5
ApoA1 levels in all “NAFLD-Biopsy” patients. Impact of T2DM on ApoA1 concentration in all NAFD-biopsied patients (n = 926). Normal serum means according to age and sex (dashed–orange lines), with 95% confidence intervals (light-gray ribbon). Three vertical–dotted lines mark the four age groups (before 25, between 25 and 50, between 50 and 75, and above 75 years old). Each point is a patient’s protein value. The green curve is a Loess regression of the median of ApoA1 values, along with its 95% confidence interval (darker gray). For each age group, the mean difference (%95CI) between the patient protein value and the expected normal value (for age and sex) with its significance p–value is displayed at the top of the figure. The significance between the non-T2DM and T2DM patients is displayed in green between the 2 panels.
Figure 6
Figure 6
Haptoglobin levels in all “NAFD-Biopsy” patients. Impact of T2DM on Hapto concentration in all NAFD-biopsied patients (n = 926). Normal serum means values according to age and sex (dashed–orange lines), with 95% confidence intervals (light-gray ribbon). Three vertical–dotted lines mark the four age groups (before 25, between 25 and 50, between 50 and 75, and above 75 years old). Each point is a patient’s protein value. The green curve is a Loess regression of the median of Hapto values, along with its 95% confidence interval (darker gray). For each age group, the mean difference (%95CI) between the patient protein value and the expected normal value (for age and sex) with its significance p-value is displayed at the top of the figure. The significance between the non-T2DM and T2DM patients is displayed in blue between the 2 panels.
Figure 7
Figure 7
A2M levels in “NAFLD-Biopsy” patients with obesity. Impact of T2DM on A2M concentration in NAFD-biopsied patients according to obesity (n = 495). Normal serum means values according to age and sex (dashed–orange lines), with 95% confidence intervals (light-gray ribbon). Three vertical–dotted lines mark the four age groups (before 25, between 25 and 50, between 50 and 75, and above 75 years old). Each point is a patient’s protein value. The red curve is a Loess regression of the median of A2M values, along with its 95% confidence interval (darker gray). For each age group, the mean difference (%95CI) between the patient protein value and the expected normal value (for age and sex) with its significance p-value is displayed at the top of the figure. The significance between the non-T2DM and T2DM patients is displayed in red between the 2 panels.
Figure 8
Figure 8
Impact of BMI on the A2M concentrations in “NAFD–Serum” cohort. Median value is the horizontal orange–dashed line. Five vertical zones mark the 5 BMI groups (WHO definition cut-offs: 18.5, 25, 30, 35 and above 40 kg/m2). Each blue point is a protein patient value with its BMI. The red curve is a Loess regression of the median of A2M values.
Figure 9
Figure 9
Impact of BMI on the ApoA1 concentrations in “NAFD–Serum” cohort. Median value is the horizontal orange–dashed line. Five vertical zones mark the 5 BMI groups (WHO definition cut-offs: 18.5, 25, 30, 35 and above 40 kg/m2). Each blue point is a protein patient value with its BMI. The green curve is a Loess regression of the median of ApoA1 values.
Figure 10
Figure 10
Impact of BMI on the Haptoglobin concentrations in “NAFD–Serum” cohort. Median value is the horizontal orange–dashed line. Five vertical zones mark the 5 BMI groups (WHO definition cut-offs: 18.5, 25, 30, 35 and above 40 kg/m2). Each blue point is a protein patient value with its BMI. The blue curve is a Loess regression of the median of Haptoglobin values.
Figure 11
Figure 11
A2M, ApoA1, and haptoglobin levels before and during the COVID-19 pandemic. Impact of COVID-19 waves on A2M, ApoA1 and haptoglobin level differences with normal values before and during COVID-19 pandemic in obese and non-obese “NAFLD-Serum” subjects followed for metabolic liver risk (n = 135,911). X-axis is time, between January 2019 and February 2022. Dashed–vertical black lines show the different COVID-19 waves. In light gray and dark gray are the standardized COVID-19-related death and hospitalization rates, respectively, in the USA. The red line, blue line, and dashed–green line are the 7-day rolling mean difference and %95CI between the observed A2M, haptoglobin, and negative Apoa1 concentration, respectively, and the expected normal values for these subjects adjusted by their age and gender.
Figure 12
Figure 12
A2M levels before the COVID-19 pandemic. Impact of T2DM on A2M concentration before SARS-CoV-2 pandemic in “NAFLD-Serum” patients followed for metabolic liver risk (n = 254,602). Normal serum mean values according to age and sex (dashed–orange lines), with 95% confidence intervals (gray ribbon). Three vertical–dotted lines mark the four age groups (before 25, between 25 and 50, between 50 and 75, and above 75 years old). The red curve is a Loess regression of the median of A2M values. For each age group, the mean difference (%95CI) between the patient protein value and the expected normal value (for age and sex) with its significance p-value is displayed at the top of the figure. The significance between the non-T2DM and T2DM patients is displayed in red between the 2 panels.
Figure 13
Figure 13
A2M levels during the COVID-19 pandemic. Impact of T2DM on A2M concentration during SARS-CoV-2 pandemic in “NAFLD-Serum” patients followed for metabolic liver risk (n = 173,246). Normal serum means values according to age and sex (dashed–orange lines), with 95% confidence intervals (gray ribbon). Three vertical–dotted lines mark the four age groups (before 25, between 25 and 50, between 50 and 75, and above 75 years old). The red curve is a Loess regression of the median of A2M values. For each age group, the mean difference (%95CI) between the patient protein value and the expected normal (for age and sex) with its significance p-value is displayed at the top of the figure. The significance between the non-T2DM and T2DM patients is displayed in red between the 2 panels.
Figure 14
Figure 14
ApoA1 levels before the COVID-19 pandemic. Impact of T2DM on ApoA1 concentration before SARS-CoV-2 pandemic in “NAFLD-Serum” patients followed for metabolic liver risk (n = 254,602). Normal serum means values according to age and sex (dashed–orange lines), with 95% confidence intervals (gray ribbon). Three vertical–dotted lines mark the four age groups (before 25, between 25 and 50, between 50 and 75 and above 75 years old). The green curve is a Loess regression of the median of ApoA1 values. For each age group, the mean difference (%95CI) between the patient protein value and the expected normal value (for age and sex) with its significance p-value is displayed at the top of the figure. The significance between the non-T2DM and T2DM patients is displayed in green between the 2 panels.
Figure 15
Figure 15
ApoA1 levels during the COVID-19 pandemic. Impact of T2DM on ApoA1 concentration during SARS-CoV-2 pandemic in “NAFLD-Serum” patients followed for metabolic liver risk (n = 173,246). Normal serum means values according to age and sex (dashed–orange lines), with 95% confidence intervals (gray ribbon). Three vertical–dotted lines mark the four age groups (before 25, between 25 and 50, between 50 and 75, and above 75 years old). The green curve is a Loess regression of the median of ApoA1 values. For each age group, the mean difference (%95CI) between the patient protein value and the expected normal value (for age and sex) with its significance p-value is displayed on top of figure. The significance between the non-T2DM and T2DM patients is displayed in green between the 2 panels.
Figure 16
Figure 16
Haptoglobin levels before the COVID-19 pandemic. Impact of T2DM on Hapto concentration before SARS-CoV-2 pandemic in “NAFLD-Serum” patients followed for metabolic liver risk (n = 254,602). Normal serum means values according to age and sex (dashed–orange lines), with 95% confidence intervals (gray ribbon). Three vertical–dotted lines mark the four age groups (before 25, between 25 and 50, between 50 and 75, and above 75 years old). The blue curve is a Loess regression of the median of Hapto values. For each age group, the mean difference (%95CI) between the patient protein value and the expected normal value (for age and sex) with its significance p-value is displayed at the top of the figure. The significance between the non-T2DM and T2DM patients is displayed in blue between the 2 panels.
Figure 17
Figure 17
Haptoglobin levels during the COVID-19 pandemic. Impact of T2DM on Hapto concentration during SARS-CoV-2 pandemic in “NAFLD-Serum” patients followed for metabolic liver risk (n = 173,246). Normal serum means values according to age and sex (dashed–orange lines), with 95% confidence intervals (gray ribbon). Three vertical–dotted lines mark the four age groups (before 25, between 25 and 50, between 50 and 75, and above 75 years old). The blue curve is a Loess regression of the median of Hapto values. For each age group, the mean difference (%95CI) between the patient protein value and the expected normal value (for age and sex) with its significance p-value is displayed at the top of the figure. The significance between the non-T2DM and T2DM patients is displayed in blue between the 2 panels.

Similar articles

Cited by

References

    1. Fremont V. Diabetes. In: Masson G., editor. Thesis French Academy of Medicine. Paris, France: 1891. p. 51.
    1. Bornstein S.R., Rubino F., Khunti K., Mingrone G., Hopkins D., Birkenfeld A.L., Boehm B., Amiel S., Holt R., Skyler J.S., et al. Practical recommendations for the management of diabetes in patients with COVID-19. Lancet Diabetes Endocrinol. 2020;8:546–550. doi: 10.1016/S2213-8587(20)30152-2. - DOI - PMC - PubMed
    1. Ramon J., Llauradó G., Güerri R., Climent E., Ballesta S., Benaiges D., López-Montesinos I., Navarro H., Fernández N., Carrera M.J., et al. Acute-to-chronic glycemic ratio as a predictor of COVID-19 severity and mortality. Diabetes Care. 2021;45:255–258. doi: 10.2337/dc21-1321. - DOI - PubMed
    1. Stefan N., Birkenfeld A.L., Schulze M.B. Global pandemics interconnected—obesity, impaired metabolic health and COVID-19. Nat. Rev. Endocrinol. 2021;17:135–149. doi: 10.1038/s41574-020-00462-1. - DOI - PubMed
    1. Wu S., Zhou K., Misra-Hebert A., Bena J., Kashyap S.R. Metabolic Syndrome and Related Disorders. Mary Ann Liebert, Inc.; New York, NY, USA: 2022. Impact of metabolic syndrome on severity of COVID-19 illness. - DOI - PubMed

LinkOut - more resources