. 2022 Feb 28;12(3):376.
doi: 10.3390/biom12030376.

In Silico Exploration of Mycobacterium tuberculosis Metabolic Networks Shows Host-Associated Convergent Fluxomic Phenotypes

Affiliations

In Silico Exploration of Mycobacterium tuberculosis Metabolic Networks Shows Host-Associated Convergent Fluxomic Phenotypes

Guillem Santamaria et al. Biomolecules. .

Abstract

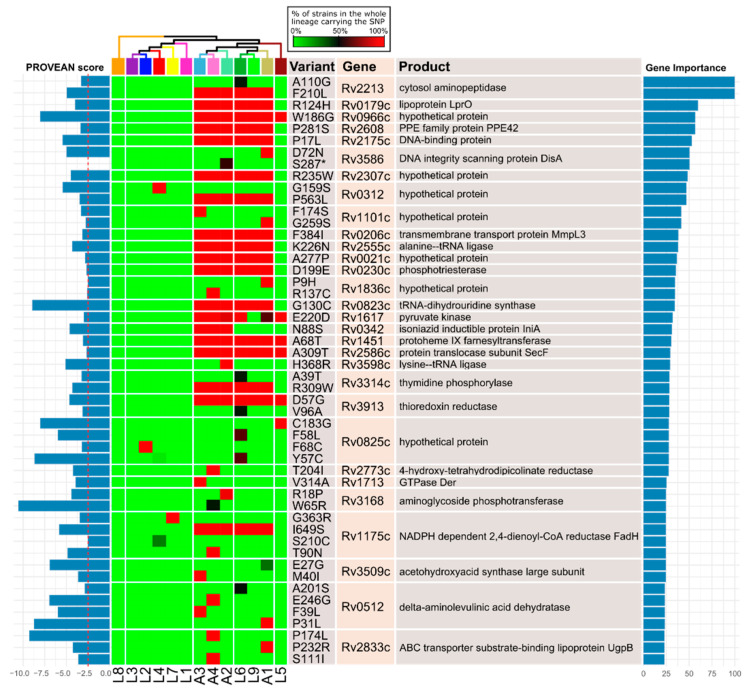
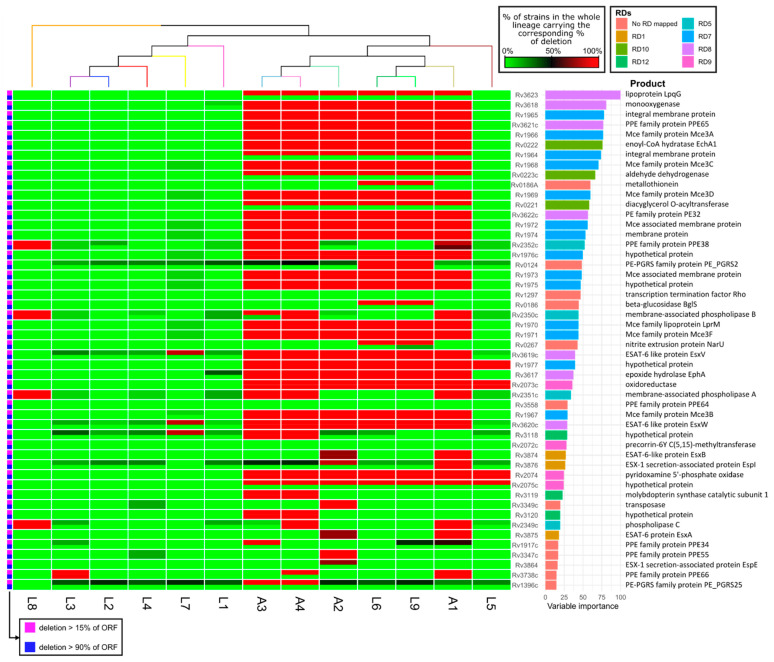
Mycobacterium tuberculosis, the causative agent of tuberculosis, is composed of several lineages characterized by a genome identity higher than 99%. Although the majority of the lineages are associated with humans, at least four lineages are adapted to other mammals, including different M. tuberculosis ecotypes. Host specificity is associated with higher virulence in its preferred host in ecotypes such as M. bovis. Deciphering what determines the preference of the host can reveal host-specific virulence patterns. However, it is not clear which genomic determinants might be influencing host specificity. In this study, we apply a combination of unsupervised and supervised classification methods on genomic data of ~27,000 M. tuberculosis clinical isolates to decipher host-specific genomic determinants. Host-specific genomic signatures are scarce beyond known lineage-specific mutations. Therefore, we integrated lineage-specific mutations into the iEK1011 2.0 genome-scale metabolic model to obtain lineage-specific versions of it. Flux distributions sampled from the solution spaces of these models can be accurately separated according to host association. This separation correlated with differences in cell wall processes, lipid, amino acid and carbon metabolic subsystems. These differences were observable when more than 95% of the samples had a specific growth rate significantly lower than the maximum achievable by the models. This suggests that these differences might manifest at low growth rate settings, such as the restrictive conditions M. tuberculosis suffers during macrophage infection.

Keywords: Mycobacterium tuberculosis; genome-scale metabolic model; host association; lineage; metabolic networks.


Conflict of interest statement

The authors declare no conflict of interest.

Figures

Figure 1
Figure 1
Principal Component Analysis of ORF deletion percentage. (A). All ORFs. (B). ORFs annotated as enzyme-coding. Each point represents a genome, which is colored according to the lineage it belongs to.
Figure 2
Figure 2
Supervised analysis of potentially deleterious SNPs. Potentially deleterious SNPs included amino acid substitutions predicted by PROVEAN to be deleterious (leftmost bar plot, score ≤ −2.5, indicated in dashed red line) and premature stop codon introducing SNPs. Top 25 genes were sorted according to their importance in the classification (rightmost bar plot). The phylogenetic relationship between the lineages is shown at the top.
Figure 3
Figure 3
Supervised analysis of the deletion data. Random forest of the percentage of each ORF from the reference genome that was lost in each lineage, classifying the genomes as belonging to animal- or human-associated lineages. The variables (genes) are sorted according to their importance in the classification (rightmost barplot), and are colored depending on the RD they are located in. RDs are named according to Brosch et al. 2002. The heatmap corresponds to the percentage of isolates with a percentage of deletion higher of the 15% or 90% (magenta or blue, respectively, indicated in leftmost colorbar).
Figure 4
Figure 4
Comparative fluxomics between sampled flux distributions of genome-scale metabolic models of human- and animal-associated lineages. (A). Score plot of OPLS-DA (Orthogonal Partial Least Square Discriminant Analysis). The predictive component separates samples of animal-associated models from samples of human-associated models. (B). Proportion of reactions fluxes within each one of the altered subsystems positively correlated either to human or animal association (determined by the sign of the loading value of predictive component of each reaction, positive means correlated to human, negative to animal).
Figure 5
Figure 5
Hierarchical clustering analysis of the number of reactions removed of each subsystem within each lineage. Each row represents the number of reactions within each subsystem that were shut down when the genes were removed from the models, whereas the columns are the lineage-specific models. The clustering was performed with Euclidean and Ward D aggregation method.
Figure 6
Figure 6
Density plots of biomass fluxes of the samples of each one of the lineage-specific genome-scale metabolic models. The solution space of each one of the models was sampled 1000 times in conditions mimicking Middlebrock 7H9 OADC + cholesterol and densities were obtained for each model.
Figure 7
Figure 7
Workflow used in the analysis. We started with genomic sequences of Mycobacterium tuberculosis that aggregate in lineages and exhibit a complex phenotype (host association), and a reference sequence with a genome-scale metabolic model (GEM) available. Short reads mapping to reference served to identify deletions and potentially deleterious SNPs. We identified which of them were prevalent within each lineage and adapted the reference GEM to build lineage-specific versions. The resulting models were used to predict metabolic phenotypes, to later check if they can be used to separate lineages according to the complex phenotype (host association in our case). By identifying the most discriminant fluxes and the enriched subsystems in these fluxes, we can generate hypotheses relating the discriminant fluxes and the complex phenotype.

Similar articles

References

    1. WHO . Global Tuberculosis Report 2021. WHO; Geneva, Switzerland: 2021.
    1. Waters W.R., Palmer M.V., Buddle B.M., Vordermeier H.M. Bovine Tuberculosis Vaccine Research: Historical Perspectives and Recent Advances. Vaccine. 2012;30:2611–2622. doi: 10.1016/j.vaccine.2012.02.018. - DOI - PubMed
    1. de Jong B.C., Antonio M., Gagneux S. Mycobacterium Africanum-Review of an Important Cause of Human Tuberculosis in West Africa. PLoS Negl. Trop. Dis. 2010;4:e744. doi: 10.1371/journal.pntd.0000744. - DOI - PMC - PubMed
    1. Brites D., Gagneux S. Strain Variation in the Mycobacterium tuberculosis Complex: Its Role in Biology, Epidemiology and Control. Springer; Cham, Switzerland: 2017. The Nature and Evolution of Genomic Diversity in the Mycobacterium Tuberculosis Complex; pp. 1–26. - PubMed
    1. Yeboah-Manu D., de Jong B.C., Gehre F. Strain Variation in the Mycobacterium tuberculosis Complex: Its Role in Biology, Epidemiology and Control. Springer; Cham, Switzerland: 2017. The Biology and Epidemiology of Mycobacterium Africanum; pp. 117–133. - PubMed

Publication types