. 2022 Mar 14;12(3):447.
doi: 10.3390/biom12030447.

Inhibition of STAT6 Activation by AS1517499 Inhibits Expression and Activity of PPARγ in Macrophages to Resolve Acute Inflammation in Mice

Affiliations

Inhibition of STAT6 Activation by AS1517499 Inhibits Expression and Activity of PPARγ in Macrophages to Resolve Acute Inflammation in Mice

Ye-Ji Lee et al. Biomolecules. .

Abstract

Signal transducer and activator of transcription 6 (STAT6) promotes an anti-inflammatory process by inducing the development of M2 macrophages. We investigated whether modulating STAT6 activity in macrophages using AS1517499, the specific STAT6 inhibitor, affects the restoration of homeostasis after an inflammatory insult by regulating PPARγ expression and activity. Administration of AS1517499 suppressed the enhanced STAT6 phosphorylation and nuclear translocation observed in peritoneal macrophages after zymosan injection. In addition, AS1517499 delayed resolution of acute inflammation as evidenced by enhanced secretion of pro-inflammatory cytokines, reduced secretion of anti-inflammatory cytokines in PLF and supernatants from peritoneal macrophages, and exaggerated neutrophil numbers and total protein levels in PLF. We demonstrate temporal increases in annexin A1 (AnxA1) protein and mRNA levels in peritoneal lavage fluid (PLF), peritoneal macrophages, and spleen in a murine model of zymosan-induced acute peritonitis. In vitro priming of mouse bone marrow-derived macrophages (BMDM) and peritoneal macrophages with AnxA1 induced STAT6 activation with enhanced PPARγ expression and activity. Using AS1517499, we demonstrate that inhibition of STAT6 activation delayed recovery of PPARγ expression and activity, as well as impaired efferocytosis. Taken together, these results suggest that activation of the STAT6 signaling pathway mediates PPARγ expression and activation in macrophages to resolve acute inflammation.

Keywords: AS1517499; PPARγ; acute peritonitis; annexin A1; macrophages.


Conflict of interest statement

The authors declare that they have no conflict of interest.

Figures
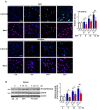
Figure 1
Figure 1
Administration of AS1517499 inhibits STAT6 activation after zymosan injection. Mice were injected i.p. with 1 mg zymosan (Zym) in 500 μL saline. Where indicated, the dose of 10 mg/kg AS1517499 (AS, i.p.) was administered 1 h before Zym injection and once every two days thereafter. (A) Left: Immunofluorescence staining for phospho-STAT6 (green) and macro-phage-specific marker (Mac3, Red) in peritoneal macrophages (PM) from Zym or AS+Zym-treated mice. Images were captured at 400× magnification. Right: Quantification of phospho-STAT6 staining in Mac3-positive macrophages. The imaging medium was Vectashield fluorescence mounting medium containing DAPI. Scale bars = 40 μm. Representative results from three mice per group are shown. (B) Left: Immunoblots analysis of total and phosphorylated STAT6/total STAT6 in spleen homogenates. Right: Densitometric analysis of the relative abundance of phosphorylated STAT6 (pSTAT6) normalized to that of total STAT6. Values represent the means ± SEM of results from five (A) or three mice (B) per group. * p < 0.05, ** p < 0.01, *** p < 0.001 compared with saline control; + p < 0.05, ++ p < 0.01, +++ p < 0.001 for Zym+AS vs. Zym at a given time point (Two-way ANOVA with Tukey’s post hoc test).
Figure 2
Figure 2
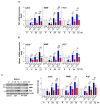
Administration of AS1517499 enhances pro-inflammatory mediators but reduces anti-inflammatory mediators after zymosan treatment. Peritonitis was induced as in Figure 1. Where indicated, the dose of 10 mg/kg AS1517499 (AS, i.p.) was administered 1 h before zymosan (Zym) injection and once every two days thereafter. (AF) ELISA of TNF-α, IL-6, MMP-2, IL-10, TGFβ, and HGF protein levels in the peritoneal lavage fluid (PLF). (GI) ELISA of TNF-α, IL-6, and MMP-2 in serum. (JN) ELISA of TNF-α, MIP-2, IL-10, TGFβ, and HGF in peritoneal macrophages (PM) cultured media. Values represent the means ± SEM of five (AE) or three mice (FN) per group. * p < 0.05, ** p < 0.01, *** p < 0.001 compared with saline control; + p < 0.05, ++ p < 0.01, +++ p < 0.001 for Zym+AS vs. Zym at a given time point (Two-way ANOVA with Tukey’s post hoc test).
Figure 2
Figure 2
Administration of AS1517499 enhances pro-inflammatory mediators but reduces anti-inflammatory mediators after zymosan treatment. Peritonitis was induced as in Figure 1. Where indicated, the dose of 10 mg/kg AS1517499 (AS, i.p.) was administered 1 h before zymosan (Zym) injection and once every two days thereafter. (AF) ELISA of TNF-α, IL-6, MMP-2, IL-10, TGFβ, and HGF protein levels in the peritoneal lavage fluid (PLF). (GI) ELISA of TNF-α, IL-6, and MMP-2 in serum. (JN) ELISA of TNF-α, MIP-2, IL-10, TGFβ, and HGF in peritoneal macrophages (PM) cultured media. Values represent the means ± SEM of five (AE) or three mice (FN) per group. * p < 0.05, ** p < 0.01, *** p < 0.001 compared with saline control; + p < 0.05, ++ p < 0.01, +++ p < 0.001 for Zym+AS vs. Zym at a given time point (Two-way ANOVA with Tukey’s post hoc test).
Figure 3
Figure 3
AS1517499 enhances recruitment of inflammatory cells and protein levels over the course of inflammation. Peritonitis was induced as in Figure 1. Where indicated, the dose of 10 mg/kg AS1517499 (AS, i.p.) was administered 1 h before zymosan (Zym) injection and once every two days thereafter. (A,B) Neutrophil and macrophage numbers in peritoneal lavage fluid (PLF). (C) Total protein levels in PLF were analyzed by protein assay kit. Values represent the means ± SEM of five mice per group. * p < 0.05, ** p < 0.01, *** p < 0.001 compared with saline control; + p < 0.05, +++ p < 0.001 for Zym+AS vs. Zym at a given time point (Two-way ANOVA with Tukey’s post hoc test).
Figure 4
Figure 4
Annexin A1 production is enhanced during zymosan-induced inflammation. Mice were injected i.p. with zymosan (Zym) and peritoneal lavage supernatant, peritoneal macrophages (PM), and spleens were collected at 6, 24, or 72 h after Zym injection. (A,B) The levels of Annexin A1 (AnxA1) and TNF-α-stimulated gene-6 (TSG6) mRNA over time in PM and spleens analyzed by real-time PCR and normalized to that of hypoxanthine guanine phosphoribosyl transferase (Hprt) mRNA. (C,D) The abundance of AnxA1 and TSG6 in peritoneal lavage fluid (PLF) as assessed by ELISA. (E) Immunoblots analysis of AnxA1 in spleen homogenates. Lower pannel: Densitometric analysis of AnxA1 normalized to that of β-actin. Values represent the means ± SEM of results from five (A,B) or three mice (CE). * p < 0.05, *** p < 0.001 compared with control at a given time point (Student’s t-test).
Figure 5
Figure 5
Annexin A1 enhances STAT6 activation and PPARγ expression and activation in BMDM and peritoneal macrophages. Immunoblots analysis of the relative amounts of phosphorylated STAT6/total STAT6 in mouse BMDM (A) and peritoneal macrophages (F) stimulated with Annexin A1 (AnxA1) for 2 h. Densitometric analysis of the relative abundance of the indicated proteins normalized to that of STAT6. Left: Immunofluorescence staining of phosphorylated STAT6 (green) in BMDM (B) and peritoneal macrophages (G) after 100 ng/mL AnxA1 treatment. The imaging medium was Vectashield fluorescence mounting medium containing DAPI. Original magnification: ×400. Scale bars = 40 μm. Representative results from three independent experiments are shown. Right: The ratio of phospho-STAT6 (+) over DAPI (+) macrophages is presented in the bar graph. Immunoblots analysis of the relative amounts of PPARγ, CD36, and β-actin in BMDM (C,E) and peritoneal macrophages (H,J) stimulated with AnxA1 for 24 h. Densitometric analysis of the relative abundance of the indicated proteins normalized to that of β-actin. PPARγ activity in nuclear extracts from BMDM (D) and peritoneal macrophages (I) was analyzed at 24 h after AnxA1 treatment as described in the Methods. Values represent the mean ± SEM of three independent experiments. * p < 0.05, ** p < 0.01, *** p < 0.001 compared with control (Student’s t-test).
Figure 6
Figure 6
Administration of AS1517499 inhibits PPARγ expression and activation. Peritonitis was induced as in Figure 1. Where indicated, the dose of 10 mg/kg AS1517499 (AS, i.p.) was administered 1 h before zymosan (Zym) injection and once every two days thereafter. (A) Changes in the abundance of PPARg mRNAs over time in peritoneal macrophages (PM) analyzed by real-time PCR and normalized to that of hypoxanthine guanine phosphoribosyl transferase (Hprt) mRNA. (B) Left: Immunofluorescence staining for PPARγ (red) and DAPI (blue) for the nuclei in peritoneal macrophages (PM) from mice treated with zymosan at the indicated times (400× magnification). The imaging medium was Vectashield fluorescence mounting medium containing DAPI. Scale bars = 40 μm. Results are representative of five mice at each time point after zymosan treatment. Right: Quantification of PPARγ staining. (C) PPARγ activity in nuclear extracts from PM was analyzed as described in Methods. (D) Changes in the abundance of PPARg mRNA over time in spleens analyzed by real-time PCR and normalized to that of Hprt mRNA. (E) Left: Immunoblots analysis of the abundance of PPARγ protein in spleen samples at the indicated times. β-actin was used as a loading control. Right: Densitometric analysis of the relative abundance of PPARγ in each sample. Values represent the mean ± SEM of five (A,B,D) or three mice (C,E) per group. * p < 0.05, ** p < 0.01, *** p < 0.001 compared with saline control; + p < 0.05, ++ p < 0.01, +++ p < 0.001 for Zym+AS vs. Zym at a given time point (Two-way ANOVA with Tukey’s post hoc test).
Figure 7
Figure 7
Administration of AS1517499 reduces PPARγ target molecule expression. Peritonitis was induced as in Figure 1. Where indicated, the dose of 10 mg/kg AS1517499 (AS, i.p.) was administered 1 h before zymosan (Zym) injection and once every two days thereafter. (A,B) Changes in the abundance of CD36, MMR, and Arg1 mRNAs over time in peritoneal macrophages (PM) and spleens analyzed by real-time PCR and normalized to that of hypoxanthine guanine phosphoribosyl transferase (Hprt) mRNA. (C) Left: Immunoblots analysis of the abundance of CD36, MMR, and Arg1 proteins in spleen samples at the indicated times. β-actin was used as a loading control. Right: Densitometric analysis of the relative abundance of the indicated protein in each sample. Values represent the mean ± SEM of five (A,B) or three mice (C) per group. * p < 0.05, *** p < 0.001, compared with saline control; + p < 0.05, ++ p < 0.01, +++ p < 0.001 for Zym+AS vs. Zym at a given time point (Two-way ANOVA with Tukey’s post hoc test).
Figure 8
Figure 8
AS1517499 inhibits efferocytic activity of peritoneal macrophages in zymosan-induced peritonitis in vivo and ex vivo. Peritonitis was induced as in Figure 1. Where indicated, the dose of 10 mg/kg AS1517499 (AS, i.p.) was administered 1 h before zymosan (Zym) injection and once every two days thereafter. (A,B) Peritoneal lavage (PL) was performed, cytospins were stained, and peritoneal macrophage ingestions of apoptotic cells were quantified by calculating a phagocytic index (PI). (B) Photomicrographs show macrophage ingestions of apoptotic cells were quantified by calculating a phagocytic index (PI). (B) Photomicrographs show cytospin-stained PL cells at 72 h after Zym treatment. (C,D) Peritoneal macrophages (105 cells/mL) were cultured ex vivo with apoptotic Jurkat cells (5 × 10⁵/mL) labeled with PKH67 (green) for 90 min, and phagocytosis was quantified by calculating a PI. (D) Green color represents apoptotic cells that are engulfed by peritoneal macrophages. (B,D) Original magnification: ×200. Scale bars = 20 μm. Arrowheads indicate peritoneal macrophages with engulfed apoptotic cells or fragments. Values represent the means ± SEM three mice per group. *** p < 0.05 compared with saline control; + p < 0.05, +++ p < 0.001 for Zym+AS vs. Zym at a given time point (Two-way ANOVA with Tukey’s post hoc test).

Similar articles

Cited by

References

    1. Liao X., Sharma N., Kapadia F., Zhou G., Lu Y., Hong H., Paruchuri K., Mahabeleshwar G.H., Dalmas E., Venteclef N., et al. Krüppel-like factor 4 regulates macrophage polarization. J. Clin. Investig. 2011;121:2736–2749. doi: 10.1172/JCI45444. - DOI - PMC - PubMed
    1. Bhattacharjee A., Shukla M., Yakubenko V.P., Mulya A., Kundu S., Cathcart M.K. IL-4 and IL-13 employ discrete signaling pathways for target gene expression in alternatively activated monocytes/macrophages. Free Radic. Biol. Med. 2013;54:1–16. doi: 10.1016/j.freeradbiomed.2012.10.553. - DOI - PMC - PubMed
    1. Van Dyken S.J., Locksley R.M. Interleukin-4- and Interleukin-13-mediated alternatively activated macrophages: Role in homeostasis and disease. Annu. Rev. Immunol. 2013;31:317–343. doi: 10.1146/annurev-immunol-032712-095906. - DOI - PMC - PubMed
    1. Rudolph A.K., Walter T., Erkel G. The fungal metabolite cyclonerodiol inhibits IL-4/IL-13 induced Stat6-signaling through blocking the association of Stat6 with p38, ERK1/2 and p300. Int. Immunopharmacol. 2018;65:392–401. doi: 10.1016/j.intimp.2018.10.033. - DOI - PubMed
    1. McCormick S.M., Heller N.M. Commentary: IL-4 and IL-13 receptors and signaling. Cytokine. 2015;75:38–50. doi: 10.1016/j.cyto.2015.05.023. - DOI - PMC - PubMed

Publication types