. 2022 Mar 16;12(3):456.
doi: 10.3390/biom12030456.

Colocalization Analysis of Peripheral Myelin Protein-22 and Lamin-B1 in the Schwann Cell Nuclei of Wt and TrJ Mice

Affiliations

Colocalization Analysis of Peripheral Myelin Protein-22 and Lamin-B1 in the Schwann Cell Nuclei of Wt and TrJ Mice

María Vittoria Di Tomaso et al. Biomolecules. .

Abstract

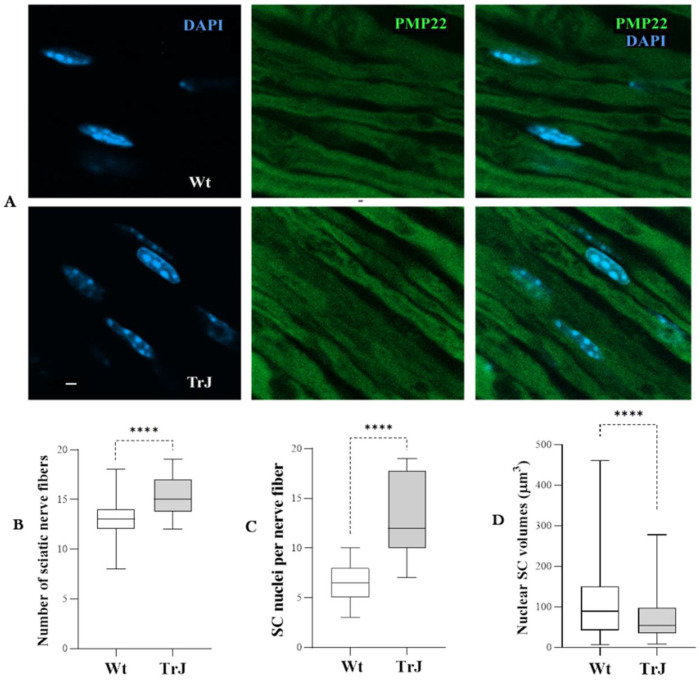
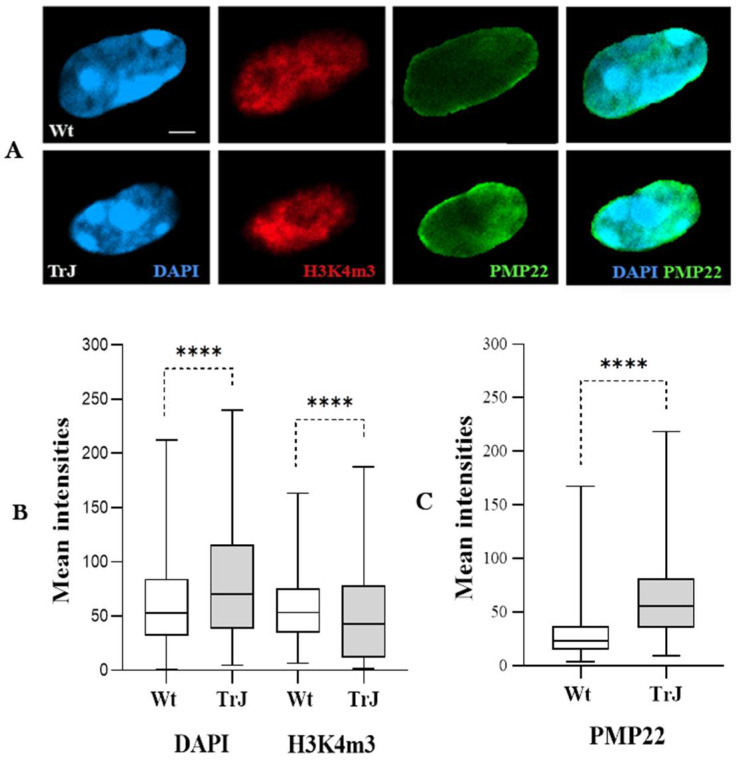
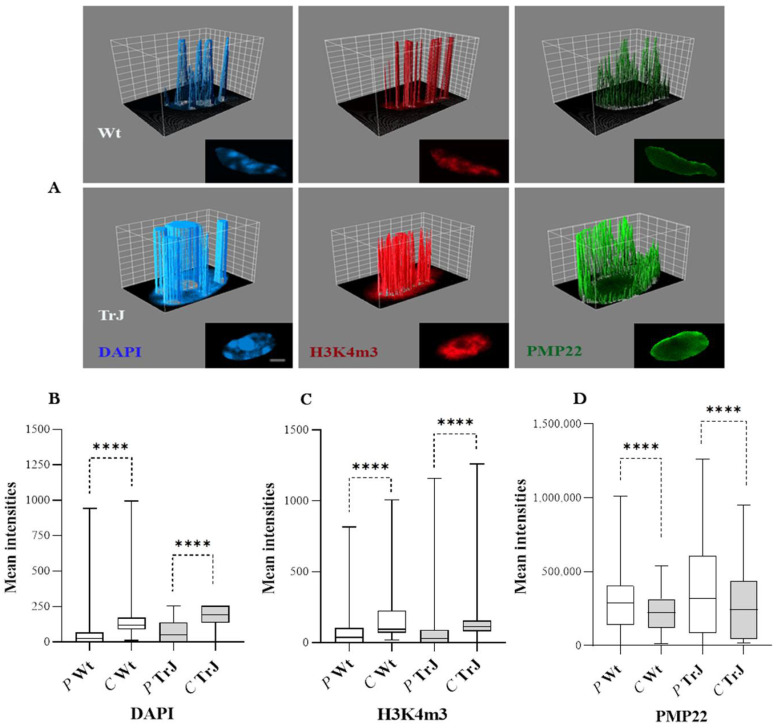
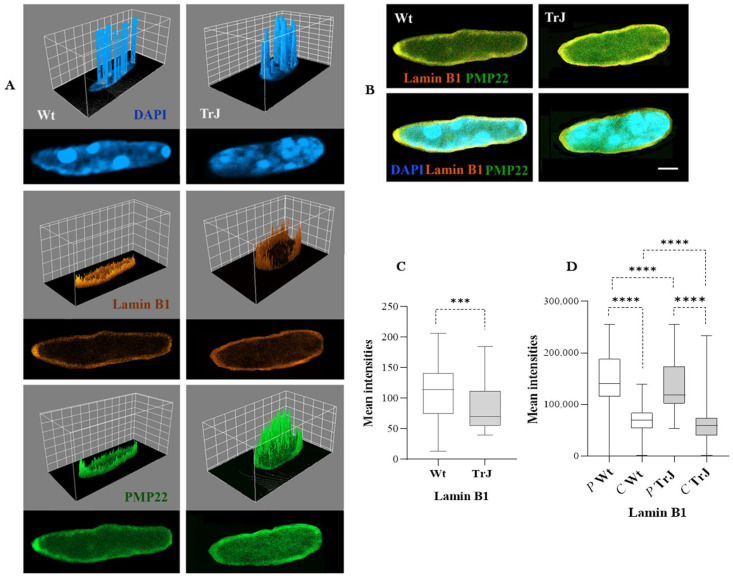
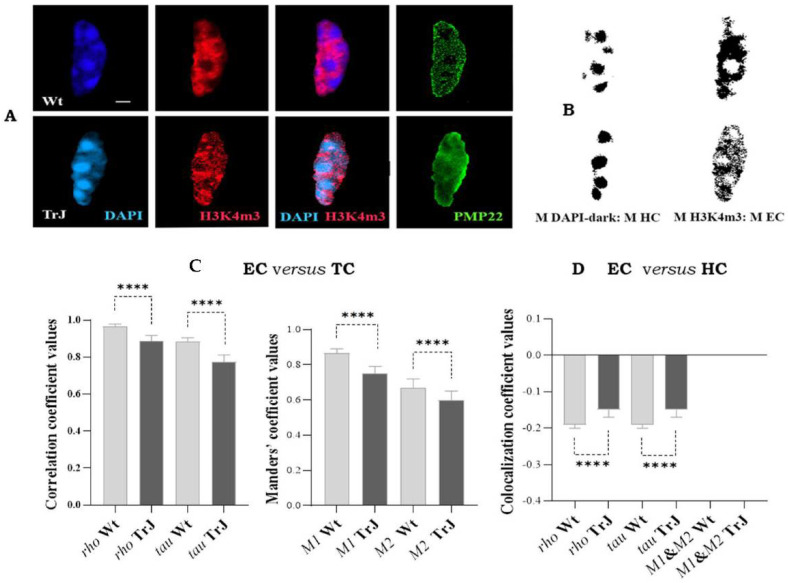
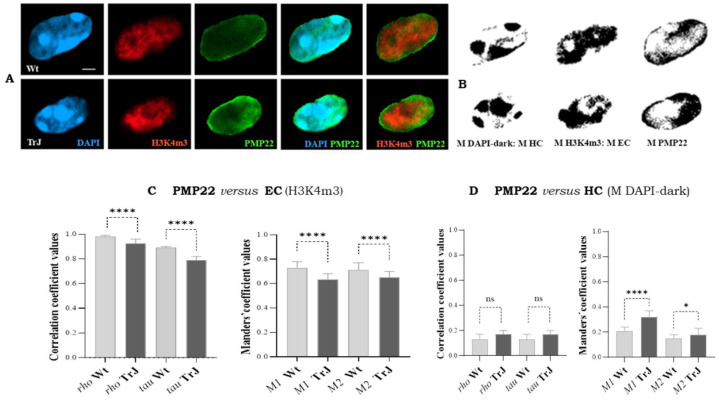
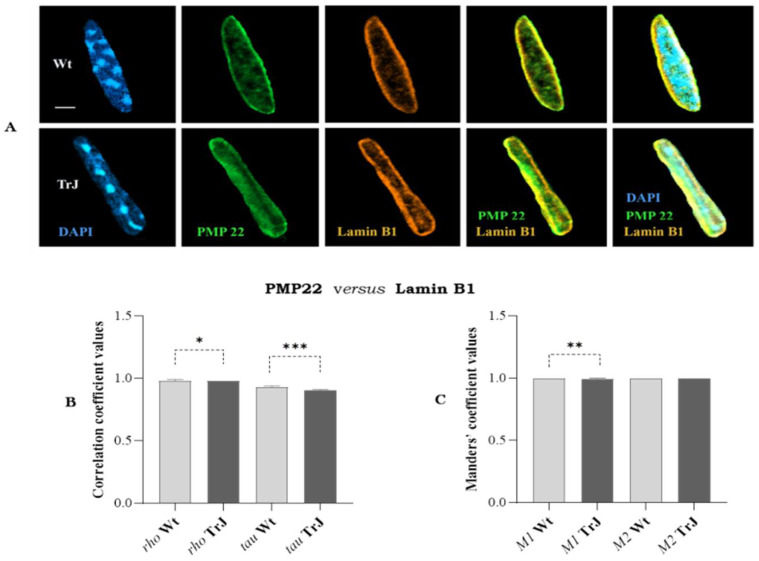
Myelination of the peripheral nervous system requires Schwann cells (SC) differentiation into the myelinating phenotype. The peripheral myelin protein-22 (PMP22) is an integral membrane glycoprotein, expressed in SC. It was initially described as a growth arrest-specific (gas3) gene product, up-regulated by serum starvation. PMP22 mutations were pathognomonic for human hereditary peripheral neuropathies, including the Charcot-Marie-Tooth disease (CMT). Trembler-J (TrJ) is a heterozygous mouse model carrying the same pmp22 point mutation as a CMT1E variant. Mutations in lamina genes have been related to a type of peripheral (CMT2B1) or central (autosomal dominant leukodystrophy) neuropathy. We explore the presence of PMP22 and Lamin B1 in Wt and TrJ SC nuclei of sciatic nerves and the colocalization of PMP22 concerning the silent heterochromatin (HC: DAPI-dark counterstaining), the transcriptionally active euchromatin (EC), and the nuclear lamina (H3K4m3 and Lamin B1 immunostaining, respectively). The results revealed that the number of TrJ SC nuclei in sciatic nerves was greater, and the SC volumes were smaller than those of Wt. The myelin protein PMP22 and Lamin B1 were detected in Wt and TrJ SC nuclei and predominantly in peripheral nuclear regions. The level of PMP22 was higher, and those of Lamin B1 lower in TrJ than in Wt mice. The level of PMP22 was higher, and those of Lamin B1 lower in TrJ than in Wt mice. PMP22 colocalized more with Lamin B1 and with the transcriptionally competent EC, than the silent HC with differences between Wt and TrJ genotypes. The results are discussed regarding the probable nuclear role of PMP22 and the relationship with TrJ neuropathy.

Keywords: Lamin B1; PMP22; Schwann cells nuclei; Trembler-J; colocalization-analysis.


Conflict of interest statement

The authors declare no conflict of interest.

Figures

Figure 1
Figure 1
Fibers and Schwann cell nuclei in Wt and TrJ sciatic nerves. (A): Confocal images of Wt and TrJ sciatic nerve fibers. (BD): Box plots illustrating the distribution of number of fibers, and SC nuclei through the whole thickness of sections and SC nuclear volumes (µm3) of Wt and TrJ, respectively. The fibers were immunostained using anti-PMP22 (green), after epitope retrieval (70% formic acid), and counterstained with DAPI (blue). Both areas and volumes were measured on DAPI channel. Boxes enclose the data comprising between the 25th and 75th percentiles (50% of the data). The median (50th percentile) is denoted by the transversal line within each box. Differences between Wt and TrJ were examined by means of Mann–Whitney tests (**** p-Values < 0.0001). Number of panoramic images analyzed = 20 per genotype. Volumes were calculated in 150 SC nuclei per genotype. Scale bar = 2 µm. Both the fiber and SC nucleus numbers were significantly larger in TrJ than in Wt sciatic nerves, whereas SC nuclear volume was significantly smaller in TrJ than Wt mice.
Figure 2
Figure 2
DAPI, H3K4m3, and PMP22 signals in Wt and TrJ Schwann cell nuclei. (A): Confocal images of a central slice of a TrJ or Wt SC nucleus. The fibers were immunostained with anti-H3K4m3 (red) anti-PMP22 (green) antibodies, after epitope retrieval (70% formic acid), and counterstained with DAPI (blue). Box plots representing the mean intensity values (arbitrary units) of DAPI and H3K4m3 (B) and PMP22 (C) signals measured on TrJ and Wt SC nuclei. The boxes containing 50% of the data, presented the median as a transversal line within them. Differences between Wt and TrJ were verified by applying Mann–Whitney tests (**** p-Values < 0.0001) in 150 SC nuclei per genotype. Scale bar = 2 µm. Both Wt and TrJ SC nuclei express PMP22. The intensity of PMP22 was significantly higher in TrJ than in Wt. Furthermore, the overall DAPI intensity of chromatin was significantly higher in TrJ relative to Wt, but the H3K4m3 euchromatic signal intensity was significantly lower in TrJ than in Wt SC nuclei.
Figure 3
Figure 3
Peripheral versus central distributions of DAPI, H3K4m3, and PMP22 signals in Wt and TrJ Schwann cell nuclei. (A): 3D surface plot illustrating intensity (arbitrary units) of DAPI, H3K4m3, and PMP22 signal distributions upon a central plane of each Wt or TrJ SC nucleus. The peaks correspond to nuclear regions of greatest intensity (arbitrary units). The confocal images used to perform the 3D surface plots are presented below each corresponding 3D plot. Box plots show the peripheral (P) versus central (C) distribution of (B): DAPI, (C): H3K4m3 and (D): PMP22 signals in Wt and TrJ SC nuclei. The boxes enclose 50% of the data and represent the median and 25% and 75% quartiles. Differences between peripheral versus central distribution in Wt and TrJ were verified by applying Mann–Whitney tests (**** p-Values < 0.0001) in 100 SC nuclei per genotype. Scale bar = 2 µm. The intensities of each DAPI and H3K4m3 chromatin mark significantly prevail in the central SC nuclear regions, while PMP22 signals significantly predominate in the peripheral SC nuclear areas of the Wt and TrJ genotypes.
Figure 4
Figure 4
Lamin B1 intensity, peripheral versus central Lamin B1 distribution, and its relationship to PMP22 in Wt and TrJ Schwann cell nuclei. (A): 3D surface plot illustrating the intensity of DAPI, Lamin B1, and PMP22 signal (arbitrary units) distributions upon a central plane of each Wt or TrJ SC nucleus. The peaks correspond to nuclear regions of the greatest intensity. The confocal images of Wt and TrJ Sc nuclei are presented below each corresponding 3D plot. (B): Merge images of Lamin B1 and PMP22 or DAPI, Lamin B1 and PMP22. (C,D): Box plot showing Lamin B1 intensities and its peripheral (P) versus central (C) distribution in Wt and TrJ SC nuclei, respectively. Median and 25% and 75% quartiles are represented in each box. Differences between peripheral versus central distribution in Wt and TrJ were verified by applying Mann–Whitney tests (p-Values: *** < 0.001, **** < 0.0001) in 100 SC nuclei per analysis and genotype. Scale bar = 2 µm. Lamin B1 fluoresces less intensely in TrJ than Wt SC nuclei and preferentially localizes to peripheral SC nuclear regions where PMP22 intensity is significantly prevalent in both Wt and TrJ mice.
Figure 5
Figure 5
Colocalization analysis of euchromatin and heterochromatin in Schwann cell nuclei. (A): Images of Wt and TrJ SC nuclei showing DAPI (blue), euchromtic H3K4m3 (red) and PMP22 (green) signals. (B): Respectively mask images of heterocromatin (M HC) and euchromatin (M EC), obtained using the threshold tool of Fiji. (C): Colocalization between euchromatin (EC) and total chromatin (TC). M1: fraction of EC (H3K4m3 signal) in TC (DAPI-light + DAPI-dark signals), and M2: fraction of TC in EC. (D): Colocalization between EC (M H3K4m3) and HC (M DAPI-dark). M1: fraction of EC (M H3K4m3) in HC (M DAPI−dark), and respectively M2: fraction of HC (M DAPI-dark) in EC (M H3K4m3). Rho and tau correlations and M1 and M2 co-occurrence coefficients were estimated employing Fiji Coloc 2 plugins with Costes p-Values > 95%. The bar diagrams illustrate the medians and 95% confidence intervals of the coefficients. Scale bar = 2 µm. Differences between Wt and TrJ were established applying Mann–Whitney tests (**** p-Values < 0.0001) in 100 SC nuclei per genotype. As expected, in both Wt and SC nuclei, EC colocalizes with TC and anticolocalizes with HC, both relationships being significantly stronger in Wt than TrJ SC nuclei.
Figure 6
Figure 6
Colocalization analysis of PMP22 with euchromatin and heterochromatin in Schwann cell nuclei. (A): Images of Wt and TrJ SC nuclei showing DAPI (blue), euchromtic H3K4m3 (red) and PMP22 (green) signals. (B): Respectively mask images of heterochromatin (M HC), euchromatin (M EC) and PMP22 (M PMP22, obtained using the threshold tool of Fiji. (C): Colocalization analysis between PMP22 (PMP22 signal) and euchromatin (H3K4m3 signal). M1: fraction of euchromatin in PMP22 area, and M2: fraction of PMP22 area in euchromatin. (D): Colocalization analysis between PMP22 (PMP22 signal) and heterochromatin (M HC). M1: fraction of heterochromatin in PMP22 area, and M2: fraction of PMP22 area in heterochromatin. (B,C): Bar diagrams representing, by means of median and 95% confidence intervals, the distributions of rho and tau correlations and M1 and M2 co-occurrence coefficients, respectively. Rho, tau, M1 and M2 were obtained employing Fiji Coloc 2 plugins with Costes p-Values > 95%. The bar diagrams represent the medians and 95% confidence intervals of the coefficients. Differences between Wt and TrJ were analyzed applying Mann–Whitney tests (p-Values: * < 0.01 and **** < 0.0001) in 100 SC nuclei per genotype. Scale bar = 2 µm. Correlations and co-occurrence coefficient values denote that PMP22 colocalize with EC and much lesser with HC in both Wt and TrJ SC nuclei. However, there is more colocalization with EC in Wt and more colocalization with HC in TrJ.
Figure 7
Figure 7
Analysis of colocalization between PMP22 and Lamin B1 in Schwann cell nuclei. (A): Images of Wt and TrJ SC nuclei showing DAPI (blue), Lamin B1 (brown) and PMP22 (green) signals (B): Distribution of rho and tau correlation coefficients between PMP22 and Lamin B1 signals. (C): Distribution of M1 (fraction of PMP22 area in Lamin B1 area) and M2 (fraction of Lamin B1 area in PMP22 22) co-occurrence coefficients. Rho, tau, M1 and M2 were estimated employing Fiji Coloc 2 plugins with Costes p-Values > 95%. The respectively coefficient distributions are represented by bar diagrams illustrating the medians and 95% confidence intervals. Differences between Wt and TrJ were analyzed employing Mann–Whitney tests (* p-Values = 0.03, ** = 0.002, and *** = 0.0001 in 100 SC nuclei per genotype. Scale bar = 2 µm. Correlations and co-occurrence coefficient values indicate that PMP22 colocalizes with Lamin B1 in Wt and TrJ SC nuclei. The correlation (rho and tau) was significantly better in Wt than TrJ. The fraction of PMP22 area in Lamin B1 area (M1) was lesser in TrJ SC nuclei, while the fraction of Lamin B1 in PMP22 areas (M2) was the same in SC nuclei of both genotypes.

Similar articles

Cited by

References

    1. Snipes G.J., Suter U., Welcher A.A., Shooter E.M. Characterization of a novel peripheral nervous system myelin protein (PMP-22/SR13) J. Cell Biol. 1992;117:225–238. doi: 10.1083/jcb.117.1.225. - DOI - PMC - PubMed
    1. Haney C., Snipes G.J., Shooter E.M., Suter U., Garcia C., Griffin J.W., Trapp B.D. Ultrastructural distribution of PMP22 in 2. Charcot-MarieTooth disease type 1A. J. Neuropathol. Exp. Neurol. 1996;55:290–299. doi: 10.1097/00005072-199603000-00004. - DOI - PubMed
    1. Bronstein J.M. Function of tetraspan proteins in the myelin sheath. Curr. Opin. Neurobiol. 2000;10:552–557. doi: 10.1016/S0959-4388(00)00125-2. - DOI - PubMed
    1. Quarles R.H. Myelin sheaths: Glycoproteins involved in their formation, maintenance, and degeneration. Cell. Mol. Life Sci. 2002;59:1851–1871. doi: 10.1007/PL00012510. - DOI - PMC - PubMed
    1. Manfioletti G., Ruaro M.E., Del S.G., Philipson L., Schneider C. A growth arrest-specific (gas) gene codes for a membrane protein. Mol. Cell Biol. 1990;10:2924–2930. - PMC - PubMed

Publication types