Review
. 2022 Mar 16;12(3):459.
doi: 10.3390/biom12030459.

Bifurcations and Proarrhythmic Behaviors in Cardiac Electrical Excitations

Affiliations
Review

Bifurcations and Proarrhythmic Behaviors in Cardiac Electrical Excitations

Kunichika Tsumoto et al. Biomolecules. .

Abstract

The heart is a hierarchical dynamic system consisting of molecules, cells, and tissues, and acts as a pump for blood circulation. The pumping function depends critically on the preceding electrical activity, and disturbances in the pattern of excitation propagation lead to cardiac arrhythmia and pump failure. Excitation phenomena in cardiomyocytes have been modeled as a nonlinear dynamical system. Because of the nonlinearity of excitation phenomena, the system dynamics could be complex, and various analyses have been performed to understand the complex dynamics. Understanding the mechanisms underlying proarrhythmic responses in the heart is crucial for developing new ways to prevent and control cardiac arrhythmias and resulting contractile dysfunction. When the heart changes to a pathological state over time, the action potential (AP) in cardiomyocytes may also change to a different state in shape and duration, often undergoing a qualitative change in behavior. Such a dynamic change is called bifurcation. In this review, we first summarize the contribution of ion channels and transporters to AP formation and our knowledge of ion-transport molecules, then briefly describe bifurcation theory for nonlinear dynamical systems, and finally detail its recent progress, focusing on the research that attempts to understand the developing mechanisms of abnormal excitations in cardiomyocytes from the perspective of bifurcation phenomena.

Keywords: action potential; afterdepolarizations; bifurcation theory; cardiac arrhythmias; nonlinear dynamical system.


Conflict of interest statement

The authors declare no conflict of interest.

Figures
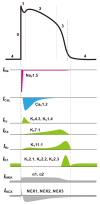
Figure 1
Figure 1
Schematic representation of a typical action potential (AP) in the ventricular myocyte and the respective ion channel currents that contribute to AP formation. It also indicates the major molecules that constitute ion channels and transporters (for the meanings of individual symbols, see text).
Figure 2
Figure 2
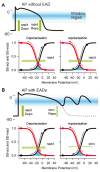
Relationships between membrane potential changes in response to depolarization and repolarization in a normal AP without EAD (A) and an abnormal AP with EADs (B) and voltage-dependent activation/inactivation of the L-type Ca2+ channel. Excessive APD prolongation due to slow repolarization leads to a long-lasting stay of the membrane potential in the L-type Ca2+ channel current (ICaL) window current region (blue areas), resulting in large reactivation of ICaL. SS-act: steady-state activation curve (black lines); SS-inact: steady-state inactivation curve (red lines); Depo: depolarization; Repo: repolarization.
Figure 3
Figure 3
Schematic diagram showing how the dynamics of individual ion channels, transporters, [Ca2+]I, and [Na+]i contribute to EAD generation and regulation. The diagram depicts the major functional components (IKs, IKr, ICaL, INCX, and INKA), factors involved in Ca2+- and Na+-handling, heart rate (HR), and their interactions related to EAD generation and regulation. The upward and downward arrows represent an increase (or enhancements) and decrease (or attenuations) in each factor, respectively. A decrease in HR (bradycardia) decreases Na+ influx via the Na+ channel activation, resulting in a decrease in [Na+]i. This reduction in [Na+]i facilitates EAD generation through a decrease in outward INKA during AP phase 2. On the other hand, a decrease in HR prolongs AP phase 4, i.e., diastolic interval (DI), and the prolongation of DI increases the amount of Na+ influx through NCX and thus causes [Na+]i elevation. This [Na+]i elevation increases Na+ efflux through NAK and outward INAK during AP phase 2. This may counteract the decrease in [Na+]i due to reduced INa and the resulting reduction in INKA (modified from Figure 11 in [85]). For details of other depicted interactions that affect EAD formation, see text.
Figure 4
Figure 4
Schematic diagram of the structure and electrical properties of a ventricular myocyte. (A): Ion channel and transporter molecules embedded in the cell membrane, sarcoplasmic reticulum (Ca2+ cycling), and Ca2+-binding molecules related to excitation and contraction. (B): An equivalent circuit model of the cell membrane, composed of the ion channel conductance (g), membrane capacitance (Cm), and electromotive force (E) representing ion concentration gradients. The current (I) flowing through each voltage-gated ion channel is represented by the product of the time-dependent variable conductance and driving force as the difference between the membrane potential (Vm) and individual reversal potential. gx: maximum conductance of ion channels x, for x = Na+, Ca2+, K+, etc.; INa: fast sodium channel current; Ito: transient outward K+ channel current; IKr and IKs: fast and slow components, respectively, of delayed rectifier K+ channel currents; ICaL: L-type Ca2+ channel current; ICaT: T-type Ca2+ channel current; IK1: inward rectifier K+ channel current; INKA: Na+/K+ ATPase current; INCX: Na+/Ca2+ exchanger current; Ip(Ca): Ca2+ pump current in the sarcolemmal membrane; Jrel: SR Ca2+ release flux by Ca2+-induced Ca2+-release; Jup: Ca2+ uptake flux via Ca2+ pump (SERCA) in the SR; Jleak: Ca2+ leakage flux from the SR; JSR: junctional SR; NSR: network SR; CMDN: calmodulin; TRPN: troponin; SS: a subspace of the myoplasm. For details of other symbols, refer to references [99,114,115,116,117].
Figure 5
Figure 5
Examples of a dynamical system with continuous time and with discrete time. (A): An action potential (AP) train evoked in a cardiomyocyte with stimuli (Istim) applied at a cycle length of CL, which is a typical example of the response of a dynamical system with continuous time. AP duration of the AP evoked by the ith stimulus is denoted as APDi for i = 0, 1, 2, …, n, …, k − 1, k, …. (B): A point sequence consisting of APD values determined for the AP train and plotted on the (APDn, APDn+1)-plane. If a mapping P (Poincaré map) is obtained to represent the relationship between a point (APDn) and the next point (APDn+1), i.e., the dynamics of the point sequence, then the differential system with continuous time is transformed into a difference system with discrete time. The dynamics of such the difference system with discrete time can then be studied by projecting the point sequence dynamics into the state space, e.g., (APDn, APDn+1)-plane. Thereby, it is possible to examine the dynamics of the original differential system with continuous time more efficiently. In general, the Poincaré map is difficult to obtain analytically and is mostly obtained numerically. For examples of experimental and numerical methods for obtaining Poincaré maps, see [124,125].
Figure 6
Figure 6
Hopf bifurcation. Examples of the dynamic responses to changes in the parameter λ in the 2-dimensional (x, y)-state space (A) and 3-dimensional (x, y, λ)-space (B). Schematic examples of membrane potential changes at the parameter λ0, λ1, λ2 in the 3-dimensional (x, y, λ)-space of panel (A,C). Changing the system parameter λ, the stability of an equilibrium point (EP) changes via a Hopf bifurcation. Before and after the occurrence of a Hopf bifurcation (λ*), a stable EP becomes unstable with the emergence of a limit-cycle (LC) oscillation.
Figure 7
Figure 7
Saddle-node (SN) bifurcation. Schematic diagrams of the SN bifurcations of equilibrium (A) and fixed (B) points. As simple examples, in the dynamical systems dx/dt = f(x, λ) (A) and xn+1 = P(xn, λ) (B), the functions f(x) and P(xn) are varied up and/or down by changing system parameter λ. The SN bifurcation of equilibrium points occurs when the curve of f(x) touches the x-axis (dx/dt = 0 axis). On the other hand, the SN bifurcation of fixed points occurs when the curve of P(xn) touches the diagonal line (xn+1 = xn) at a value λ* of parameters. After that, a node and a saddle point emerge or disappear. A schematic diagram of Arnold’s tongue structure is also shown for a non-autonomous system with stimuli of various amplitudes and frequencies (C). Colored regions indicate parameter regions in which a periodic oscillation observed in an autonomous system can be entrained by external periodic stimuli, e.g., the orange region represents harmonic synchronized oscillation observed in the non-autonomous system. In general, the harmonic synchronized region and even the sub-harmonic synchronous region (e.g., blue and green regions) are divided in the parameter space by SN bifurcation sets. Oscillations that are asynchronous to the periodic stimuli, such as quasi-periodic oscillations, appear when set to parameters outside the synchronization region. f0: an intrinsic frequency of the limit-cycle oscillation in the autonomous system.
Figure 8
Figure 8
Bifurcation phenomena associated with stable and unstable manifolds of an equilibrium point. (A) A schema of stable and unstable manifolds of the equilibrium point x0 in the state space. Ws(x0), stable manifold; Wu(x0), unstable manifold. (B) Homoclinic bifurcation. When the parameter λ becomes the value of Hom, the stable and unstable manifolds of the equilibrium point x0 coincide, giving rise to a closed-loop orbit, which is referred to as “homoclinic orbit”. This closed-loop orbit is vulnerable to changes in the parameters and breaks down immediately. (C) Saddle-node invariant cycle bifurcation. At the bifurcation parameter value λ*, saddle-node and homoclinic bifurcations occur simultaneously.
Figure 9
Figure 9
Schematic diagrams of period-doubling and Neimark–Sacker bifurcations. (A): A typical example of the period-doubling (PD) bifurcation in non-autonomous systems is AP alternans (i). As the cycle length (CL) becomes shorter, the stable fixed point on the (APDn, APDn+1)-plane becomes unstable at the period-doubling bifurcation point (λ*), and a pair of periodic points is generated (ii). (B): The change in a limit-cycle (LC) oscillation through the Neimark–Sacker (NS) bifurcation in autonomous systems. The NS bifurcation occurs at λ* as the parameter λ changes. Then, the LC oscillation becomes unstable and a torus-like oscillatory response, so-called “quasi-periodic oscillation”, occurs around the unstable LC oscillation. When the quasi-periodic oscillation is discretized as a point sequence via the Poincaré mapping, a closed curve, which is referred to as an “invariant closed curve (ICC)”, appears around the unstable fixed point that reflects the unstable LC oscillation.
Figure 10
Figure 10
Bifurcation phenomena and action potential behaviors observed in the Kurata model [112] of a human ventricular myocyte. (A) A two-parameter bifurcation diagram on the (GKr, GKs)-parameter plane (top) obtained using MATCONT [154] and a phase diagram (bottom) obtained by AP simulations. The maximum conductances of the rapid (GKr) and slow (GKs) components of delayed rectifier K+ channel currents are expressed as normalized values, i.e., ratios to the control values. In the two-parameter bifurcation diagram (top), the symbols H and PD represent the loci of parameter sets that cause the Hopf bifurcation of an equilibrium point and period-doubling bifurcation of a limit cycle (LC), respectively. The gray region indicates the area of parameters in which a stable LC can be observed. On the other hand, in the phase diagram (bottom), the orange and white regions represent parameter regions in which an AP with and without EAD, respectively, can be observed in the Kurata model. The gray point with the symbol N indicates the control condition with the normal GKr and GKs. (B) A merged phase diagram. (C) A one-parameter bifurcation diagram of APD at 90% repolarization (APD90) in each AP response as a function of GKr; see the blue arrow in panel (B), which indicates the change in GKr with the fixed normal GKs (1). The solid and dashed lines in (C) represent stable and unstable AP responses, respectively. SN: saddle-node bifurcation; EAD1–3: AP with 1–3 EAD(s); PD: period-doubling bifurcation. NS: Neimark–Sacker bifurcation. (D) An example of tetra-stable AP dynamics in the Kurata model at 0.39 × GKr with 0.70 × GKs. Colored and grey lines indicate the steady-state and transient responses, respectively. Dots indicate the application of current pulses. Pacing cycle length = 2 s. Each panel was modified from [85,130].
Figure 11
Figure 11
Examples of the slow–fast decomposition analysis. AP simulations and slow–fast decomposition analyses were performed using the Kurata model [112] with GKr = 100% (A) and GKr = 0.5 × control (B). (Left) The membrane potential (Vm) and the time course of IKs open probability (n2) in the full system. (Center) One-parameter bifurcation diagrams of the fast subsystem, depicting quasi-equilibrium potentials (qEQ1–3) and the potential extrema of quasi limit cycles (qLCs) as a function of the slow variable n2. The trajectory of the full system projected onto the (Vm, n2)-plane is superimposed on the one-parameter bifurcation diagram of the fast subsystem. Solid and dashed thin lines of qEQ1–3 indicate stable and unstable equilibrium potentials, respectively. The black and gray thick lines are stable and unstable qLCs, respectively. H: Hopf bifurcation; SN: saddle-node bifurcation of limit cycles; PD: period-doubling bifurcation of limit cycles; hom: homoclinic bifurcation. (Right) Schematic diagrams representing the relationships between the dynamic behavior projected onto the 3-dimensional state space of the full system and the bifurcation structure of the fast subsystem. Modified from [197].

Similar articles

Cited by

References

    1. Guckenheimer J.M., Holmes P. Nonlinear Oscillations, Dynamical Systems, and Bifurcations of Vector Fields. Springer; New York, NY, USA: 1986. p. 453.
    1. Nusse H.E., Yorke J.A., Kostelich Y.J. Dynamics: Numerical Explorations. Springer; New York, NY, USA: 1994. p. 484.
    1. Noble D. The Music of Life: Biology beyond the Genome. Oxford University Press; Oxford, UK: 2006. 153p
    1. Noble D. A theory of biological relativity: No privileged level of causation. Interface Focus. 2012;2:55–64. doi: 10.1098/rsfs.2011.0067. - DOI - PMC - PubMed
    1. Furutani K., Tsumoto K., Kurachi Y. HD Physiology Project-Japanese efforts to promote multilevel integrative systems biology and physiome research. NPJ Syst. Biol. Appl. 2017;3:1. doi: 10.1038/s41540-016-0001-0. - DOI - PMC - PubMed

Publication types