. 2022 Mar 16;12(3):460.
doi: 10.3390/biom12030460.

Calystegines Improve the Metabolic Activity of Human Adipose Derived Stromal Stem Cells (ASCs) under Hyperglycaemic Condition through the Reduction of Oxidative/ER Stress, Inflammation, and the Promotion of the AKT/PI3K/mTOR Pathway

Affiliations

Calystegines Improve the Metabolic Activity of Human Adipose Derived Stromal Stem Cells (ASCs) under Hyperglycaemic Condition through the Reduction of Oxidative/ER Stress, Inflammation, and the Promotion of the AKT/PI3K/mTOR Pathway

Anna Kowalczuk et al. Biomolecules. .

Abstract

Hyperglycaemia and its resulting glucotoxicity are among the most prominent hallmarks of diabetes mellitus (DM) development. Persistent hyperglycaemia further leads to oxidative stress via mitochondrial dysfunction and subsequent ER stress onset, while associated hyperlipidaemia triggers the adipose tissue to secrete pro-inflammatory cytokines. In this study, the effect of calystegines has been investigated in an experimental model of hyperglycaemia induced on human ASCs cells. Different cellular pathways including apoptosis, oxidative and ER stress, inflammation as well as Pi3K/AKT/mTOR metabolic-associated axis have been evaluated by means on RT-qPCR, western blot, and flow cytometry techniques. Treatment of HuASCs cells with calystegines strongly promoted the hyperglycaemic cells survival and significantly diminished oxidative stress, mitochondrial dynamics failure and ER stress, while improving the endogenous cellular antioxidant defenses. Interestingly, nortropane alkaloids efficiently prevented the hyperglycaemia-mediated inflammatory response, as evidenced by the regulation of the pro- and anti-inflammatory response in HuASCs cells. Finally, we evidenced that calystegines may exert their protective effect on HuASCs cells metabolic functions through the restoration of the defective PI3K/AKT/mTOR pathway. Overall, the present investigation demonstrated that calystegines possess important abilities to protect HuASCs against hyperglycaemia-induced cellular dysfunction, and it evidenced that the observed effects are associated to the promotion of PI3K/AKT/mTOR pathway.

Keywords: ER stress; HuASCs; calystegines; hyperglycaemia; inflammation; mTOR.


Conflict of interest statement

The authors declare no conflict of interest.

Figures

Figure 1
Figure 1
GC-MS chromatogram of Hyoscyamus albus seeds calystegines. Ions were monitorised in SIM. A total of 217 m/z was used as a common ion for calystegines B2, B3 and B4; 229 m/z for calystegine B2; 244 m/z for calystegine B4; 189 m/z for calystegine B1, 156 m/z for calystegines A3 and A5; 390 m/z for calystegine N1. Octadecan (C18H38, 71 m/z) was used as an internal standard [24].
Figure 2
Figure 2
Biocompatibility assessment of total calystegines extract on HuASCs cells. (a) Histograms depicting the average absorbance at 600 nm of the metabolised Resazurin dye. (b) Average absorbances of incorporated BrdU into newly synthesised DNA of treated HuASCs cells. Representative data from three independent experiments are shown ± SD (n = 3). An asterisk (*) indicates a comparison of treated groups to untreated healthy cells. * p < 0.05, ** p < 0.01.
Figure 3
Figure 3
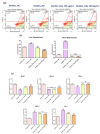
Pro-survival effect of total calystegine extract on HuASCs cells cultured under hyperglycemic conditions. (a) Histograms depicting the average absorbance at 600 nm of the metabolised Resazurin dye. (b) Average absorbances of incorporated BrdU into newly synthesised DNA of treated HuASCs cells. (c) Representative apoptosis dot plots from flow cytometry analysis. (d) Quantitative estimation of Annexin V/7-AAD positive and negative cells. (e) Relative gene expression quantitation of main apoptosis–associated marker levels. (f) Relative gene expression representation of different caspase transcripts. Representative data from three independent experiments are shown ± SD (n = 3). An asterisk (*) indicates a comparison of the HG group to untreated healthy cells. A hashtag (#) indicates a comparison of the HG group pre-treated with calystegines to the HG untreated healthy cells. */# p < 0.05, **/## p < 0.01, ***/### p < 0.001. HuASCs_HE: human ASCs healthy untreated cells; HuASCs_HG: Hyperglycaemic human ASCs cells exposed to a high concentration of glucose. HuASCs_Caly 125 µg/mL: Hyperglycaemic human ASCs cells pre-treated with 125 μg/mL calystegines extracted and exposed to a high concentration of glucose. HuASCs_Caly 250 µg/mL: Hyperglycaemic human ASCs cells pre-treated with 250 μg/mL calystegines extracted and exposed to a high concentration of glucose.
Figure 3
Figure 3
Pro-survival effect of total calystegine extract on HuASCs cells cultured under hyperglycemic conditions. (a) Histograms depicting the average absorbance at 600 nm of the metabolised Resazurin dye. (b) Average absorbances of incorporated BrdU into newly synthesised DNA of treated HuASCs cells. (c) Representative apoptosis dot plots from flow cytometry analysis. (d) Quantitative estimation of Annexin V/7-AAD positive and negative cells. (e) Relative gene expression quantitation of main apoptosis–associated marker levels. (f) Relative gene expression representation of different caspase transcripts. Representative data from three independent experiments are shown ± SD (n = 3). An asterisk (*) indicates a comparison of the HG group to untreated healthy cells. A hashtag (#) indicates a comparison of the HG group pre-treated with calystegines to the HG untreated healthy cells. */# p < 0.05, **/## p < 0.01, ***/### p < 0.001. HuASCs_HE: human ASCs healthy untreated cells; HuASCs_HG: Hyperglycaemic human ASCs cells exposed to a high concentration of glucose. HuASCs_Caly 125 µg/mL: Hyperglycaemic human ASCs cells pre-treated with 125 μg/mL calystegines extracted and exposed to a high concentration of glucose. HuASCs_Caly 250 µg/mL: Hyperglycaemic human ASCs cells pre-treated with 250 μg/mL calystegines extracted and exposed to a high concentration of glucose.
Figure 4
Figure 4
Antioxidant effect of total calystegine extract on HuASCs cells cultured under hyperglycaemic conditions. (a) Representative dot plots for ROS-/ROS+ cells distribution. (b) Histograms depicting average ROS positive cells. (c) Relative gene expression average of endogenous antioxidant enzymes transcripts. (d) SOD and CAT enzymatic activities. Representative data from three independent experiments are shown ± SD (n = 3). An asterisk (*) indicates a comparison of the HG group to untreated healthy cells. A hashtag (#) indicates a comparison of the HG group pre-treated with calystegines to the HG untreated healthy cells. */# p < 0.05, **/## p < 0.01, ***/### p < 0.001. HuASCs_HE: human ASCs healthy untreated cells; HuASCs_HG: hyperglycaemic human ASCs cells exposed to a high concentration of glucose. HuASCs_Caly 125 µg/mL: hyperglycaemic human ASCs cells pre-treated with 125 μg/mL calystegines extracted and exposed to a high concentration of glucose. HuASCs_Caly 250 µg/mL: hyperglycaemic human ASCs cells pre-treated with 250 μg/mL calystegines extracted and exposed to a high concentration of glucose.
Figure 4
Figure 4
Antioxidant effect of total calystegine extract on HuASCs cells cultured under hyperglycaemic conditions. (a) Representative dot plots for ROS-/ROS+ cells distribution. (b) Histograms depicting average ROS positive cells. (c) Relative gene expression average of endogenous antioxidant enzymes transcripts. (d) SOD and CAT enzymatic activities. Representative data from three independent experiments are shown ± SD (n = 3). An asterisk (*) indicates a comparison of the HG group to untreated healthy cells. A hashtag (#) indicates a comparison of the HG group pre-treated with calystegines to the HG untreated healthy cells. */# p < 0.05, **/## p < 0.01, ***/### p < 0.001. HuASCs_HE: human ASCs healthy untreated cells; HuASCs_HG: hyperglycaemic human ASCs cells exposed to a high concentration of glucose. HuASCs_Caly 125 µg/mL: hyperglycaemic human ASCs cells pre-treated with 125 μg/mL calystegines extracted and exposed to a high concentration of glucose. HuASCs_Caly 250 µg/mL: hyperglycaemic human ASCs cells pre-treated with 250 μg/mL calystegines extracted and exposed to a high concentration of glucose.
Figure 5
Figure 5
Beneficial effects of total calystegine extract on abnormal mitochondrial dynamics in HuASCs cells cultured under hyperglycaemic conditions. (a) Representative dot plots for MUSE MitoPotential analysis. (b) Percentage of live and dead cells exhibiting depolarized mitochondria. (c) Relative gene expression of mitochondrial fusion and fission associated genes. (d) Epi-fluorescent confocal microscope micrographs of MitoRed stained cells; scale bar size 18 μm. Representative data from three independent experiments are shown ± SD (n = 3). An asterisk (*) indicates a comparison of the HG group to the untreated healthy cells. A hashtag (#) indicates a comparison of HG group pre-treated with calystegines to the HG untreated healthy cells. */# p < 0.05, **/## p < 0.01, ***/### p < 0.001. HuASCs_HE: human ASCs healthy untreated cells; HuASCs_HG: hyperglycaemic human ASCs cells exposed to a high concentration of glucose. HuASCs_Caly 125 µg/mL: hyperglycaemic human ASCs cells pre-treated with 125 μg/mL calystegines extracted and exposed to a high concentration of glucose. HuASCs_Caly 250 µg/mL: hyperglycaemic human ASCs cells pre-treated with 250 μg/mL calystegines extracted and exposed to a high concentration of glucose.
Figure 5
Figure 5
Beneficial effects of total calystegine extract on abnormal mitochondrial dynamics in HuASCs cells cultured under hyperglycaemic conditions. (a) Representative dot plots for MUSE MitoPotential analysis. (b) Percentage of live and dead cells exhibiting depolarized mitochondria. (c) Relative gene expression of mitochondrial fusion and fission associated genes. (d) Epi-fluorescent confocal microscope micrographs of MitoRed stained cells; scale bar size 18 μm. Representative data from three independent experiments are shown ± SD (n = 3). An asterisk (*) indicates a comparison of the HG group to the untreated healthy cells. A hashtag (#) indicates a comparison of HG group pre-treated with calystegines to the HG untreated healthy cells. */# p < 0.05, **/## p < 0.01, ***/### p < 0.001. HuASCs_HE: human ASCs healthy untreated cells; HuASCs_HG: hyperglycaemic human ASCs cells exposed to a high concentration of glucose. HuASCs_Caly 125 µg/mL: hyperglycaemic human ASCs cells pre-treated with 125 μg/mL calystegines extracted and exposed to a high concentration of glucose. HuASCs_Caly 250 µg/mL: hyperglycaemic human ASCs cells pre-treated with 250 μg/mL calystegines extracted and exposed to a high concentration of glucose.
Figure 6
Figure 6
Preventive effect of total calystegines extract on ER stress engagement in HuASCs cells cultured in a hyperglycaemic milieu. Relative gene expression of ER stress master sensors and effectors. Representative data from three independent experiments are shown ± SD (n = 3). An asterisk (*) indicates a comparison of the HG group to the untreated healthy cells. A hashtag (#) indicates a comparison of the HG group pre-treated with calystegines to the HG untreated healthy cells. */# p < 0.05, **/## p < 0.01, ***/### p < 0.001. HuASCs_HE: human ASCs healthy untreated cells; HuASCs_HG: hyperglycaemic human ASCs cells exposed to a high concentration of glucose. HuASCs_Caly 125 µg/mL: hyperglycaemic human ASCs cells pre-treated with 125 μg/mL calystegines extracted and exposed to a high concentration of glucose. HuASCs_Caly 250 µg/mL: hyperglycaemic human ASCs cells pre-treated with 250 μg/mL calystegines extracted and exposed to a high concentration of glucose.
Figure 7
Figure 7
Reducing effect of total calystegine extract on hyperglycemia-mediated inflammatory response in HuASCs cells. (a) Histograms summarising the relative gene expression of key pro-inflammatory cytokines. (b) Representation of normalized gene expression of main anti-inflammatory markers. (c) ELISA quantification results of IL-1β and TNF-α proteins levels. Representative data from three independent experiments are shown ± SD (n  =  3). An asterisk (*) indicates a comparison of the HG group to the untreated healthy cells. A hashtag (#) indicates a comparison of HG group pre-treated with calystegines to HG untreated healthy cells. */# p < 0.05, **/## p < 0.01, ***/### p < 0.001. HuASCs_HE: human ASCs healthy untreated cells; HuASCs_HG: hyperglycaemic human ASCs cells exposed to a high concentration of glucose. HuASCs_Caly 125 µg/mL: hyperglycaemic human ASCs cells pre-treated with 125 μg/mL calystegines extracted and exposed to a high concentration of glucose. HuASCs_Caly 250 µg/mL: hyperglycaemic human ASCs cells pre-treated with 250 μg/mL calystegines extracted and exposed to a high concentration of glucose.
Figure 7
Figure 7
Reducing effect of total calystegine extract on hyperglycemia-mediated inflammatory response in HuASCs cells. (a) Histograms summarising the relative gene expression of key pro-inflammatory cytokines. (b) Representation of normalized gene expression of main anti-inflammatory markers. (c) ELISA quantification results of IL-1β and TNF-α proteins levels. Representative data from three independent experiments are shown ± SD (n  =  3). An asterisk (*) indicates a comparison of the HG group to the untreated healthy cells. A hashtag (#) indicates a comparison of HG group pre-treated with calystegines to HG untreated healthy cells. */# p < 0.05, **/## p < 0.01, ***/### p < 0.001. HuASCs_HE: human ASCs healthy untreated cells; HuASCs_HG: hyperglycaemic human ASCs cells exposed to a high concentration of glucose. HuASCs_Caly 125 µg/mL: hyperglycaemic human ASCs cells pre-treated with 125 μg/mL calystegines extracted and exposed to a high concentration of glucose. HuASCs_Caly 250 µg/mL: hyperglycaemic human ASCs cells pre-treated with 250 μg/mL calystegines extracted and exposed to a high concentration of glucose.
Figure 8
Figure 8
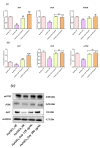
Promoting effect of total calystegine extract on hyperglycemia-mediated Akt/Pi3K/mTOR signaling pathway failure in HuASCs cells. (a) Histograms summarizing the relative gene expression of AKT, PI3K and MTOR mRNAs. (b) Relative Akt, Pi3K and mTOR protein expression levels normalized to GAPDH housekeeping protein and evaluated using western blot. (c) Representative immunoblots for each assayed protein detected by chemiluminescence. Representative data from three independent experiments are shown  ±  SD (n  =  3). An asterisk (*) indicates a comparison of the HG group to the untreated healthy cells. A hashtag (#) indicates a comparison of the HG group pre-treated with calystegines to the HG untreated healthy cells. */# p < 0.05, ** p < 0.01, ***/### p < 0.001. HuASCs_HE: Human ASCs healthy untreated cells; HuASCs_HG: hyperglycaemic human ASCs cells exposed to a high concentration of glucose. HuASCs_Caly 125 µg/mL: hyperglycaemic human ASCs cells pre-treated with 125 μg/mL calystegines extracted and exposed to a high concentration of glucose. HuASCs_Caly 250 µg/mL: hyperglycaemic human ASCs cells pre-treated with 250 μg/mL calystegines extracted and exposed to a high concentration of glucose.

Similar articles

Cited by

References

    1. Olokoba A.B., Obateru O.A., Olokoba L.B. Type 2 Diabetes Mellitus: A Review of Current Trends. Oman Med. J. 2012;27:269–273. doi: 10.5001/omj.2012.68. - DOI - PMC - PubMed
    1. Kharroubi A.T., Darwish H.M. Diabetes mellitus: The epidemic of the century. World J. Diabetes. 2015;6:850–867. doi: 10.4239/wjd.v6.i6.850. - DOI - PMC - PubMed
    1. Yan L.-J. Pathogenesis of Chronic Hyperglycemia: From Reductive Stress to Oxidative Stress. J. Diabetes Res. 2014;2014:137919. doi: 10.1155/2014/137919. - DOI - PMC - PubMed
    1. Santilli F., D’Ardes D., Davì G. Oxidative stress in chronic vascular disease: From prediction to prevention. Vascul. Pharmacol. 2015;74:23–37. doi: 10.1016/j.vph.2015.09.003. - DOI - PubMed
    1. Sheikh-Ali M., Sultan S., Alamir A.-R., Haas M.J., Mooradian A.D. Hyperglycemia-induced endoplasmic reticulum stress in endothelial cells. Nutre. 2010;26:1146–1150. doi: 10.1016/j.nut.2009.08.019. - DOI - PubMed

MeSH terms