. 2022 Mar 17;12(3):464.
doi: 10.3390/biom12030464.

Transcriptomic Biomarker Signatures for Discrimination of Oral Cancer Surgical Margins

Affiliations

Transcriptomic Biomarker Signatures for Discrimination of Oral Cancer Surgical Margins

Simon A Fox et al. Biomolecules. .

Abstract

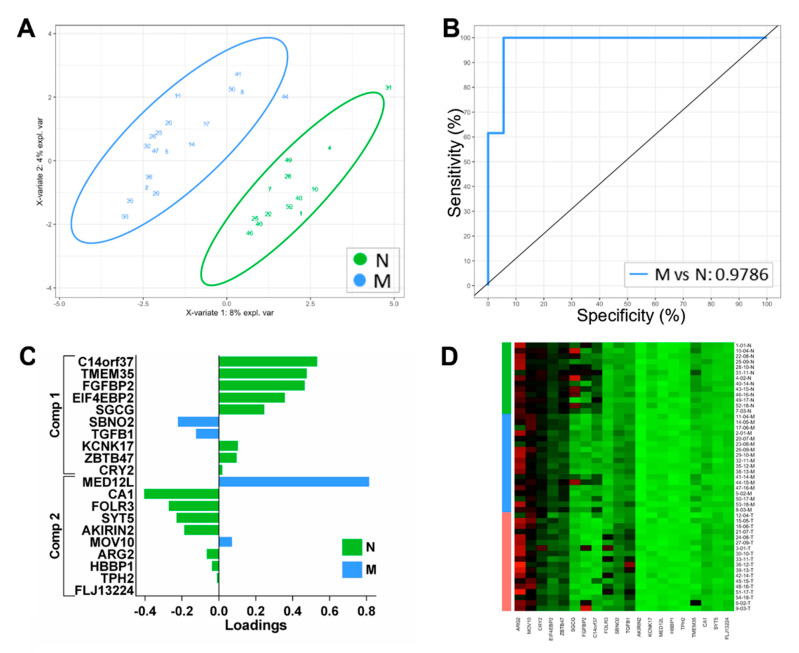
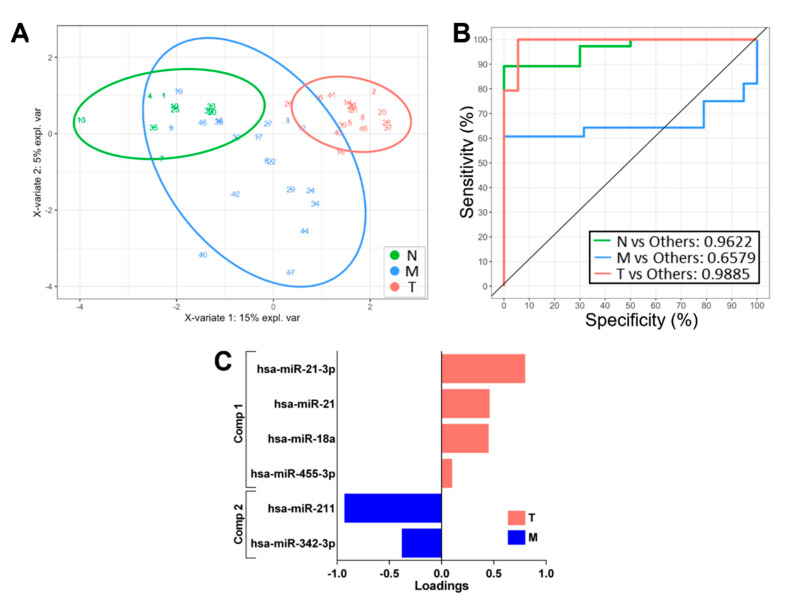
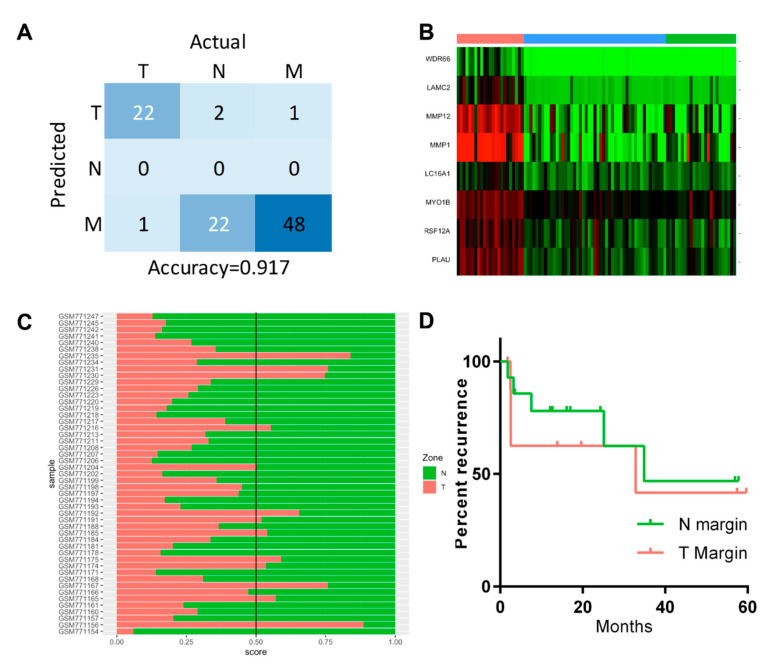
Relapse after surgery for oral squamous cell carcinoma (OSCC) contributes significantly to morbidity, mortality and poor outcomes. The current histopathological diagnostic techniques are insufficiently sensitive for the detection of oral cancer and minimal residual disease in surgical margins. We used whole-transcriptome gene expression and small noncoding RNA profiles from tumour, close margin and distant margin biopsies from 18 patients undergoing surgical resection for OSCC. By applying multivariate regression algorithms (sPLS-DA) suitable for higher dimension data, we objectively identified biomarker signatures for tumour and marginal tissue zones. We were able to define molecular signatures that discriminated tumours from the marginal zones and between the close and distant margins. These signatures included genes not previously associated with OSCC, such as MAMDC2, SYNPO2 and ARMH4. For discrimination of the normal and tumour sampling zones, we were able to derive an effective gene-based classifying model for molecular abnormality based on a panel of eight genes (MMP1, MMP12, MYO1B, TNFRSF12A, WDR66, LAMC2, SLC16A1 and PLAU). We demonstrated the classification performance of these gene signatures in an independent validation dataset of OSCC tumour and marginal gene expression profiles. These biomarker signatures may contribute to the earlier detection of tumour cells and complement existing surgical and histopathological techniques used to determine clear surgical margins.

Keywords: gene biomarker signature; gene expression profiling; multivariate statistics; oral squamous cell carcinoma; surgical margins.


Conflict of interest statement

The authors declare no conflict of interest.

Figures

Figure 1
Figure 1
Classification performance sPLS-DA-derived gene expression signatures on all sample groups: N vs. M vs. T. (A) Two-dimensional sample plots for the multinomial classifier for 3 groups with confidence ellipse plots. (B) Corresponding ROC curves. (C) Loading plots for multinomial N vs. M vs. T classifiers showing the contribution of each gene to the signature. (D) Heatmap of the gene expression across all samples for the multinomial N vs. M vs. T classifiers.
Figure 2
Figure 2
Classification performance sPLS-DA-derived gene expression signatures for binomial comparison: N vs. M. (A) Two-dimensional sample plots for the 2 groups with confidence ellipse plots. (B) Corresponding ROC curve. (C) Loading plots for N vs. M classifiers showing the contribution of each gene to the signature. (D) Heatmap of the gene expression across all samples for the N vs. M classifiers.
Figure 3
Figure 3
Classification performance of a sPLS-DA-derived miRNA expression signature. (A) Two-dimensional sample plots for the 3 groups with confidence ellipse plots. (B) Corresponding ROC curve. (C) Loading plots for multinomial N vs. M vs. T classifiers showing the contribution of each miRNA to the signature.
Figure 4
Figure 4
Classification performance of sparse Partial Least-Squares Discriminant Analysis-derived gene signatures for tumour vs. normal (T vs. N) using genes upregulated in tumours. (A) Loading plot of a discriminating gene panel. (B) ROC curve for tumour vs. normal discrimination. (C) Prediction score plot for the prediction of margins classed as T or N. (D) Heatmap of gene expression for the T vs. N gene models in all the samples.
Figure 5
Figure 5
Testing sPLS-DA models in the validation data. (A) Confusion matrix of 3 zone predictions of the validation dataset using the classifiers from Figure 1. (B) Heatmap of the expression of T vs. N prediction model classifiers in the validation dataset. (C) Prediction score plot of the validation margins using the binary classifier for T vs. N in the validation data. (D) Survival plot for tumour recurrence for patients with primary margins predicted as T or N.

References

    1. Gupta B., Johnson N.W., Kumar N. Global Epidemiology of Head and Neck Cancers: A Continuing Challenge. Oncology. 2016;91:13–23. doi: 10.1159/000446117. - DOI - PubMed
    1. Cronin K.A., Lake A.J., Scott S., Sherman R.L., Noone A.M., Howlader N., Henley S.J., Anderson R.N., Firth A.U., Ma J., et al. Annual Report to the Nation on the Status of Cancer, Part I: National Cancer Statistics. Cancer. 2018;124:2785–2800. doi: 10.1002/cncr.31551. - DOI - PMC - PubMed
    1. Gatta G., Botta L., Sánchez M.J., Anderson L.A., Pierannunzio D., Licitra L., on behalf of the EUROCARE Working Group Prognoses and Improvement for Head and Neck Cancers Diagnosed in Europe in Early 2000s: The EUROCARE-5 Population-Based Study. Eur. J. Cancer. 2015;51:2130–2143. doi: 10.1016/j.ejca.2015.07.043. - DOI - PubMed
    1. Binahmed A., Nason R.W., Abdoh A.A. The Clinical Significance of the Positive Surgical Margin in Oral Cancer. Oral Oncol. 2007;43:780–784. doi: 10.1016/j.oraloncology.2006.10.001. - DOI - PubMed
    1. González-García R., Naval-Gías L., Román-Romero L., Sastre-Pérez J., Rodríguez-Campo F.J. Local Recurrences and Second Primary Tumors from Squamous Cell Carcinoma of the Oral Cavity: A Retrospective Analytic Study of 500 Patients. Head Neck. 2009;31:1168–1180. doi: 10.1002/hed.21088. - DOI - PubMed

Publication types

MeSH terms