. 2022 Feb 23;24(3):314.
doi: 10.3390/e24030314.

Multiscale Weighted Permutation Entropy Analysis of Schizophrenia Magnetoencephalograms

Affiliations

Multiscale Weighted Permutation Entropy Analysis of Schizophrenia Magnetoencephalograms

Dengxuan Bai et al. Entropy (Basel). .

Abstract

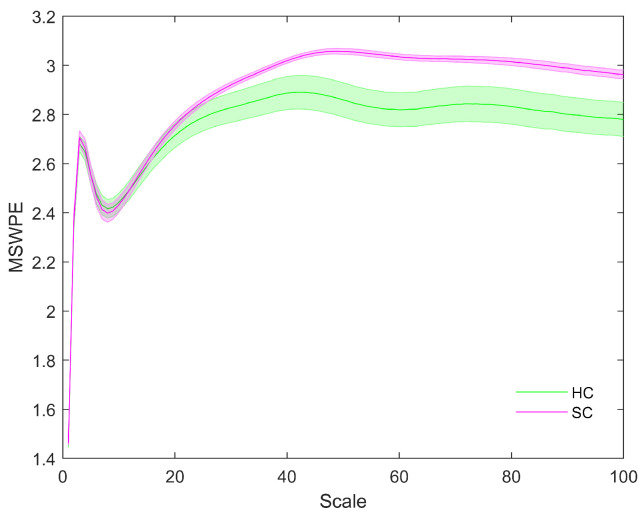
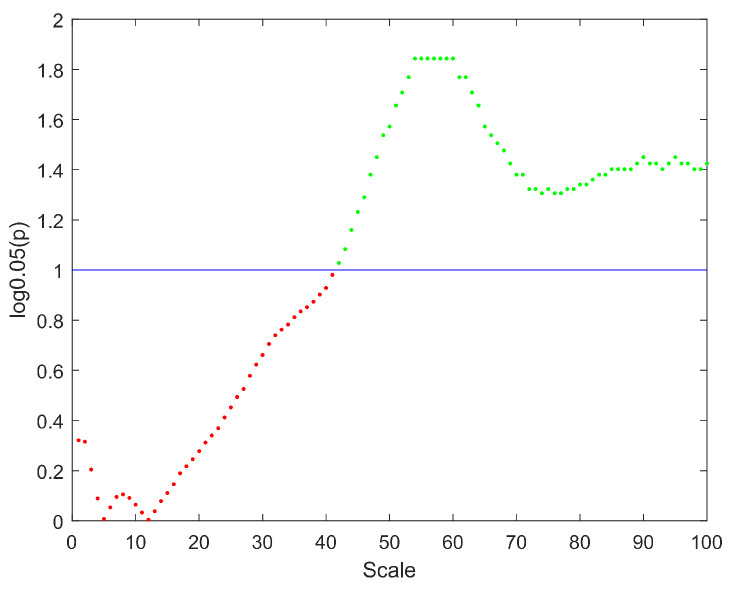
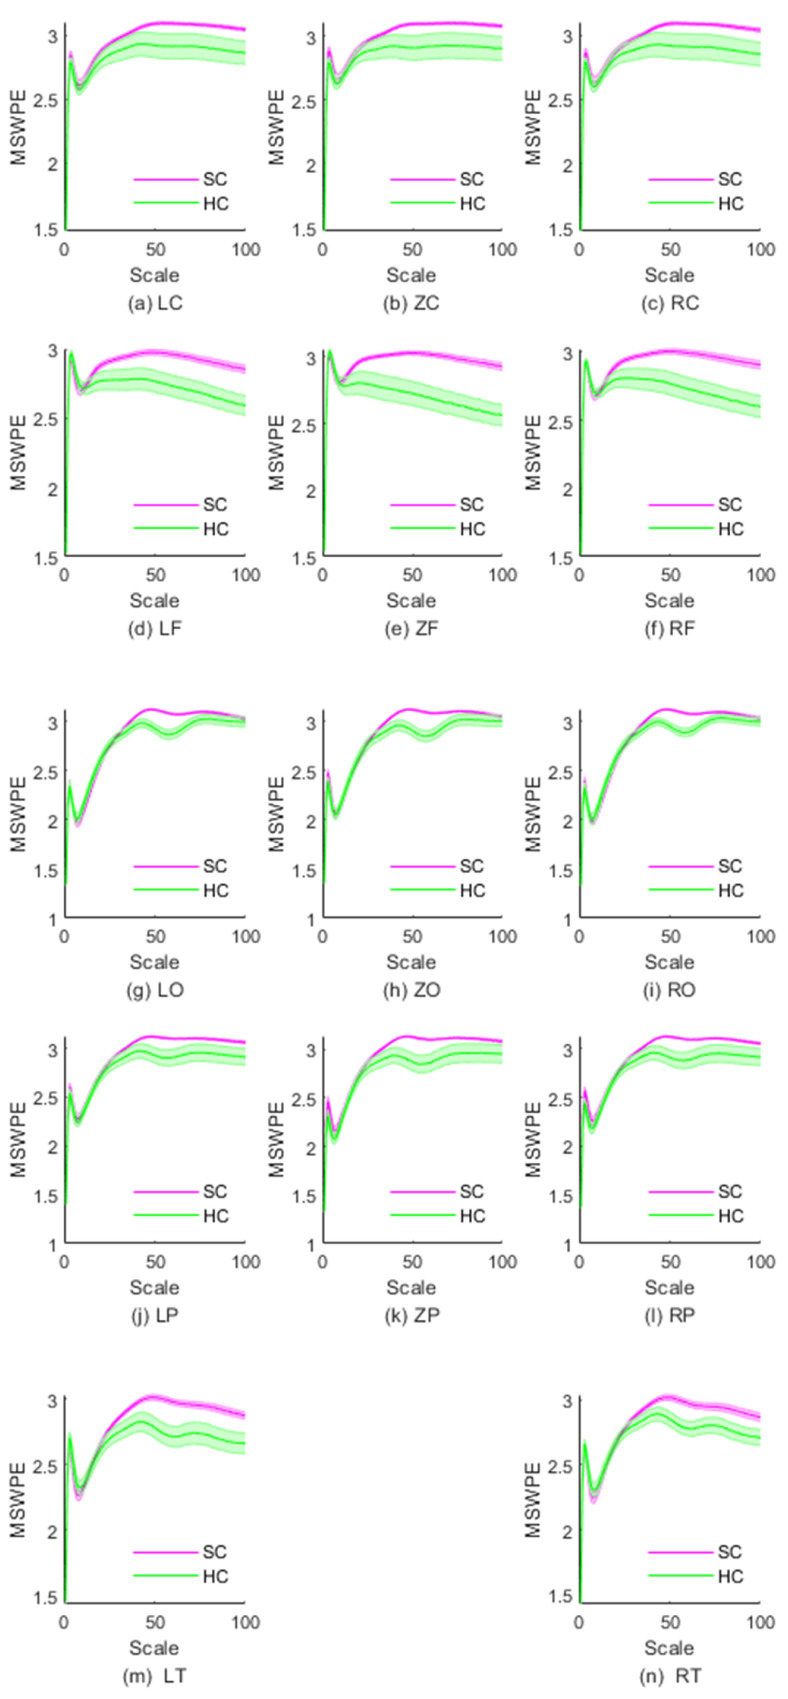
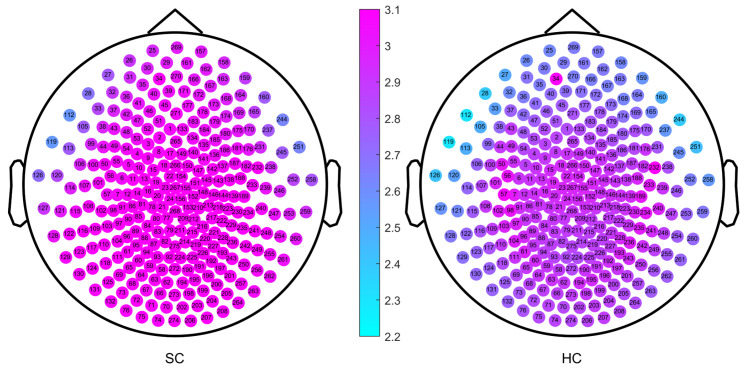
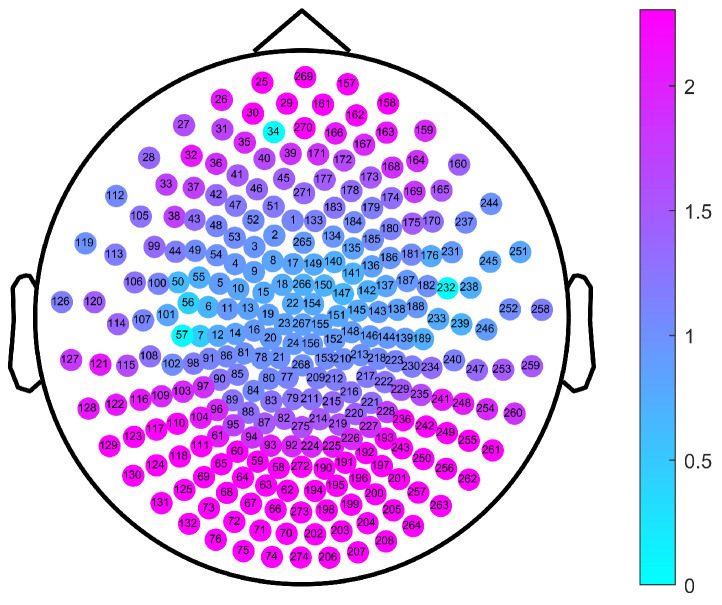
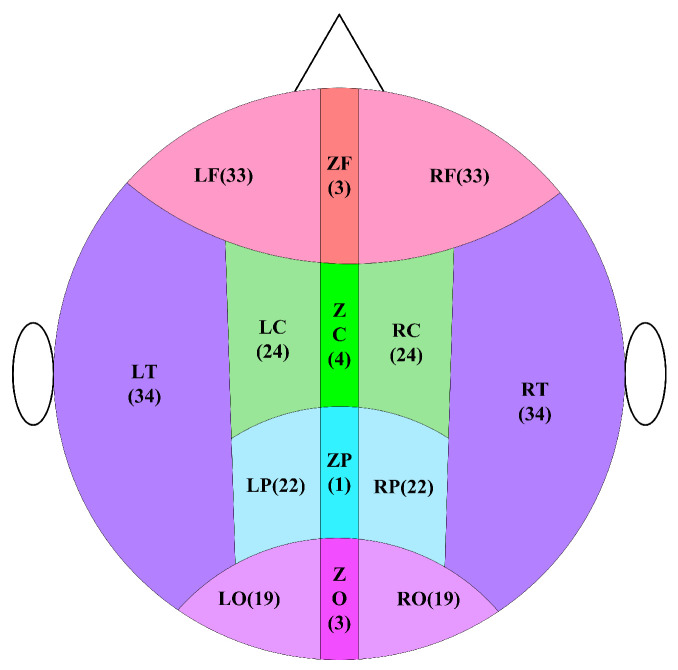
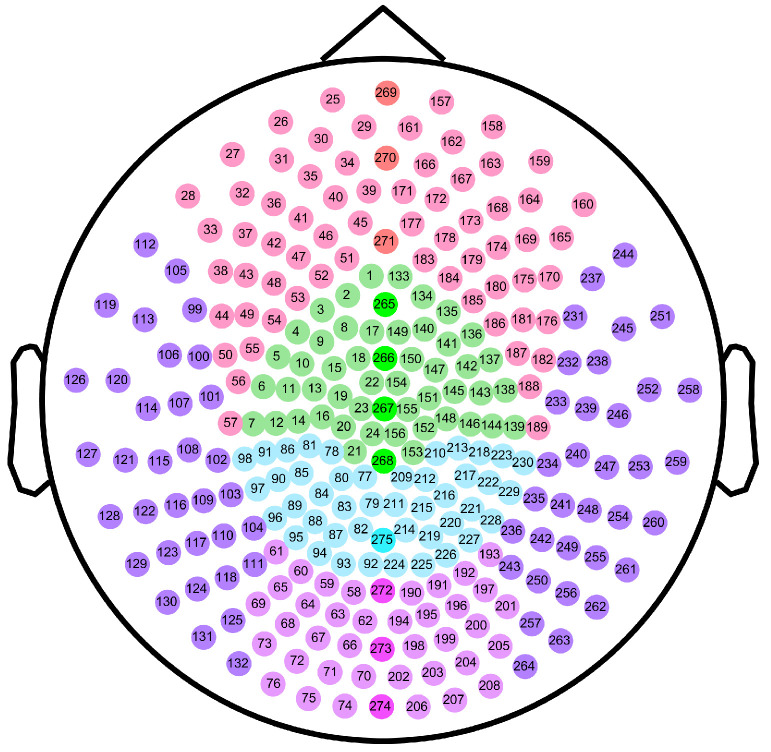
Schizophrenia is a neuropsychiatric disease that affects the nonlinear dynamics of brain activity. The primary objective of this study was to explore the complexity of magnetoencephalograms (MEG) in patients with schizophrenia. We combined a multiscale method and weighted permutation entropy to characterize MEG signals from 19 schizophrenia patients and 16 healthy controls. When the scale was larger than 42, the MEG signals of schizophrenia patients were significantly more complex than those of healthy controls (p<0.004). The difference in complexity between patients with schizophrenia and the controls was strongest in the frontal and occipital areas (p<0.001), and there was almost no difference in the central area. In addition, the results showed that the dynamic range of MEG complexity is wider in healthy individuals than in people with schizophrenia. Overall, the multiscale weighted permutation entropy method reliably quantified the complexity of MEG from schizophrenia patients, contributing to the development of potential magnetoencephalographic biomarkers for schizophrenia.

Keywords: magnetoencephalogram; multiscale; schizophrenia; weighted permutation entropy.


Conflict of interest statement

The authors declare no competing interest.

Figures

Figure 1
Figure 1
The MSWPE values (means ± standard errors) of the patients and the controls at different scales. HC in the legend represents the controls, and SC indicates the patients. The colored lines imply the mean MSWPE values in the two groups, and their shading signifies the standard error.
Figure 2
Figure 2
The distribution of p values at different scales. The y-axis represents the logarithm of p with base 0.05. The straight blue line implies the significance threshold of y=1. The scale factors without significant difference are denoted by red points, and the scale factors with significant difference are represented by green points.
Figure 3
Figure 3
The MSWPE values (means ± standard errors) of different brain regions in SC and HC under different scale factors. HC denotes the healthy controls, and SC represents the patients with schizophrenia.
Figure 4
Figure 4
The MSWPE value distribution diagram of each channel in the patients and the controls under a scale factor of 57. HC denotes the healthy controls, and SC represents the patients with schizophrenia.
Figure 5
Figure 5
The p value distribution of channels for a comparison between the patients and the controls under a scale factor of 57. The color of the note represents the logarithm values of p with base 0.05.
Figure 6
Figure 6
Schematic diagram of brain division. In the figure, the letter C represents the central area, the letter F means the frontal area, the letter O implies the occipital area, the letter P indicates the parietal area, and the letter T denotes the temporal area. In the subdivision of areas, the letter L signifies the left, the letter Z represents the middle, and the letter R defines the right. The number indicates the number of channels.
Figure 7
Figure 7
Schematic diagram of channel distribution in each brain area. The dots in the figure represent the channels of the Canadian CTF/VSM 275-channel full-head MEG system. The color of each dot indicates the brain area where the channel is located. The numbers represent our labels for the individual channels.

Similar articles

Cited by

References

    1. World Health Organization Schizophrenia. January 2022. [(accessed on 2 February 2022)]. Available online: https://www.who.int/news-room/fact-sheets/detail/schizophrenia.
    1. Xu T., Stephane M., Parhi K.K. Abnormal neural oscillations in schizophrenia assessed by spectral power ratio of MEG during word processing. IEEE Trans. Neural Syst. Rehabil. Eng. 2016;24:1148–1158. doi: 10.1109/TNSRE.2016.2551700. - DOI - PubMed
    1. Wang M., Huang T.Z., Fang J., Calhoun V.D., Wang Y.P. Integration of imaging (epi) genomics data for the study of schizophrenia using group sparse joint nonnegative matrix factorization. IEEE/ACM Trans. Comput. Biol. Bioinform. 2019;17:1671–1681. doi: 10.1109/TCBB.2019.2899568. - DOI - PMC - PubMed
    1. McCutcheon R.A., Marques T.R., Howes O.D. Schizophrenia—An overview. JAMA Psychiatry. 2020;77:201–210. doi: 10.1001/jamapsychiatry.2019.3360. - DOI - PubMed
    1. NIMH.Schizophrenia. Last Revised: May 2020. [(accessed on 2 February 2022)]; Available online: https://www.nimh.nih.gov/health/topics/schizophrenia/

LinkOut - more resources