Review
. 2022 Mar 10;24(3):389.
doi: 10.3390/e24030389.

T-cell Receptor Is a Threshold Detector: Sub- and Supra-Threshold Stochastic Resonance in TCR-MHC Clusters on the Cell Surface

Affiliations
Review

T-cell Receptor Is a Threshold Detector: Sub- and Supra-Threshold Stochastic Resonance in TCR-MHC Clusters on the Cell Surface

László Bene et al. Entropy (Basel). .

Abstract

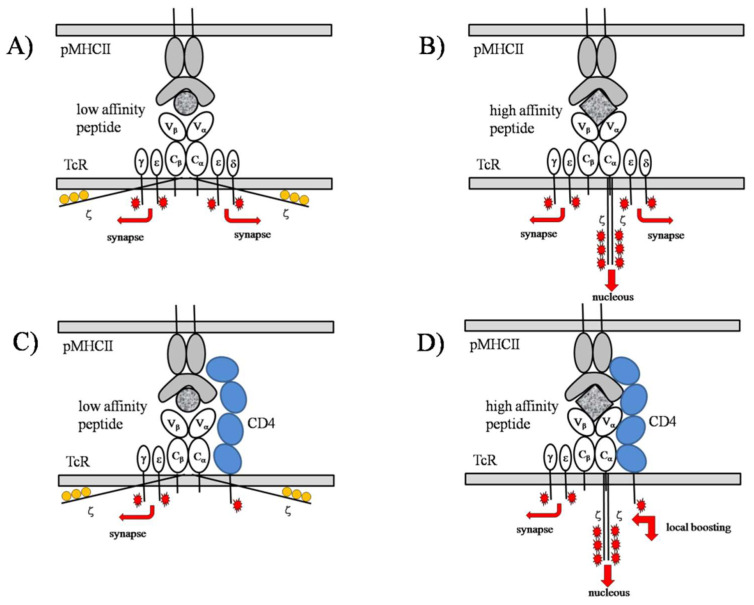
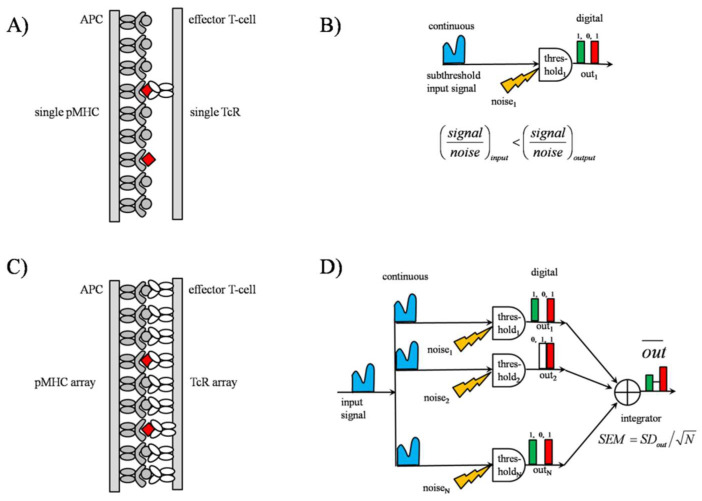
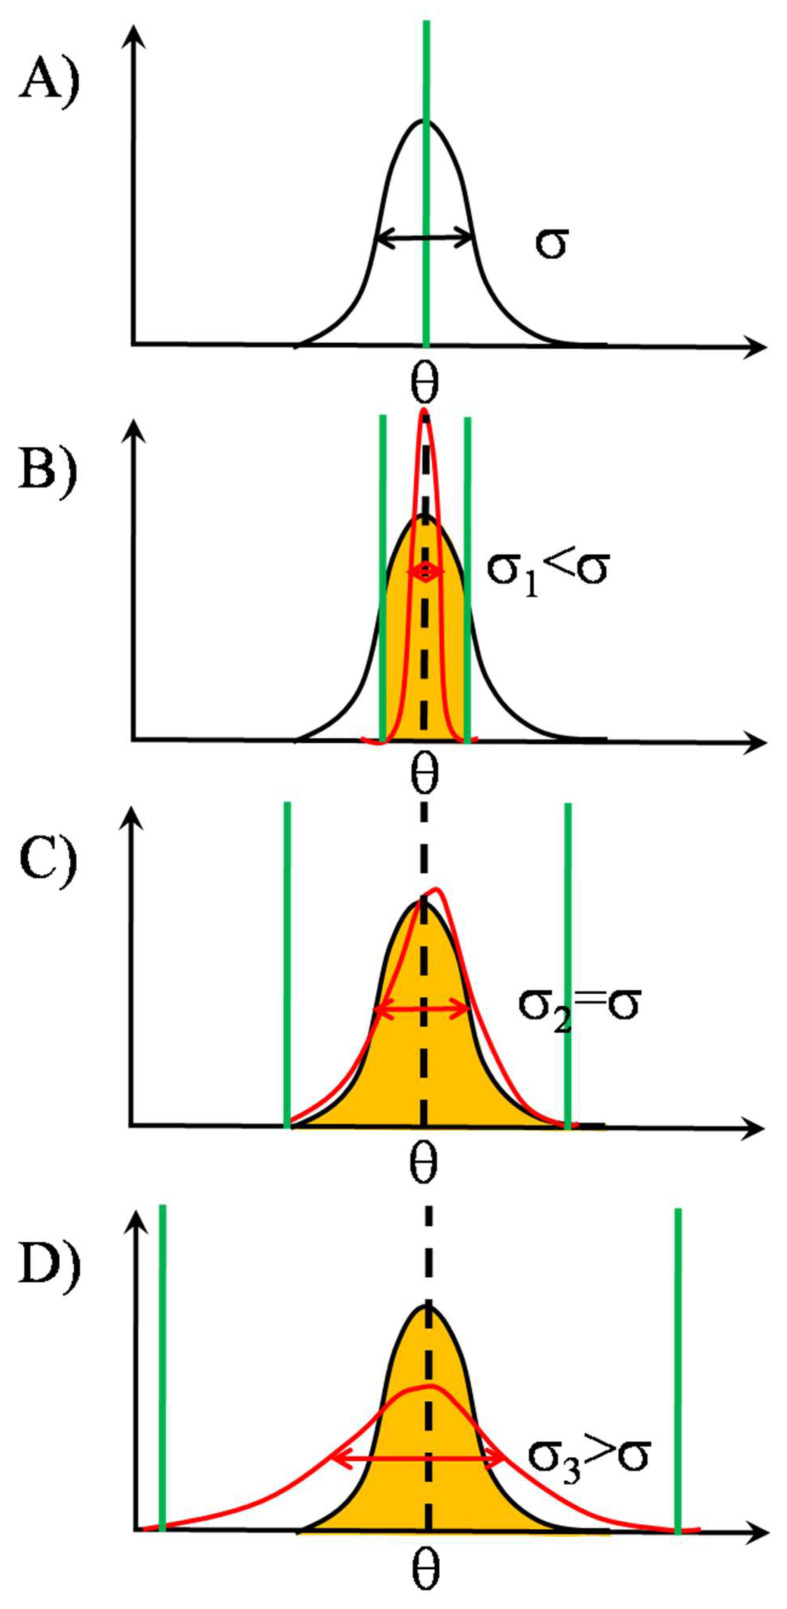
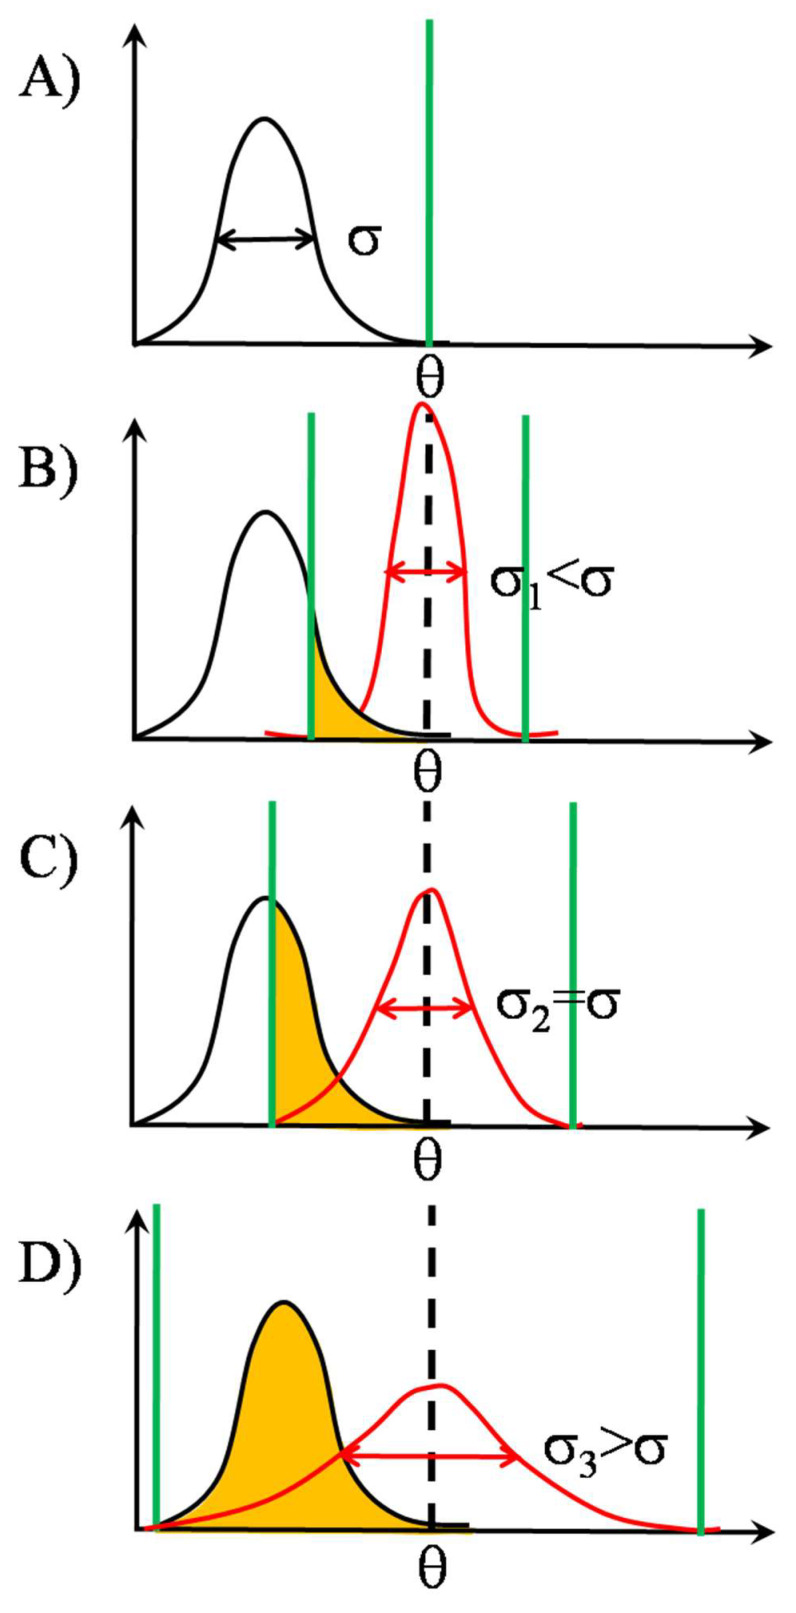
Stochastic resonance in clusters of major histocompatibility molecules is extended by a more detailed description of adaptive thresholding and by applying the notion of suprathreshold stochastic resonance as a stochastically quantizing encoder of transmembrane signaling downstream of major histocompatibility molecules and T-cell receptors on the side of presenting and recognizing cells, respectively. The adaptive nature of thresholding is partly explained by a mirroring of the noncognate-cognate dichotomy shown by the T-cell receptor structure and the kinetic-segregation model of the onset of T-cell receptor triggering. Membrane clusters of major histocompatibility molecules and T-cell receptors on their host cells are envisioned as places of the temporal encoding of downstream signals via the suprathreshold stochastic resonance process. The ways of optimization of molecular prostheses, such as chimeric antigen receptors against cancer in transmembrane signaling, are suggested in the framework of suprathreshold stochastic resonance. The analogy between Förster resonance energy transfer and suprathreshold stochastic resonance for information transfer is also discussed. The overlap integral for energy transfer parallels the mutual information transferred by suprathreshold stochastic resonance.

Keywords: CD8/CD4; Förster resonance energy transfer (FRET); MHCI/MHCII; TCR; chimeric antigen receptor (CAR) optimization; correlation; distributed signal detection; mutual information; noncognate–cognate discrimination; pattern recognition.


Conflict of interest statement

The authors declare no conflict of interest. The funders had no role in the design of the study; in the collection, analyses, or interpretation of data; in the writing of the manuscript, or in the decision to publish the results.

Figures

Figure 1
Figure 1
TCR structure mirrors noncognate–cognate dichotomy. Structural proof that TCR is a threshold detector. Panel A: In the first phase of TCR triggering, TCRs scan the surface of the APC without coreceptors. Panel B: Although in the first phase mainly low-affinity pMHCII bind, sometimes, dictated by the relative abundance, high-affinity or cognate pMHCII (cognate ligand), shaded square, can also bind. Panel C: During the second phase of TCR triggering, TCR scanning happens in the delimited spatial region called the immune synapse (IS), in the presence of a coreceptor (CD4, in blue) in close proximity to TCR. Panel D: In the second phase of TCR triggering, the signaling is mainly due to the binding of high-affinity, cognate pMHCII.
Figure 2
Figure 2
Sub- and supra-threshold SR in TCR triggering. Stochastic pooling network (SPN) model of the TCR array [28,29,30,31,71]. Panel A: Surface scanning by a single TCR. While in the first phase of triggering TCR detects both the noncognate and cognate peptides, in the second phase it detects mainly cognate ones by way of high tuning the threshold with coreceptor (not indicated) proximity. Threshold level has been adjusted based on the first phase detection. Because the threshold level has been adjusted to the net effects of both low- and high-affinity pMHCs, in the second phase, a portion of cognatepMHCs becomes subthreshold. For these pMHCs the subthreshold SR effect might be advantageously exploited to be detected. It is also visualized that for a single detector, the temporal behavior of output signal, red-white-green series of bars, might substantially differ from that of the input signal. Symbols: gray circle, noncognate peptide; red square, cognate peptide. Panel B: Schematic of single TCR scanning. In each moment, at the output a 0 (zero) or 1 (one) is assigned to the input, implying a 1-bit information transfer. Note that signal’s nature has been transformed from a continuous input to a digital output by SR. Panel C: Surface scanning by a TCR array. In the second phase of TCR triggering, although both the noncognate and cognate peptides are interrogated, only the cognate ones enable activating signals. Panel D: The equivalent pooling network model of the TCR array. Note that the signal’s nature has been transformed from a continuous input to a digital output by SSR.
Figure 3
Figure 3
Types of gating with threshold distributions. Mean-threshold gating with centered signal and threshold distributions. Due to noise, the originally single-valued threshold (θ, marked by dashed vertical in black) becomes distributed (Gaussians marked by red colour), in the intervals delimited by the green vertical bars. The portions of signal distributions (Gaussians marked by black colour) affected by the threshold distributions are marked by orange shading. The net degree of influence is represented by the overlap regions of the threshold and signal distributions. Information transmission by the TCR array [31]. By opening out the threshold distribution, the intensity of sampling from the left, originally sub-threshold portion of the signal distribution is gradually increased at the cost of decreasing sampling from the right, originally supra-threshold portion. Panel A: Nominal threshold level of individual detectors in the TCR array of Figure 2 is designated by θ. Its position is marked by a vertical green thick line on the horizontal axis of the detected signal, whose distribution is represented as a Gaussian black curve with standard deviation (width parameter) σ. The detected signal can be the affinity of pMHC binding itself or any signal proportional to it, e.g., extent of conformational change in TCR, size or duration of force arisen between TCR and pMHC. Panel B: The action of independent identically distributed random noises on the inputs of the TCR array can be conceived as the nominal threshold θ would be distributed on θ1, θ2, …, θN according to some noise distribution, symbolized by the red curve, with standard deviation σ1. The working function of the TCR array now can be summarized as to take random samples from the signal distribution with the aid of the threshold distribution. The quality of sampling and ultimately that of the information transmission from the signal distribution is dictated by the degree of overlap between the signal and threshold distributions. In Panel B, sampling is performed mainly from the middle of signal distribution corresponding to undersampling, the standard deviation of threshold (σ1) being much smaller than that of signal, σ1 < σ. Panel C: The sampling by noise is optimal, and the transmitted information is the maximal, when the standard deviation of noise (σ2) equals that of signal σ2 = σ. Here, the whole range of signal distribution is sampled, at the cost of reduced sampling from the right portion of the signal distribution. Panel D: Information transmission is also not optimal when the noise distribution is wider than that of signal, σ3 > σ. Here only a portion of the information transmitting capability or “channel capacity” of the TCR array as an information channel is utilized. Equivalently, due to the unnecessarily large width of threshold distribution, sampling density from the range of signal is reduced. From Panels AD also the most important attribute of SSR can be read off, namely, the existence of special noise level, where the transmitted information is maximal, for a given array size.
Figure 4
Figure 4
Types of gating with threshold distributions. Off-centered signal and threshold distributions, case I: signal mean smaller than threshold mean (sub-threshold gating). The effect of increasing noise level when the signal is entirely sub-threshold [31]. Information transmission is gradually improved by opening out the threshold distribution. At the end, although the whole signal range is sampled, the sampling density is reduced due to the shallowing of the threshold distribution. By judging from the shape of the overlap region, the symmetric signal distribution will be skewed to the left after the asymmetric sampling. Panel A: Nominal threshold level of individual detectors in the TCR array of Figure 2 is designated by θ. Its position is marked by a vertical green thick line on the horizontal axis of the detected signal, whose distribution is represented as a Gaussian black curve with standard deviation σ. The signal now is entirely subthreshold, because the whole distribution is located left to θ. Panel B: Upon the action of independent random noises at each input of the TCR array, the nominal threshold θ becomes distributed on θ1, θ2, … θN according to the noise distribution, symbolized by the red curve, with standard deviation σ1. Sampling is performed by the threshold distribution mainly from the right tail of signal distribution, marked by orange shading, corresponding to heavy undersampling, the standard deviation of threshold (σ1) being much smaller than that of signal, σ3 << σ. Panel C: By equalizing the widths of noise and signal distributions, σ2 = σ, sampling becomes better as judged from the larger orange overlap area (half the signal), but yet remaining undersampling. Panel D: Information transmission is the best, when the noise distribution becomes wider c.a. double of that of signal, σ3 = 2σ. Upon a further increase in the width of noise distribution, new empty thresholds left to the signal range tend to appear.
Figure 5
Figure 5
Types of gating with threshold distributions. Off-centered signal and threshold distributions, case II: signal mean larger than threshold mean (suprathreshold gating). The effect of increasing noise level when the signal is entirely suprathreshold [31]. Here only detrimental effects of noise on information transmission can be revealed. By gradually increasing the width of threshold distribution an increasing portion of the originally suprathreshold signal distribution becomes sub-threshold, resulting in a gradual undersampling of the left side of the signal distribution. Panel A: Nominal threshold level of individual detectors in the TCR array of Figure 2 is designated by θ. Its position is marked by a vertical green thick line on the horizontal axis of the detected signal, whose distribution is represented as a Gaussian black curve with standard deviation σ. The signal now is entirely suprathreshold, meaning maximal information transfer, because the whole distribution is right to θ. Panel B: Upon the action of independent random noises at each input of the TCR array, the nominal threshold θ becomes distributed on θ1, θ2, … θN according to the noise distribution, symbolized by the red curve, with standard deviation σ1. Sampling is preferentially performed now by the threshold distribution from the right tail of signal distribution, the complement of the orange shaded area, corresponding to undersampling, the standard deviation of threshold (σ1) being much smaller than that of signal, σ1 << σ. Panel C: By equalizing the widths of noise and signal distributions, σ2 = σ, sampling becomes worse, meaning heavier under-sampling, as judged from the larger orange overlap area (half the signal range). Panel D: Information transmission is the worst, when the width of the noise distribution becomes equal with the double of that of signal, σ3=2·σ.

Similar articles

Cited by

References

    1. Bacsó Z., Bene L., Damjanovich L., Damjanovich S. IFN-γ rearranges membrane topography of MHC-I and ICAM-1 in colon carcinoma cells. Biochem. Biophys. Res. Commun. 2002;290:635–640. doi: 10.1006/bbrc.2001.6246. - DOI - PubMed
    1. Bene L., Bodnár A., Damjanovich S., Vámosi G., Bacsó Z., Aradi J., Berta A., Damjanovich J. Membrane topography of HLA I, HLA II, and ICAM-1 is affected by IFN-γin lipid rafts of uveal melanomas. Biochem. Biophys. Res. Commun. 2004;322:678–683. doi: 10.1016/j.bbrc.2004.07.171. - DOI - PubMed
    1. Bene L., Kanyári Z., Bodnár A., Kappelmayer J., Waldmann T.A., Vámosi G., Damjanovich L. Colorectal carcinoma rearranges cell surface protein topology and density in CD4+ T cells. Biochem. Biophys. Res. Commun. 2007;361:202–207. doi: 10.1016/j.bbrc.2007.07.013. - DOI - PubMed
    1. Damjanovich L., Volkó J., Forgács A., Hohenberger W., Bene L. Crohn’s disease alters MHC-rafts in CD4+ T-cells. Cytom. Part A. 2012;81:149–164. doi: 10.1002/cyto.a.21173. - DOI - PubMed
    1. Damjanovich S., Bene L., Matkó J., Mátyus L., Krasznai Z., Szabó G., Jr., Pieri C., Gáspár R., Jr., Szöllősi J. Two-dimensional receptor patterns in the plasma membrane of cells. A critical evaluation of their identification, origin and information content. Biophys. Chem. 1999;82:99–108. doi: 10.1016/S0301-4622(99)00109-X. - DOI - PubMed