

HNF1A POU Domain Mutations Found in Japanese Liver Cancer Patients Cause Downregulation of HNF4A Promoter Activity with Possible Disruption in Transcription Networks
- PMID: 35327967
- PMCID: PMC8949677
- DOI: 10.3390/genes13030413
HNF1A POU Domain Mutations Found in Japanese Liver Cancer Patients Cause Downregulation of HNF4A Promoter Activity with Possible Disruption in Transcription Networks
Abstract
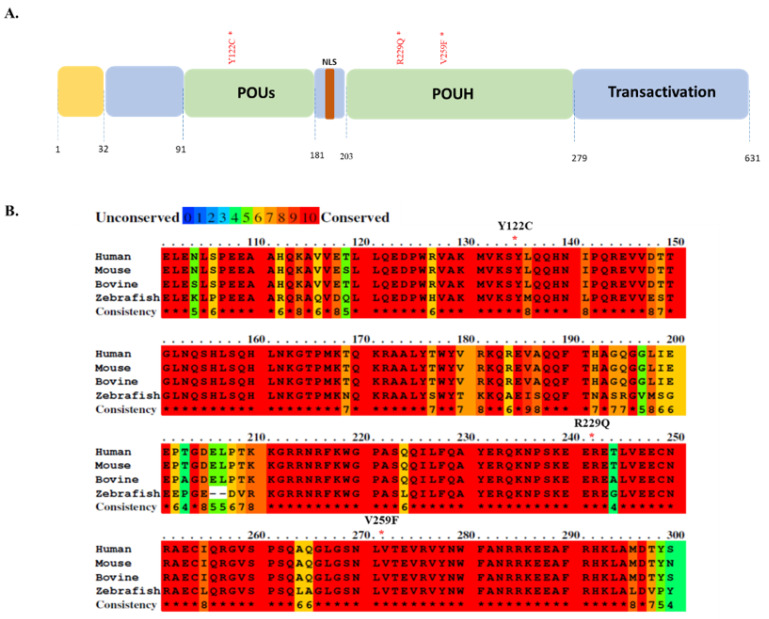
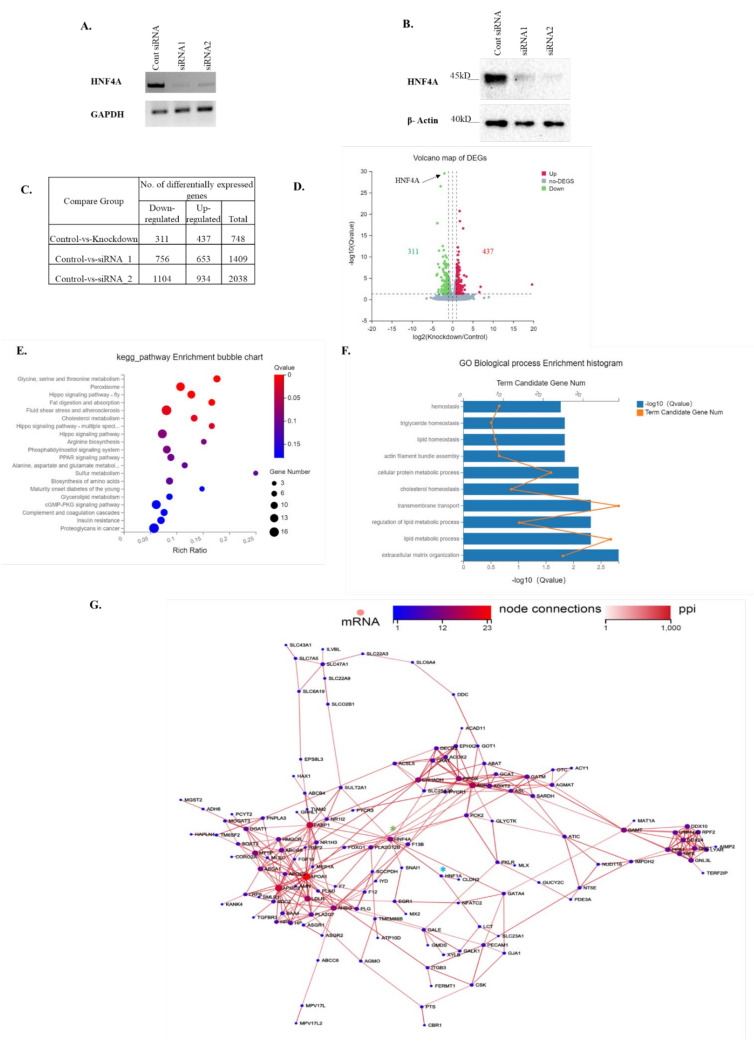
Hepatocyte nuclear factor 1A (HNF1A) is the master regulator of liver homeostasis and organogenesis and regulates many aspects of hepatocyte functions. It acts as a tumor suppressor in the liver, evidenced by the increased proliferation in HNF1A knockout (KO) hepatocytes. Hence, we postulated that any loss-of-function variation in the gene structure or composition (mutation) could trigger dysfunction, including disrupted transcriptional networks in liver cells. From the International Cancer Genome Consortium (ICGC) database of cancer genomes, we identified several HNF1A mutations located in the functional Pit-Oct-Unc (POU) domain. In our biochemical analysis, we found that the HNF1A POU-domain mutations Y122C, R229Q and V259F suppressed HNF4A promoter activity and disrupted the binding of HNF1A to its target HNF4A promoter without any effect on the nuclear localization. Our results suggest that the decreased transcriptional activity of HNF1A mutants is due to impaired DNA binding. Through structural simulation analysis, we found that a V259F mutation was likely to affect DNA interaction by inducing large conformational changes in the N-terminal region of HNF1A. The results suggest that POU-domain mutations of HNF1A downregulate HNF4A gene expression. Therefore, to mimic the HNF1A mutation phenotype in transcription networks, we performed siRNA-mediated knockdown (KD) of HNF4A. Through RNA-Seq data analysis for the HNF4A KD, we found 748 differentially expressed genes (DEGs), of which 311 genes were downregulated (e.g., HNF1A, ApoB and SOAT2) and 437 genes were upregulated. Kyoto Encyclopedia of Genes and Genomes (KEGG) mapping revealed that the DEGs were involved in several signaling pathways (e.g., lipid and cholesterol metabolic pathways). Protein-protein network analysis suggested that the downregulated genes were related to lipid and cholesterol metabolism pathways, which are implicated in hepatocellular carcinoma (HCC) development. Our study demonstrates that mutations of HNF1A in the POU domain result in the downregulation of HNF1A target genes, including HNF4A, and this may trigger HCC development through the disruption of HNF4A-HNF1A transcriptional networks.
Keywords: HNF1A; HNF4A; POU domain; hepatocellular carcinoma; mutation.
Conflict of interest statement
The authors declare no conflict of interest.
Figures


Similar articles
-
Long Noncoding RNAs Hepatocyte Nuclear Factor 4A Antisense RNA 1 and Hepatocyte Nuclear Factor 1A Antisense RNA 1 Are Involved in Ritonavir-Induced Cytotoxicity in Hepatoma Cells.Drug Metab Dispos. 2022 May;50(5):704-715. doi: 10.1124/dmd.121.000693. Epub 2021 Dec 23. Drug Metab Dispos. 2022. PMID: 34949673 Free PMC article.
-
Loss-of-function mutations in Zn-finger DNA-binding domain of HNF4A cause aberrant transcriptional regulation in liver cancer.Oncotarget. 2018 May 25;9(40):26144-26156. doi: 10.18632/oncotarget.25456. eCollection 2018 May 25. Oncotarget. 2018. PMID: 29899848 Free PMC article.
-
Methyltransferase Like-3-Mediated N6-Methyladenosine Modification of Long Noncoding RNA Hepatocyte Nuclear Factor 1a Antisense RNA 1/Hepatocyte Nuclear Factor 4a Antisense RNA 1 Regulates Cytochrome P450 Enzyme Expression.Drug Metab Dispos. 2024 Sep 16;52(10):1104-1114. doi: 10.1124/dmd.124.001832. Drug Metab Dispos. 2024. PMID: 39168523
-
Half-Life of Sulfonylureas in HNF1A and HNF4A Human MODY Patients is not Prolonged as Suggested by the Mouse Hnf1a(-/-) Model.Curr Pharm Des. 2015;21(39):5736-48. doi: 10.2174/1381612821666151008124036. Curr Pharm Des. 2015. PMID: 26446475 Review.
-
Primary hepatocellular adenoma due to biallelic HNF1A mutations and its co-occurrence with MODY 3: case-report and review of the literature.Endocrine. 2020 Mar;67(3):544-551. doi: 10.1007/s12020-019-02138-x. Epub 2019 Nov 21. Endocrine. 2020. PMID: 31754975 Free PMC article. Review.
Cited by
-
Hepatocyte nuclear factor 4-Alpha: a key regulator in liver carcinogenesis.Cell Oncol (Dordr). 2025 Aug;48(4):885-897. doi: 10.1007/s13402-025-01064-7. Epub 2025 May 20. Cell Oncol (Dordr). 2025. PMID: 40392499 Free PMC article. Review.
-
Novel molecular mechanisms of immune evasion in hepatocellular carcinoma: NSUN2-mediated increase of SOAT2 RNA methylation.Cancer Commun (Lond). 2025 Jul;45(7):846-879. doi: 10.1002/cac2.70023. Epub 2025 Apr 14. Cancer Commun (Lond). 2025. PMID: 40227950 Free PMC article.
-
HNF4α is possibly the missing link between epithelial-mesenchymal transition and Warburg effect during hepatocarcinogenesis.Cancer Sci. 2023 Apr;114(4):1337-1352. doi: 10.1111/cas.15686. Epub 2022 Dec 19. Cancer Sci. 2023. PMID: 36479791 Free PMC article.
-
The role of hepatocyte nuclear factor 4α (HNF4α) in tumorigenesis.Front Oncol. 2022 Sep 28;12:1011230. doi: 10.3389/fonc.2022.1011230. eCollection 2022. Front Oncol. 2022. PMID: 36249028 Free PMC article. Review.
References
-
- Lin L., Yan L., Liu Y., Qu C., Ni J., Li H. The Burden and Trends of Primary Liver Cancer Caused by Specific Etiologies from 1990 to 2017 at the Global, Regional, National, Age, and Sex Level Results from the Global Burden of Disease Study 2017. Liver Cancer. 2020;9:563–582. doi: 10.1159/000508568. - DOI - PMC - PubMed
Publication types
MeSH terms
Substances
LinkOut - more resources
Full Text Sources
Medical
Research Materials
Miscellaneous
