

Liver Transcriptome Response to Heat Stress in Beijing You Chickens and Guang Ming Broilers
- PMID: 35327970
- PMCID: PMC8953548
- DOI: 10.3390/genes13030416
Liver Transcriptome Response to Heat Stress in Beijing You Chickens and Guang Ming Broilers
Abstract
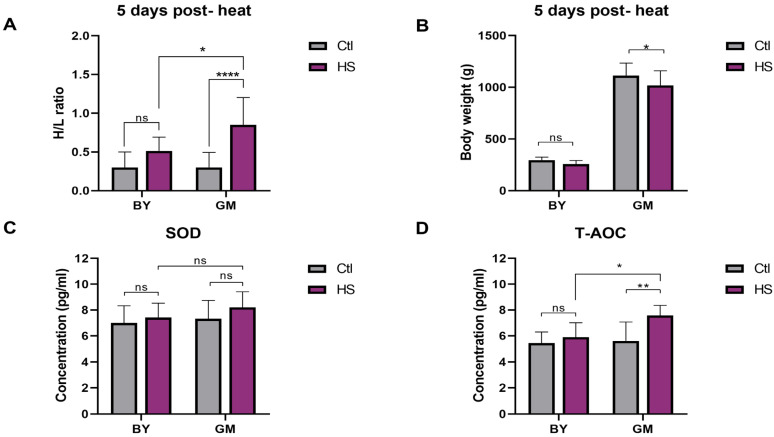
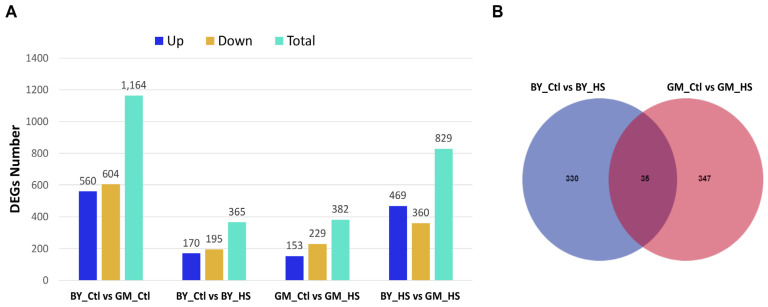
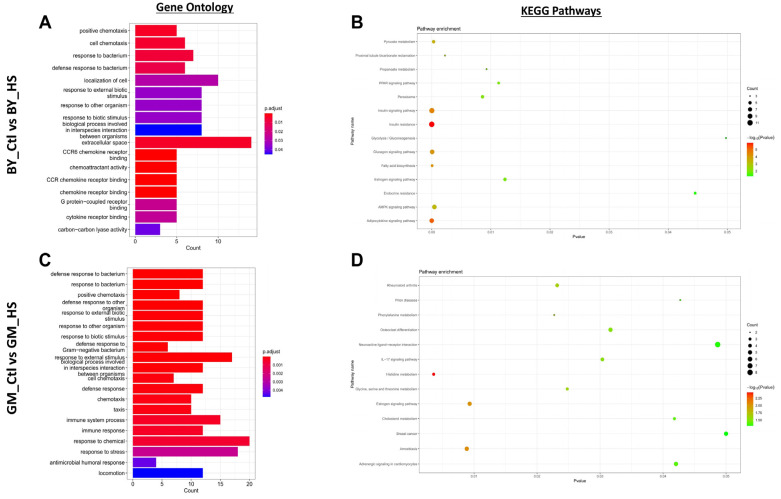
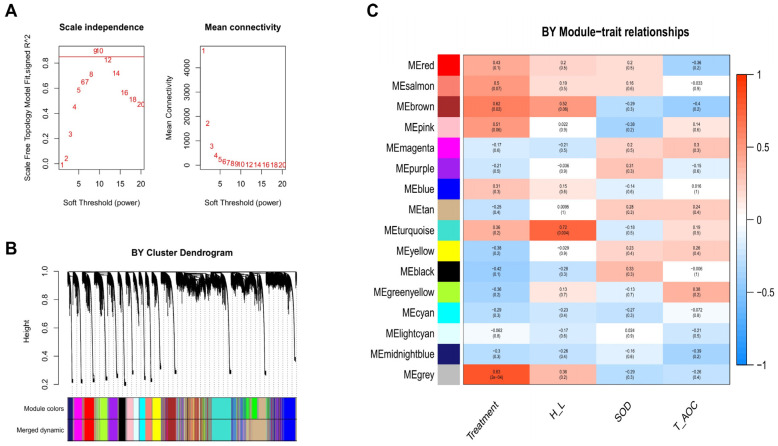
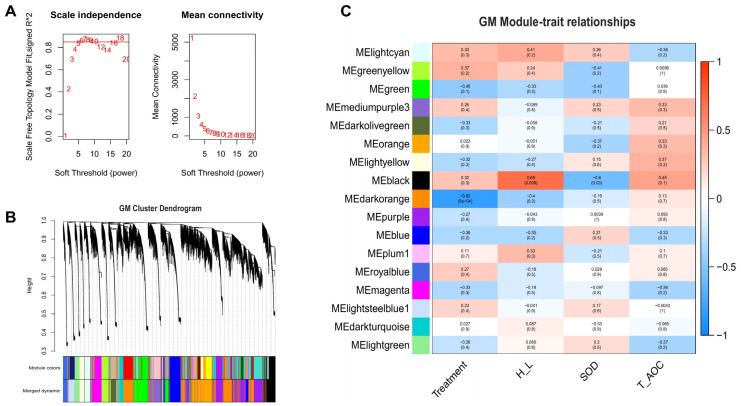
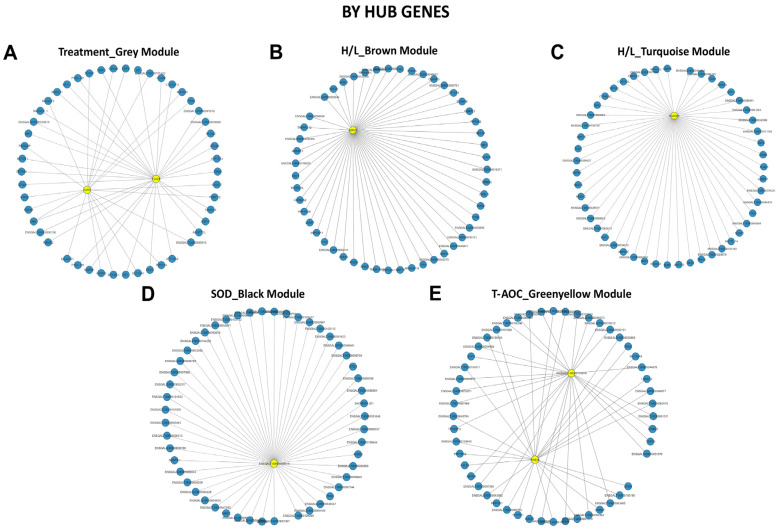
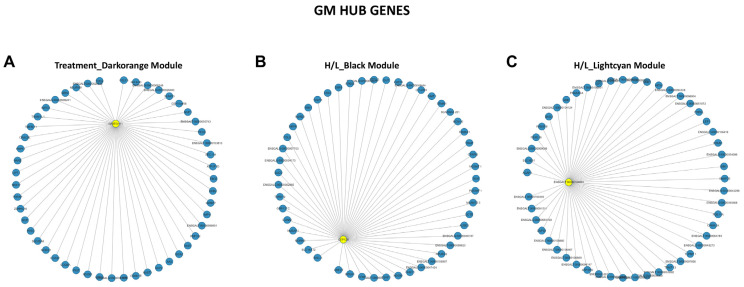
Heat stress is one of the most prevalent issues in poultry production that reduces performance, robustness, and economic gains. Previous studies have demonstrated that native chickens are more tolerant of heat than commercial breeds. However, the underlying mechanisms of the heat tolerance observed in native chicken breeds remain unelucidated. Therefore, we performed a phenotypical, physiological, liver transcriptome comparative analysis and WGCNA in response to heat stress in one native (Beijing You, BY) and one commercial (Guang Ming, GM) chicken breed. The objective of this study was to evaluate the heat tolerance and identify the potential driver and hub genes related to heat stress in these two genetically distinct chicken breeds. In brief, 80 BY and 60 GM, 21 days old chickens were submitted to a heat stress experiment for 5 days (33 °C, 8 h/day). Each breed was divided into experimental groups of control (Ctl) and heat stress (HS). The results showed that BY chickens were less affected by heat stress and displayed reduced DEGs than GM chickens, 365 DEGs and 382 DEGs, respectively. The transcriptome analysis showed that BY chickens exhibited enriched pathways related to metabolism activity, meanwhile GM chickens' pathways were related to inflammatory reactions. CPT1A and ANGPTL4 for BY chickens, and HSP90B1 and HSPA5 for GM chickens were identified as potential candidate genes associated with HS. The WGCNA revealed TLR7, AR, BAG3 genes as hub genes, which could play an important role in HS. The results generated in this study provide valuable resources for studying liver transcriptome in response to heat stress in native and commercial chicken lines.
Keywords: Beijing You; Guang Ming; WGCNA; heat stress; transcriptome.
Conflict of interest statement
The authors declare no conflict of interest.
Figures
Similar articles
-
Comparative Analysis of the Liver Transcriptome of Beijing You Chickens and Guang Ming Broilers under Salmonella enterica Serovar Typhimurium Infection.Microorganisms. 2022 Dec 9;10(12):2440. doi: 10.3390/microorganisms10122440. Microorganisms. 2022. PMID: 36557693 Free PMC article.
-
Liver Transcriptome Responses to Heat Stress and Newcastle Disease Virus Infection in Genetically Distinct Chicken Inbred Lines.Genes (Basel). 2020 Sep 11;11(9):1067. doi: 10.3390/genes11091067. Genes (Basel). 2020. PMID: 32932855 Free PMC article.
-
Liver transcriptome response to hyperthermic stress in three distinct chicken lines.BMC Genomics. 2016 Nov 22;17(1):955. doi: 10.1186/s12864-016-3291-0. BMC Genomics. 2016. PMID: 27875983 Free PMC article.
-
Exploring Evolutionary Adaptations and Genomic Advancements to Improve Heat Tolerance in Chickens.Animals (Basel). 2024 Jul 30;14(15):2215. doi: 10.3390/ani14152215. Animals (Basel). 2024. PMID: 39123741 Free PMC article. Review.
-
Integrated Genomic Approaches to Characterize and Mitigate Heat Stress in Poultry.Annu Rev Anim Biosci. 2025 Feb;13(1):121-141. doi: 10.1146/annurev-animal-111523-102021. Epub 2024 Oct 30. Annu Rev Anim Biosci. 2025. PMID: 39476417 Review.
Cited by
-
Transcriptome Profiling of a Common Mistletoe Species Parasitizing Four Typical Host Species in Urban Southwest China.Genes (Basel). 2022 Jun 29;13(7):1173. doi: 10.3390/genes13071173. Genes (Basel). 2022. PMID: 35885955 Free PMC article.
-
Long-Term Heat Stress and Genetic Responses in Growth Traits of Thai Native Synthetic Chicken Lines.Animals (Basel). 2025 Jul 18;15(14):2130. doi: 10.3390/ani15142130. Animals (Basel). 2025. PMID: 40723592 Free PMC article.
-
A systematic review on the trend of transcriptomic study in livestock: An effort to unwind the complexity of adaptation in a climate change environment.Heliyon. 2024 Dec 12;11(1):e41090. doi: 10.1016/j.heliyon.2024.e41090. eCollection 2025 Jan 15. Heliyon. 2024. PMID: 39807518 Free PMC article. Review.
-
Physiological and transcriptomic analysis dissects the molecular mechanism governing meat quality during postmortem aging in Hu sheep (Ovis aries).Front Nutr. 2024 Jan 5;10:1321938. doi: 10.3389/fnut.2023.1321938. eCollection 2023. Front Nutr. 2024. PMID: 38249602 Free PMC article.
-
Transcriptome analysis of jejunal mucosal tissue in breeder hens exposed to acute heat stress.Poult Sci. 2025 Jan;104(1):104532. doi: 10.1016/j.psj.2024.104532. Epub 2024 Nov 8. Poult Sci. 2025. PMID: 39561558 Free PMC article.
References
-
- Nardone A., Ronchi B., Lacetera N., Ranieri M.S., Bernabucci U. Effects of climate changes on animal production and sustainability of livestock systems. Livest. Sci. 2010;130:57–69. doi: 10.1016/j.livsci.2010.02.011. - DOI
-
- Alagawany M., Farag M.R., Abd El-Hack M.E., Patra A. Heat stress: Effects on productive and reproductive performance of quail. World’s Poult. Sci. J. 2017;73:747–756. doi: 10.1017/S0043933917000782. - DOI
-
- Yahav S., Goldfeld S., Plavnik I., Hurwitz S. Physiological responses of chickens and turkeys to relative humidity during exposure to high ambient temperature. J. Therm. Biol. 1995;20:245–253. doi: 10.1016/0306-4565(94)00046-L. - DOI
Publication types
MeSH terms
LinkOut - more resources
Full Text Sources
Medical
Research Materials
Miscellaneous
