. 2022 Mar 10;13(3):490.
doi: 10.3390/genes13030490.

Alternative Promoters of GRIK2 (GluR6) Gene in Human Carcinoma Cell Lines Are Regulated by Differential Methylation of CpG Dinucleotides

Affiliations

Alternative Promoters of GRIK2 (GluR6) Gene in Human Carcinoma Cell Lines Are Regulated by Differential Methylation of CpG Dinucleotides

Vikramjit K Zhawar et al. Genes (Basel). .

Abstract

The ionotropic glutamate receptor 6 (GluR6 or GRIK2) gene is transcribed by two cell-type-specific promoters in neuronal and non-neuronal cells, which results in five different transcript variants. The purpose of this study was to explore cell-type-specific silencing of these promoters by epigenetic mechanisms. The neuronal and non-neuronal promoter sequences were cloned upstream of the luciferase gene in the pGL3 luciferase reporter vector. Promoter susceptibility to methylation was confirmed by 5-azacytidine and trichostatin treatment, and the status of CpG dinucleotides was determined by bisulfite sequencing of the promoter was determined by bisulfite sequences. GluR6A transcript variant was expressed in the brain, and GluR6B was most abundant in tumor cell lines. The neuronal promoter was methylated in non-neuronal cell lines. The treatment with 5-azacytidine and trichostatin upregulated transcription of the GluR6 gene, and methylation of the GluR6 promoter sequence in the luciferase reporter system led to downregulation of the luciferase gene transcription. Bisulfite sequencing revealed methylation of 3 and 41 CpG sites in non-neuronal and neuronal promoters, respectively. The differential activation/silencing of GluR6 promoters suggests that the transcript variants of GluR6 are involved in tissue-specific biological processes and their aberrant regulation in tumor cells may contribute to distinct properties of tumor cells.

Keywords: CpG methylation in GluR6 promoters; GRIK2; GluR6; GluR6 variants; bisulfite sequencing; carcinoma; epigenetic regulation; luciferase reporter; neuronal and non-neuronal promoters in GluR6/GRIK2.


Conflict of interest statement

The authors declare no conflict of interest.

Figures

Figure 1
Figure 1
Expression of GluR6 isoforms in cell lines. (A) Positions of primers used for amplifying GluR6 alternative transcripts (A–E). The numbered open rectangles represent exons 1–17, and solid rectangle indicates the transmembrane domain. F1-R1 primers are common to all isoforms. F1-R2, F2-R3, F2-R4, F3-R3, and F3-R4 amplify GluR6 isoforms A, B, C, D, and E, respectively. (B) RNA responding to GluR6 was amplified with primers F1-R1 that are common to all isoforms. The bottom row shows relative levels of GAPDH transcript. Lane1: HDFs; lanes 2 and 3: WM239A and WM266A (melanoma); lane 4: A549 (lung); Lane 5: DU145 (prostate); lane 6: SUSM1 (chemically immortalized); lane 7: EJ (bladder); Lane 8: FOCUS (hepatoma); lane 9: T98G (glioblastoma); lanes 10 to 13: SKBR3, T47D, MDAMB468, and MCF7 (breast); Lanes 14 to 17: OVCAR429, PA1, SKOV3, and HEY8A (ovarian); lane 18: U87MG (glioblastoma); Lane 19: WM983B (melanoma) and lane 20: OVCAR3 (ovarian).
Figure 2
Figure 2
Southern hybridization of restriction enzyme digested DNA from tumor cell lines. Top two rows show the location of introns and exons transcribed by non-neuronal and neuronal promoters. The probes (probe 1 and probe 2) used for hybridization are indicated in the second row. The lanes showing rearrangements at GluR6 locus in MCF7, FOCUS, EJ, and SKBR3 cells are marked.
Figure 3
Figure 3
Identification of CpG methylation at HpaII/Msp I sites in promoter PNN and promoter PN. (A) The locations of HpaII/MspI restriction sites relative to A of ATG on genomic DNA and restriction fragment lengths in base pairs for promoter regions corresponding to PNN and PN are indicated. (B) Southern blots of DNA of tumor cell lines and normal HDFs digested with HpaII (H) and MspI (M) and hybridized with PNN specific probe (−7500 to −5253) and PN specific probe (−1839 to +708) as shown in upper and lower panels, respectively. Lanes 1 to 19 correspond to the following cell lines. Normal HDFs; T47D; SkBr3; DU145; SKOV3; OVCAR429; PA1; OVCAR3; T98G; EJ; MCF7; FOCUS; OVCAR443; HEY8A; U87MG; MDAMB468; WM239A; WM983B; WM266A.
Figure 4
Figure 4
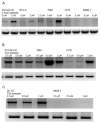
GluR6 expression in the presence of 5-azacytidine and TSA. (A) The cell lines were treated with 5-azacytidine, and the GluR6 transcript was amplified by RT-PCR. The cell lines and the treatment are indicated. (B,C) The cells were treated with TSA and the transcripts amplified by RT-PCR. The cell lines and the treatment are indicated. Amplification of GAPDH transcript to indicate comparable amounts of cDNA used for amplifying the transcript corresponding to GluR6 are shown in the bottom strip of each panel. The top portion of the panel shows amplification of GluR6 transcript. The amplified transcripts corresponding to GluR6 and GAPDH were electrophoresed in separate gels.
Figure 5
Figure 5
The effect of promoter methylation on the expression of luciferase reporter gene. (A) PNN promoter containing construct was transfected into SKOV3, U87MG, and COS7 cells before and after methylation. The reporter gene expression was quantified by measuring the luminescence. (B) PN promoter containing construct was transfected into SKOV3, U87MG, and COS7 cells before and after methylation. The reporter gene expression was quantified by measuring the luminescence, and the data represent mean + standard deviation of triplicate measurements. The Y-axis indicates relative luciferase activity (RLA) units. C, mock treated promoter; M, methylated promoter; P, empty pGL3 vector.
Figure 6
Figure 6
Methylation map of promoters PNN panel (A) and PN panel (B) in normal fibroblast cells (FS2) and four cancer cell lines (DU145, OVCAR429, T98G, T47D). Transcription start sites are indicated. Open rectangles denote unmethylated CpG, solid rectangles denote completely methylated CpG, and striped rectangles indicate methylated and some unmethylated clones. CpG sites 69–90 of PNN promoter are not shown as all of them were unmethylated.

Similar articles

References

    1. Hollmann M., Heinemann S. Cloned glutamate receptors. Annu. Rev. Neurosci. 1994;17:31–108. doi: 10.1146/annurev.ne.17.030194.000335. - DOI - PubMed
    1. Lerma J. Ionotropic glutamate receptors in the CNS. In: Jonas P., Monyer H., editors. Handbook of Experimental Pharmacology. Volume 141. Springer; Berlin, Germany: 1999. pp. 275–307.
    1. Fogarty D.J., Perez-Cerda F., Matute C. KA1-like kainate receptor subunit immunoreactivity in neurons and glia using a novel anti-peptide antibody. Mol. Brain Res. 2000;81:164–176. doi: 10.1016/S0169-328X(00)00179-0. - DOI - PubMed
    1. Savinainen A., Garcia E.P., Dorow D., Marshall J., Lin Y.F. Kainate receptor activation induces mixed lineage kinase-mediated cellular signaling cascades via Post-synaptic Density Protein 95. J. Biol. Chem. 2001;276:11382–11386. doi: 10.1074/jbc.M100190200. - DOI - PubMed
    1. Yang D.D., Kuan C.Y., Whitmarsh A.J., Rinócn M., Zheng T.S., Davis R.J., Rakic P., Flavell R.A. Absence of excitotoxicity-induced apoptosis in the hippocampus of mice lacking the jnk3 gene. Nature. 1997;389:865–870. doi: 10.1038/39899. - DOI - PubMed

Publication types

LinkOut - more resources