. 2022 Mar 7;12(3):648.
doi: 10.3390/diagnostics12030648.

First Characterization of ADAMTS-4 in Kidney Tissue and Plasma of Patients with Chronic Kidney Disease-A Potential Novel Diagnostic Indicator

Affiliations

First Characterization of ADAMTS-4 in Kidney Tissue and Plasma of Patients with Chronic Kidney Disease-A Potential Novel Diagnostic Indicator

Ivana Kovacevic Vojtusek et al. Diagnostics (Basel). .

Abstract

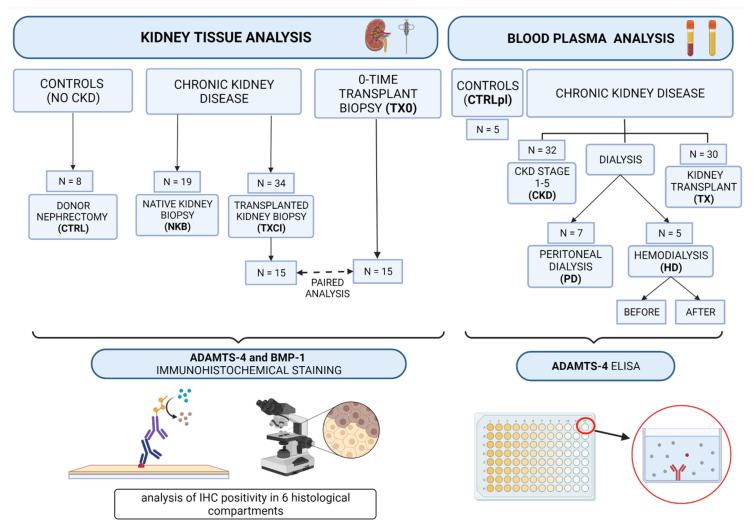
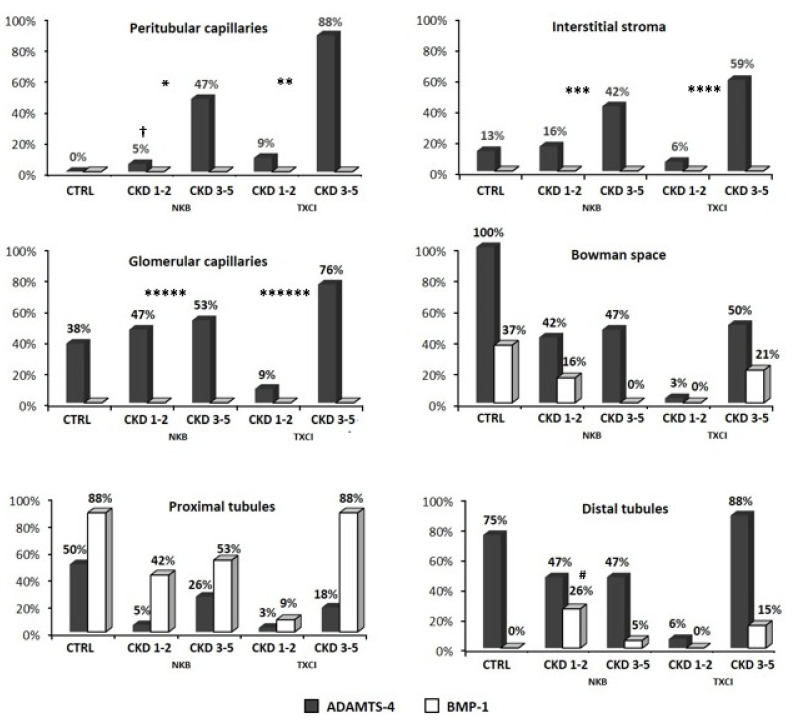
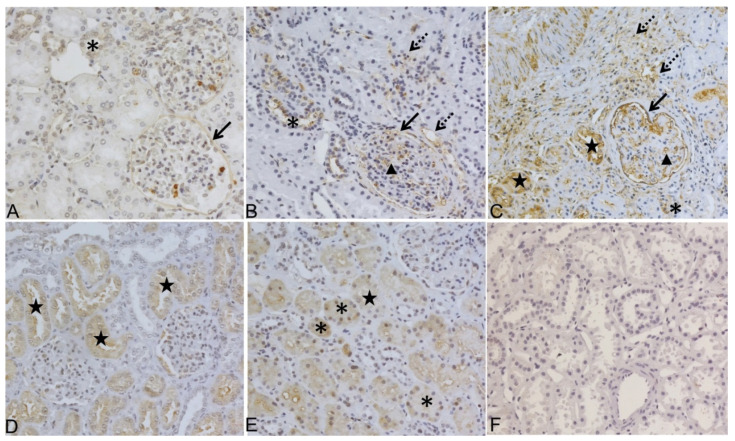
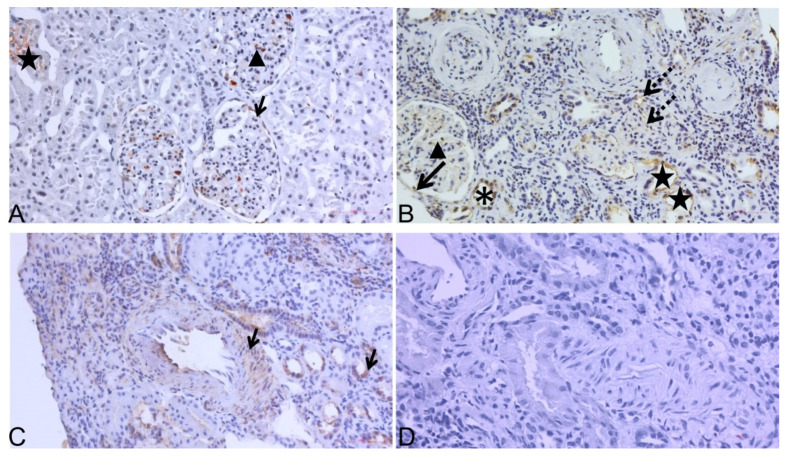
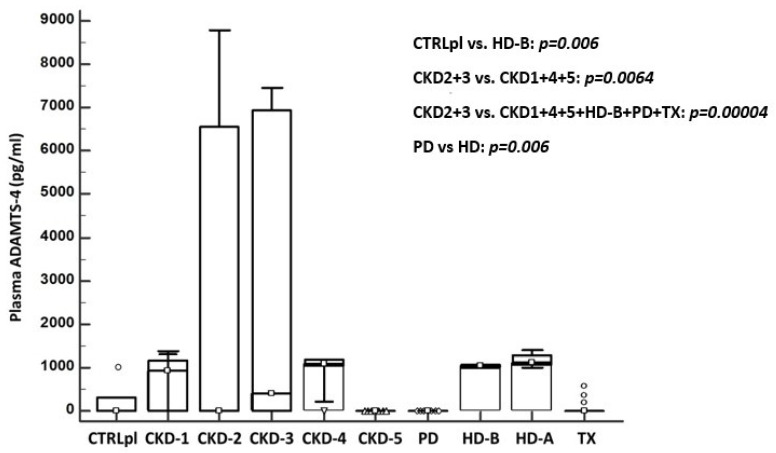
Background: We have previously shown that metzincin protease ADAMTS-4 accompanies renal fibrogenesis, as it appears in the blood of hemodialysis patients. Methods: Native kidney (NKB) and kidney transplant (TXCI) biopsy samples as well as plasma from patients with various stages of CKD were compared to controls. In paired analysis, 15 TXCI samples were compared with their zero-time biopsies (TX0). Tissues were evaluated and scored (interstitial fibrosis and tubular atrophy (IFTA) for NKB and Banff ci for TXCI). Immunohistochemical (IHC) staining for ADAMTS-4 and BMP-1 was performed. Plasma ADAMTS-4 was detected using ELISA. Results: ADAMTS-4 IHC expression was significantly higher in interstitial compartment (INT) of NKB and TXCI group in peritubular capillaries (PTC) and interstitial stroma (INT). Patients with higher stages of interstitial fibrosis (ci > 1 and IFTA > 1) expressed ADAMTS-4 in INT more frequently in both groups (p = 0.005; p = 0.013; respectively). In paired comparison, TXCI samples expressed ADAMTS-4 in INT and PTC more often than TX0. ADAMTS-4 plasma concentration varied significantly across CKD stages, being highest in CKD 2 and 3 compared to other groups (p = 0.0064). Hemodialysis patients had higher concentrations of ADAMTS-4 compared to peritoneal dialysis (p < 0.00001). Conclusion: ADAMTS-4 might have a significant role in CKD as a potential novel diagnostic indicator.

Keywords: ADAMTS-4; bone morphogenic protein 1; chronic kidney disease; kidney transplantation; renal dialysis.


Conflict of interest statement

The authors declare no conflict of interest.

Figures

Figure 1
Figure 1
Study outline showing subject groups and the methodological approach.
Figure 2
Figure 2
The distribution of ADAMTS-4 and BMP-1 molecules detected by immunohistochemistry staining in six observed areas of different kidney tissue compartments (peritubular capillaries, interstitial stroma, glomerular capillaries, Bowman space, proximal and distal tubules) among control group (CTRL), native kidney biopsy group (NKB), and clinically indicated transplant biopsy group (TXCI). The frequencies of BMP-1 staining between the CTRL and other study groups were not significantly different (all p > 0.05), with only one exception for DT area (mark #), where frequency of BMP-1 staining was significantly higher in NKB-CKD 1–2 than in CTRL (p = 0.035). ADAMTS-4 IHC staining was detected in all six observation areas. Significantly higher frequency in both group with CKD (NKB and TXCI) in comparison to CTRL group was found for PTC (CTRL vs. NKB, p = 0.025, mark *; CTRL vs. TXCI, p < 0.001, mark **); for INT (CTRL vs. NKB, p = 0.043, mark ***; CTRL vs. TXCI, p = 0.015, mark ****); and for GC (CTRL vs. NKB, p = 0.001, mark *****; CTRL vs. TXCI, p = 0.012, mark ******). When comparing CKD subgroups within NKB and TXCI, significance was found only in NKB group for PTC area (NKB-CKD 1–2 vs. NKB-CKD 3–5; p = 0.001, mark †). CKD, chronic kidney disease; CKD 1–2 and CKD 3–5, CKD subgroups of NKB and TXCI group (number represents stage); Frequency (%), proportion of patients in the group who show positive IHC staining for ADAMTS-4 and BMP-1 for 6 different observation areas.
Figure 3
Figure 3
ADAMTS-4 and BMP-1 expression analyses by immunohistochemistry (IHC) in native kidney tissue biopsy samples (NKB) from patients with chronic kidney disease (CKD) in different stages of kidney failure. (A) Representative staining of ADAMTS-4 in control without CKD: positive in DT and BC; (B) representative staining of ADAMTS-4 in early stage of CKD (Stage 2) positive in GC, peritubular capillaries (PTC), mild fibrosis in interstitial area INT, BC, and DT; (C) representative staining of ADAMTS-4 in advanced stages of CKD (Stage 4) positive in all six analyzed kidney areas (GC, PTC, INT, PXT, DT, and BC); (D) representative staining of BMP-1 in control without CKD: positive only in PXT and (E) in early stage of CKD (Stage 2), positive in DT and PXT with no labelling find in glomerulus; (F) secondary antibody only control. Original magnification 200×. DT, asterisk; BC, black arrow; GC, black arrow head; PTC, INT, dashed arrow; PXT, black star.
Figure 4
Figure 4
ADAMTS-4 expression analyses by immunohistochemistry (IHC) in transplant kidney biopsy sample pair. (A) Representative staining of ADAMTS-4 in “zero-time“ sample (TX0) taken at time of transplantation: positive in GC, BC, and PXT; (B) representative staining of ADAMTS-4 in paired TXCI biopsy sample (stage CKD-4): positive in PTC and INT, where interstitial infiltrate is also seen along with GC and damaged PXT; (C) ADAMTS-4 positive control: positive in artery wall of middle sized intralobular artery (black arrow—left) and DT (black arrow—right); (D) secondary antibody only control in kidney biopsy sample was used. Original magnification 200×. DT, asterisk; BC, black arrow; GC, black arrow head; PTC, INT, dashed arrow; PXT, black star.
Figure 5
Figure 5
Concentration of ADAMTS-4 protein detected in plasma of healthy subjects in control group (CTRLpl), chronic kidney disease (CKD stages 1–5), on peritoneal dialysis (PD), hemodialysis (before HD-B and after HD-A), and kidney transplant patients (TX). The box plot displays the lower to upper quartile (25th to 75th percentiles) and median (middle line); the minimum and maximum levels as horizontal lines outside the box; and far-out values are plotted with a different marker (◦). Significant difference of mean ADAMTS-4 plasma concentrations was found between CTRLpl and HD-B group (p = 0.006) and also varied significantly between CKD stages being highest in patients with CKD stages 2 and 3 compared to CKD 1 + 4 + 5 (p = 0.0064) and CKD 1 + 4 + 5 + HD-B + PD + TX (p = 0.00004). None of the patients in PD group had detectable plasma ADAMTS-4, which differed significantly from the HD group (p < 0.00001).

Similar articles

Cited by

References

    1. GBD Chronic Kidney Disease Collaboration Global, regional, and national burden of chronic kidney disease, 1990–2017: A systematic analysis for the Global Burden of Disease Study. Lancet. 2020;395:709–733. doi: 10.1016/S0140-6736(20)30045-3. - DOI - PMC - PubMed
    1. Stenvinkel P. Chronic kidney disease: A public health priority and harbinger of premature cardiovascular disease. J. Intern. Med. 2010;268:456–467. doi: 10.1111/j.1365-2796.2010.02269.x. - DOI - PubMed
    1. Levey A.S., Astor B.C., Stevens L.A., Coresh J. Chronic kidney disease, diabetes, and hypertension: What’s in a name? Kidney Int. 2010;78:19–22. doi: 10.1038/ki.2010.115. - DOI - PubMed
    1. Gansevoort R.T., de Jong P.E. Challenges for the present CKD classification system. Curr. Opin. Nephrol. Hypertens. 2010;19:308–314. doi: 10.1097/MNH.0b013e328337bbbe. - DOI - PubMed
    1. Tampe D., Zeisberg M. Potential approaches to reverse or repair renal fibrosis. Nat. Rev. Nephrol. 2014;10:226–237. doi: 10.1038/nrneph.2014.14. - DOI - PubMed