. 2022 Mar 10;12(3):676.
doi: 10.3390/diagnostics12030676.

GLUT3/SLC2A3 Is an Endogenous Marker of Hypoxia in Prostate Cancer Cell Lines and Patient-Derived Xenograft Tumors

Affiliations

GLUT3/SLC2A3 Is an Endogenous Marker of Hypoxia in Prostate Cancer Cell Lines and Patient-Derived Xenograft Tumors

John M Ryniawec et al. Diagnostics (Basel). .

Abstract

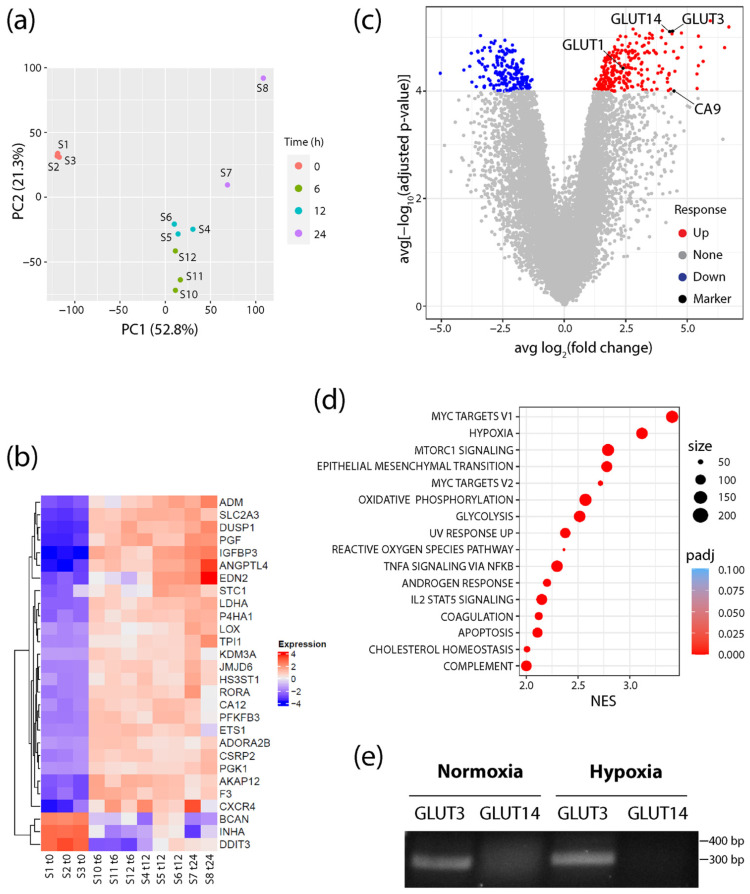
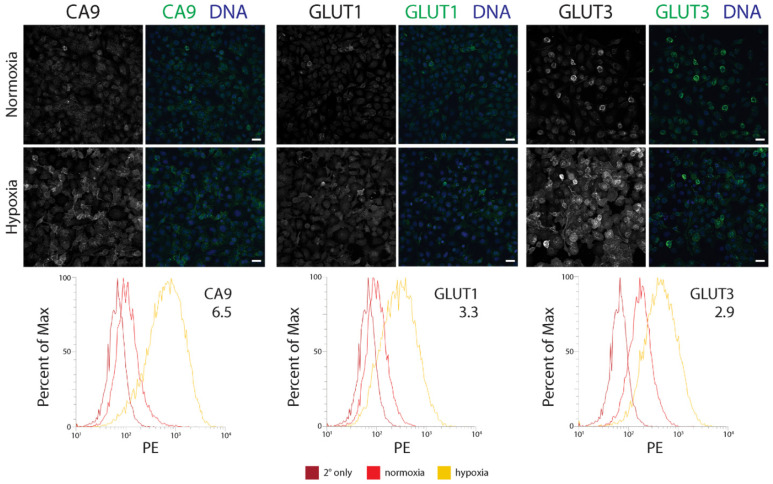
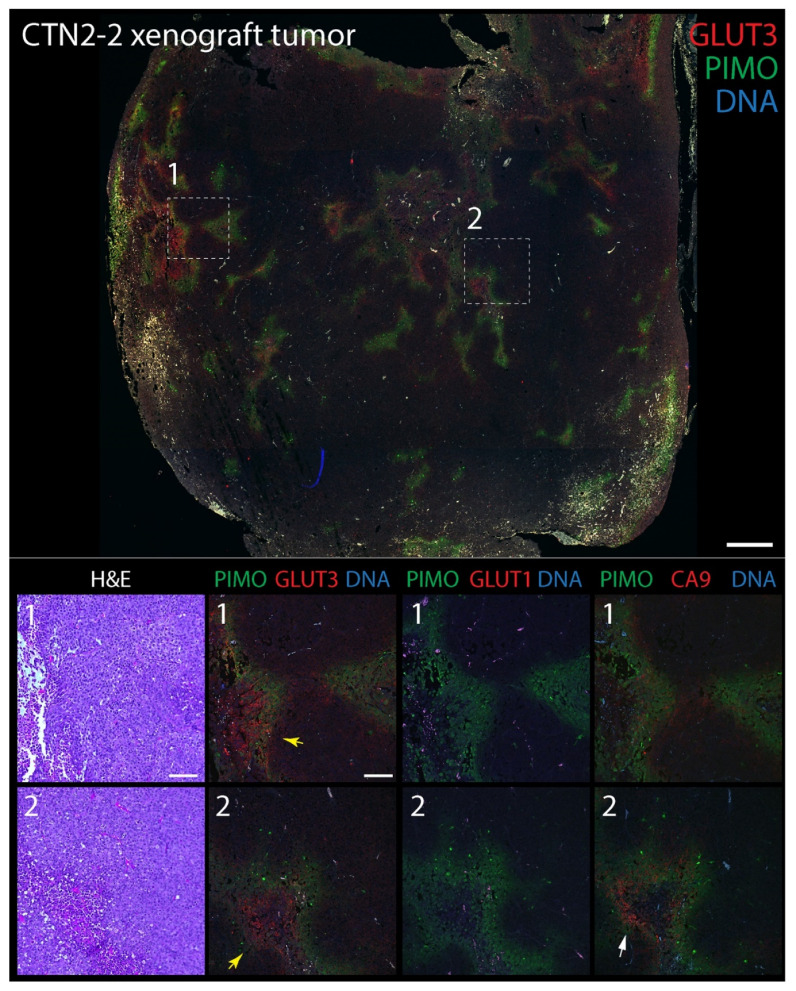
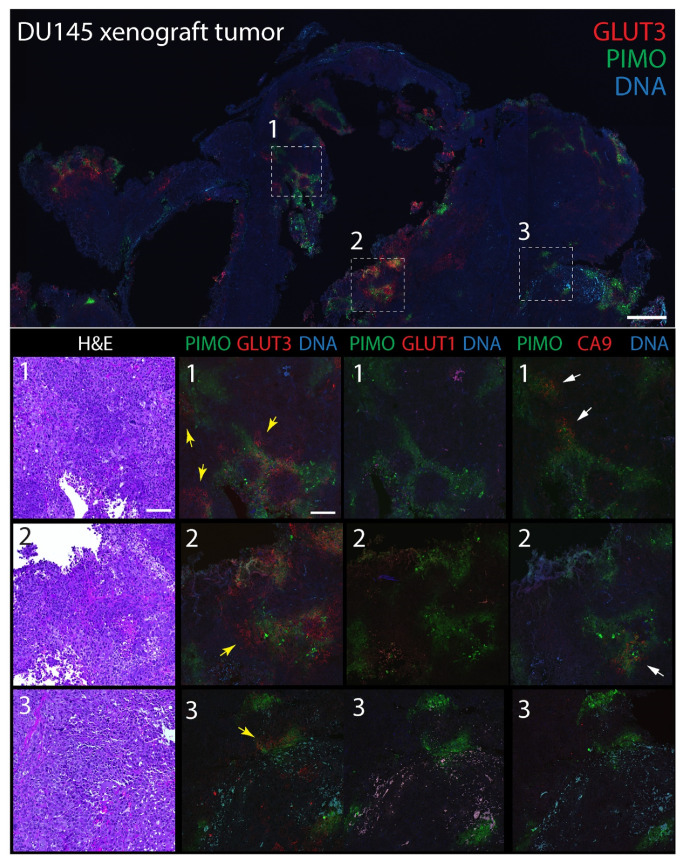
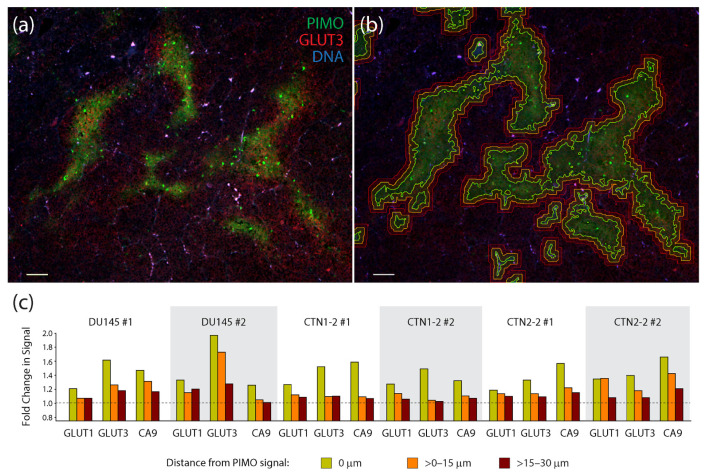
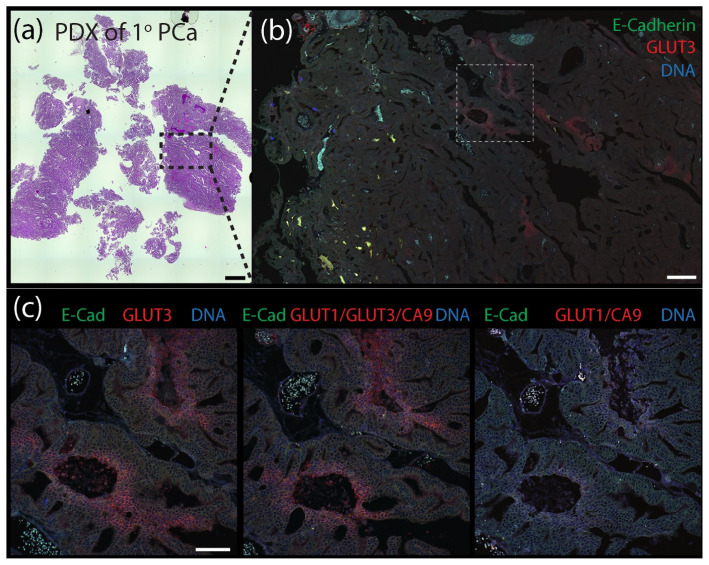
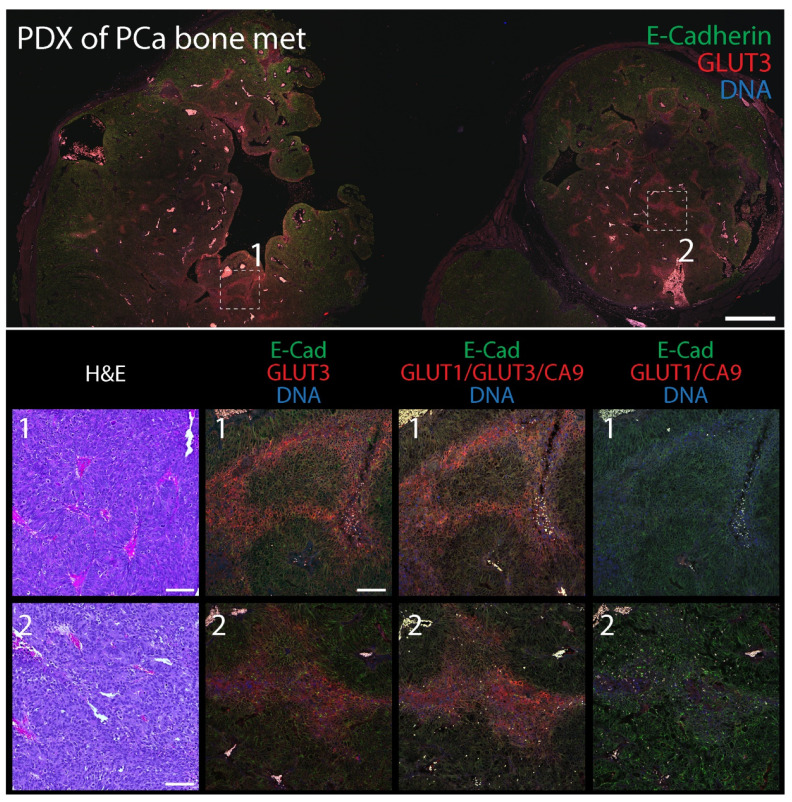
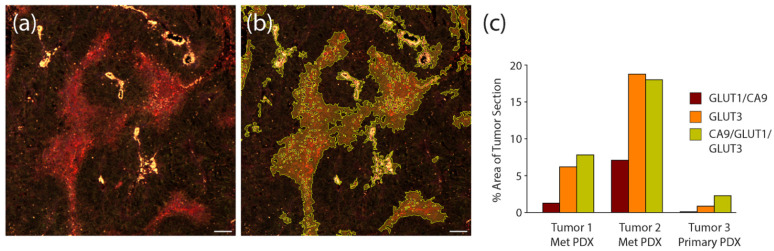
The microenvironment of solid tumors is dynamic and frequently contains pockets of low oxygen levels (hypoxia) surrounded by oxygenated tissue. Indeed, a compromised vasculature is a hallmark of the tumor microenvironment, creating both spatial gradients and temporal variability in oxygen availability. Notably, hypoxia associates with increased metastasis and poor survival in patients. Therefore, to aid therapeutic decisions and better understand hypoxia's role in cancer progression, it is critical to identify endogenous biomarkers of hypoxia to spatially phenotype oncogenic lesions in human tissue, whether precancerous, benign, or malignant. Here, we characterize the glucose transporter GLUT3/SLC2A3 as a biomarker of hypoxic prostate epithelial cells and prostate tumors. Transcriptomic analyses of non-tumorigenic, immortalized prostate epithelial cells revealed a highly significant increase in GLUT3 expression under hypoxia. Additionally, GLUT3 protein increased 2.4-fold in cultured hypoxic prostate cell lines and was upregulated within hypoxic regions of xenograft tumors, including two patient-derived xenografts (PDX). Finally, GLUT3 out-performs other established hypoxia markers; GLUT3 staining in PDX specimens detects 2.6-8.3 times more tumor area compared to a mixture of GLUT1 and CA9 antibodies. Therefore, given the heterogeneous nature of tumors, we propose adding GLUT3 to immunostaining panels when trying to detect hypoxic regions in prostate samples.

Keywords: GLUT3; SLC2A3; glucose transporter; hypoxia; prostate cancer.


Conflict of interest statement

The authors declare no conflict of interest.

Figures

Figure 1
Figure 1
GLUT3/SLC2A3 is highly upregulated in hypoxic conditions. (a) Principal component analysis plot showing RNA-seq profiles of prostate cells samples (S) at 0, 6, 12, and 24 h after exposure to hypoxic conditions (1% O2). (b) Heatmap represents the log2 (expression) values of all genes that are differentially expressed (Padj < 0.05 and abs [log2FC] > 2) in all three time points relative to the 0 h normoxia samples (S1–3), and that are also members of the MSigDB Hallmark hypoxia gene set. Each row has been mean-centered to better show changes in expression over time. (c) Volcano plot showing the average log2FC over each time point (6, 12, and 24 h) relative to 0 h normoxia samples (x-axis), and average significance (computed as −log10Padj) over each time point relative to 0 h normoxia samples (y-axis). (d) Dot plot shows all upregulated MSigDB Hallmark gene sets with Padj < 0.05 and normalized enrichment score (NES) > 2 when performing gene set enrichment analysis on the average rank times the sign of the fold change across each of the three time points (6, 12, and 24 h) relative to 0 h normoxia samples. The size of the dot indicates the total number of genes annotated to the Hallmark gene set. Color of the dot indicates the Padj value. (e) Primers specific for GLUT3 or GLUT14 were used for RT-PCR to assess expression in total RNAs isolated from normoxic and 24 h hypoxic RWPE1 cells. Predicted sizes of the PCR products: GLUT3, 299 bp; GLUT14, 370 bp. Note, this assay was used to simply detect the transcript and was not a quantitative assay of transcript levels.
Figure 2
Figure 2
The GLUT3 protein is upregulated in hypoxic immortalized prostate epithelial cells. (Upper and Middle panels) RWPE1 cells were cultured in either normoxic or under chronic hypoxic (1% O2) conditions for 48 h and then processed for immunofluorescence microscopy. Cells were stained for either CA9, GLUT1, or GLUT3 (green, Upper and Middle panels). DNA, blue. Scale, 25 µm. (Lower panels) Comparison of flow cytometry profiles of CA9, GLUT1, or GLUT3 in cells cultured in normoxia (red) versus hypoxia (yellow). Cells stained with only secondary antibody is shown (dark red). The fold increase in level of the indicated proteins is denoted. PE, phycoerythrin.
Figure 3
Figure 3
GLUT3 co-localizes with pimonidazole (Hypoxyprobe) in mouse xenograft tumors formed from prostate epithelial CTN-2-2 cells. Non-tumorigenic immortalized prostate epithelial PrEC-Hahn cells were transformed by transiently inducing chromosomal instability. The resulting tumorigenic line was named CTN-9, which produced malignant solid xenograft tumors in subcutaneously injected NSG mice [52]. Cell lines isolated from these tumors were named CTN1-2 and 2-2 lines [52]. (Upper panel) Single tumor section stained for pimonidazole (PIMO) (green) and GLUT3 (red). DNA, blue. Boxed regions are shown at higher magnification in the lower panels. (Lower panels) Higher magnification images from boxed regions 1 or 2 in upper panel. Serial tissue sections were stained for hematoxylin and eosin (H&E), PIMO (green), and GLUT3, GLUT1 or CA9 (red) as indicated. Concentrations of GLUT3 (yellow arrows) and CA9 (white arrows) that juxtapose with PIMO are marked. Dashed white boxes show GLUT3 concentrated at the plasma membrane in tumor cells (insets). Scale, 100 µm.
Figure 4
Figure 4
GLUT3 co-localizes with pimonidazole (Hypoxyprobe) in mouse xenograft tumors formed from prostate cancer DU145 cells. (Upper panel) Single tumor section stained for pimonidazole (PIMO) (green) and GLUT3 (red). DNA, blue. Boxed regions are shown at higher magnification in the lower panels. (Lower panels) Higher magnification images from boxed regions 1, 2, or 3 in upper panel. Serial tissue sections were stained for hematoxylin and eosin (H&E), PIMO (green), and GLUT3, GLUT1 or CA9 (red) as indicated. Concentrations of GLUT3 (yellow arrows) and CA9 (white arrows) that juxtapose with PIMO are marked. Dashed white boxes show GLUT3 concentrated at the plasma membrane in tumor cells (insets). Scale, 100 µm.
Figure 5
Figure 5
Measurements of the co-localization of hypoxia markers in xenograft tumors show a high degree of association between pimonidazole and GLUT3. (a) Single section from a CTN2-2 tumor immunostained for pimonidazole (PIMO) (green) and GLUT3 (red). DNA, blue. Scale, 100 µm. (b) To quantify co-localization of hypoxia markers GLUT1, GLUT3, and CA9 with PIMO, binary tracings were placed around the PIMO signal (green lines) defined a threshold of intensity specific to each tumor. Binaries were then dilated >0–15 µm (orange lines) and >15–30 µm (red lines) to capture the adjacent signal of each hypoxia marker. Same image as in (a). (c) Graphs show fold change in mean fluorescence intensities of hypoxia markers GLUT1, GLUT3 and CA9 within three PIMO-positive or adjacent regions captured within the expanded binary masks: 0 µm where the PIMO signal resides, >0–15 µm (orange bars) and >15–30 µm (red bars). Mean fluorescence intensities within these three regions was divided by ‘background’ signal from regions >30 µm from the PIMO signal. A dashed line indicates no change in signal relative to the background. Four optical fields in tissue sections from two different DU145, CTN1-2 and CTN2-2 tumors were analyzed (six different tumors examined in total).
Figure 6
Figure 6
Patient-derived xenograph (PDX) model of primary prostate cancer contains distinct pockets of GLUT3 staining. (a) Patient-derived xenograft (PDX) from a primary prostate tumor stained with H&E. Scale, 1.5 mm. (b) Section of PDX tumor immunostained for E-Cadherin (green) to mark cell borders and GLUT3 (red). DNA, blue. Boxed region is shown at higher magnification in (c). Scale, 250 µm. (c) Serial tissue sections were immunostained for either GLUT3 (red, left panel), a cocktail containing anti-GLUT1 and anti-CA9 antibodes (red, right panel), or antibodies against all three proteins GLUT1, GLUT3, and CA9 (red, middle panel) as indicated. Dashed white boxes show GLUT3 concentrated at the plasma membrane in tumor cells (insets). Scale, 100 µm.
Figure 7
Figure 7
Patient-derived xenograph (PDX) model of bone metastatic prostate cancer contains distinct pockets of GLUT3 staining. (Upper panel) Section of PDX tumor immunostained for E-Cadherin (green) to mark cell borders and GLUT3 (red). DNA, blue. Boxed regions are shown at higher magnification (Lower panels). Scale, 500 µm. (Lower panels) Higher magnification images from boxed regions 1 or 2 in upper panel. Serial tissue sections were stained with H&E (column 1) or immunostained for either GLUT3 (red, column 2), a cocktail containing anti-GLUT1, GLUT3, and CA9, antibodies (red, column 3), or antibodies against GLUT1 and CA9 (red, column 4) as indicated. Dashed white boxes show GLUT3 concentrated at the plasma membrane in tumor cells (insets). Scale, 100 µm.
Figure 8
Figure 8
Compared to hypoxia biomarkers GLUT1 and CA9, GLUT3 labels larger areas within PDX tumor sections. (a) Patient-derived xenograft (PDX) from a primary prostate tumor immunostained with the triple anti-CA9, GLUT1, and GLUT3 antibody cocktail. Scale, 100 µm. (b) Same image as in (a) with binary mask to outline regions of the triple stain. (c) Graph shows measurements of total area of each stain within 3 different PDX prostate tumors. Three sequential sections were obtained from each tumor, stained for either CA9/GLUT1, GLUT3, or the triple stain CA9/GLUT1/GLUT3, and imaged. Total area of staining was quantified by masking regions of high intensity staining using Nikon Elements image analysis software. Note, in the metastatic prostate PDX tumor samples, the vast majority of the signal observed in the triple stain is due to the GLUT3 stain. However, in the primary prostate PDX, GLUT3 staining alone is not as effective at revealing putative hypoxic regions compared to the triple stain.

Similar articles

Cited by

References

    1. Harris A.L. Hypoxia—A key regulatory factor in tumour growth. Nat. Cancer. 2002;2:38–47. doi: 10.1038/nrc704. - DOI - PubMed
    1. Nussenbaum F., Herman I.M. Tumor Angiogenesis: Insights and Innovations. J. Oncol. 2010;2010:132641. doi: 10.1155/2010/132641. - DOI - PMC - PubMed
    1. McKeown S.R. Defining normoxia, physoxia and hypoxia in tumours—implications for treatment response. Br. J. Radiol. 2014;87:20130676. doi: 10.1259/bjr.20130676. - DOI - PMC - PubMed
    1. Bader S.B., Dewhirst M.W., Hammond E.M. Cyclic Hypoxia: An Update on Its Characteristics, Methods to Measure It and Biological Implications in Cancer. Cancers. 2020;13:23. doi: 10.3390/cancers13010023. - DOI - PMC - PubMed
    1. Vaupel P., Mayer A. Hypoxia in cancer: Significance and impact on clinical outcome. Cancer Metastasis Rev. 2007;26:225–239. doi: 10.1007/s10555-007-9055-1. - DOI - PubMed

LinkOut - more resources