. 2022 Mar 14;12(3):708.
doi: 10.3390/diagnostics12030708.

Assessment of Liver Fat: Dual-Energy CT versus Conventional CT with and without Contrast

Affiliations

Assessment of Liver Fat: Dual-Energy CT versus Conventional CT with and without Contrast

Jack Junchi Xu et al. Diagnostics (Basel). .

Abstract

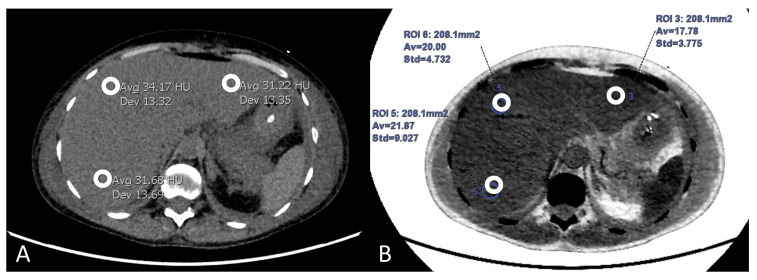
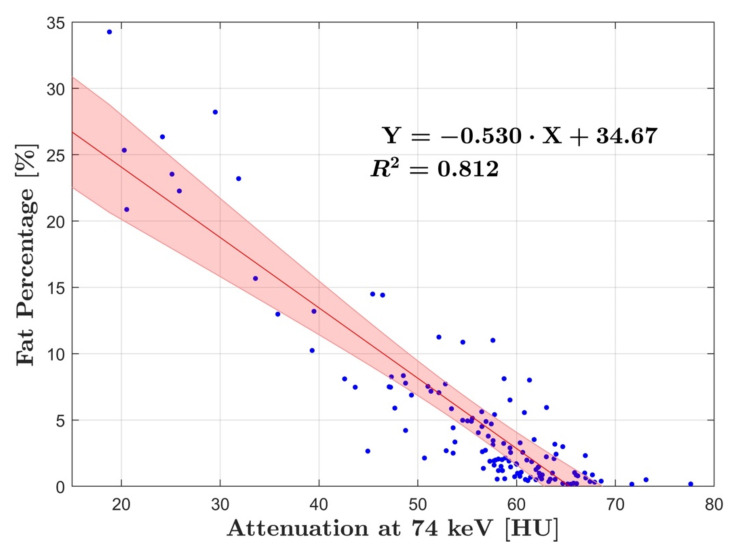
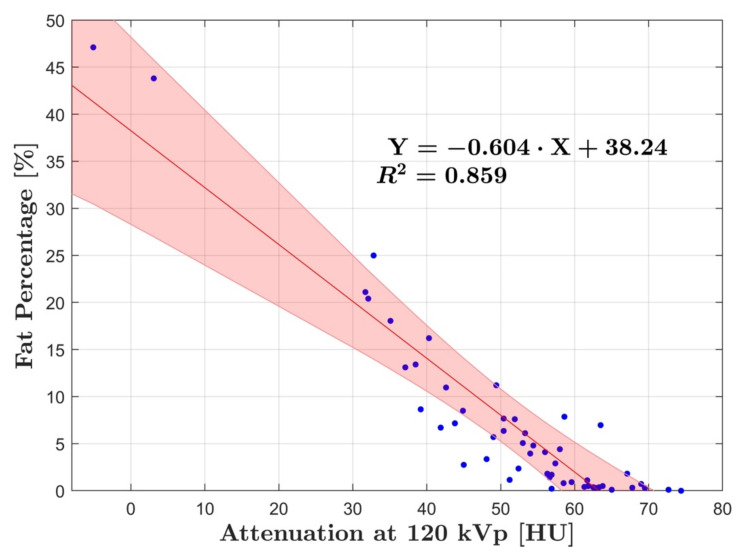
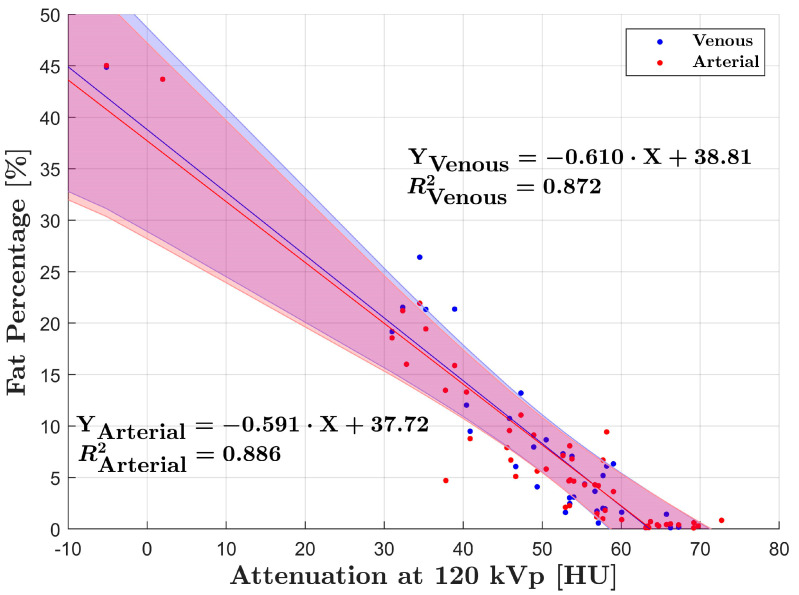
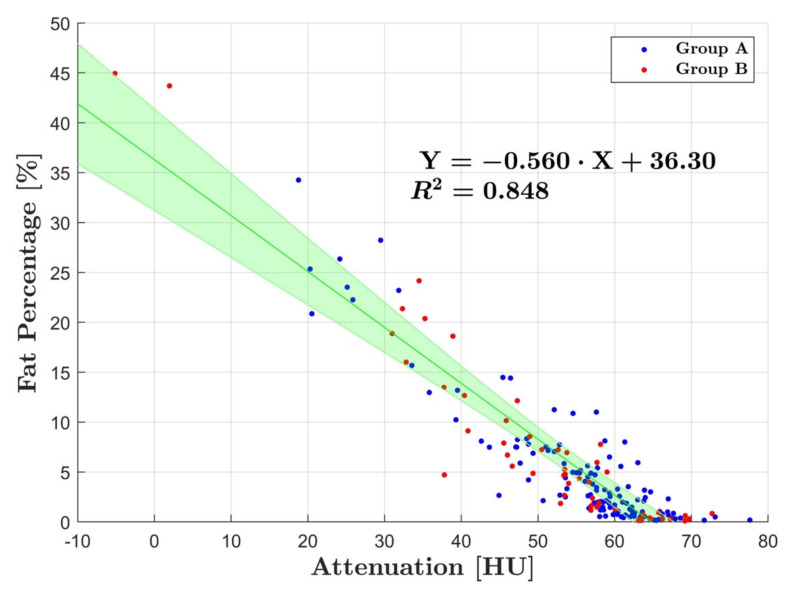
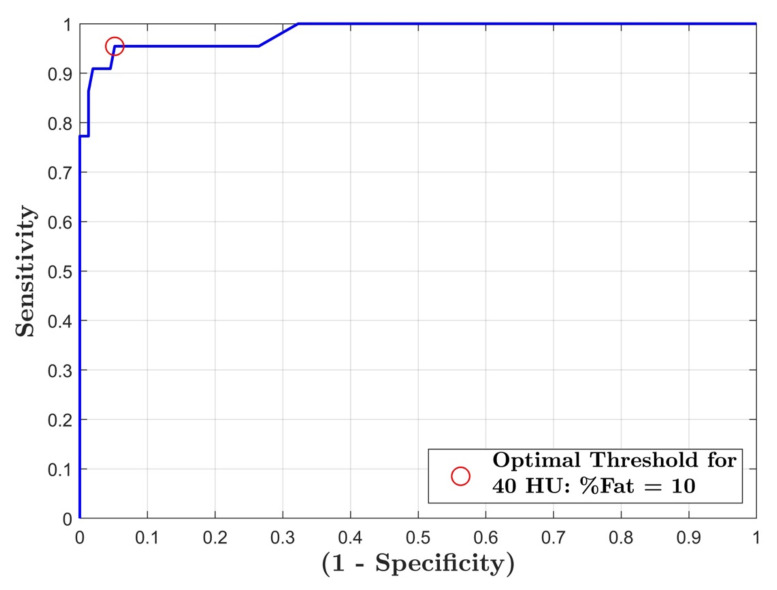
We assessed the correlation between liver fat percentage using dual-energy CT (DECT) and Hounsfield unit (HU) measurements in contrast and non-contrast CT. This study included 177 patients in two patient groups: Group A (n = 125) underwent whole body non-contrast DECT and group B (n = 52) had a multiphasic DECT including a conventional non-contrast CT. Three regions of interest were placed on each image series, one in the left liver lobe and two in the right to measure Hounsfield Units (HU) as well as liver fat percentage. Linear regression analysis was performed for each group as well as combined. Receiver operating characteristic (ROC) curve was generated to establish the optimal fat percentage threshold value in DECT for predicting a non-contrast threshold of 40 HU correlating to moderate-severe liver steatosis. We found a strong correlation between fat percentage found with DECT and HU measured in non-contrast CT in group A and B individually (R2 = 0.81 and 0.86, respectively) as well as combined (R2 = 0.85). No significant difference was found when comparing venous and arterial phase DECT fat percentage measurements in group B (p = 0.67). A threshold of 10% liver fat found with DECT had 95% sensitivity and 95% specificity for the prediction of a 40 HU threshold using non-contrast CT. In conclusion, liver fat quantification using DECT shows high correlation with HU measurements independent of scan phase.

Keywords: dual-energy CT; liver fat quantification; spectral CT.


Conflict of interest statement

The authors J.J.X. and P.S.U. have received consulting fees from GE healthcare for presenting at GE Healthcare related webinars. The other authors of this manuscript declare no relationships with any companies whose products or services may be related to the subject matter of the article.

Figures

Figure 1
Figure 1
An example of measurements from ROIs placed at three designated liver positions in the left and right liver lobe within the same patient. (A) The HU measurements for a conventional non-contrast CT scan. (B) The corresponding fat percentage measurements made within the AW software on an arterial phase reconstruction. The ROIs in (A,B) are marked with white circles.
Figure 2
Figure 2
Linear regression analysis of group A showing the relationship between fat percentage and HU at 74 keV. The analysis showed strong correlation with an R2 of 0.81. The blue dots represent the average fat and HU measurements for each patient, while the red line corresponds to the line of best fit, with the red shaded area showing the 95% CI.
Figure 3
Figure 3
Linear regression analysis of group B showing the relationship between fat percentage and. HU at 120 kVp. Strong correlation was found R2 = 0.86. The blue dots represent the average fat and HU measurements for each patient, while the red line corresponds to the line of best fit, with the red shaded area representing the 95% CI.
Figure 4
Figure 4
Linear regression analysis of arterial and venous data points for group B. Strong correlations were found for both linear regressions R2 = 0.87 (venous) and 0.89 (arterial). The red and blue lines correspond to line of best fit for each analysis. The overlapping shaded areas represent the 95% CI for each linear regression.
Figure 5
Figure 5
Linear regression analysis with group A and B combined. There was a strong correlation between fat percentage and HU with R2 = 0.85. The blue dots represent the average measurements for group A and the red for group B. The green line corresponds to line for best fit and the shaded area represents the 95% CI.
Figure 6
Figure 6
ROC curve for fat percentage threshold with a HU cut-off of 40 HU. Area under the curve (AUC) = 0.98.

Similar articles

Cited by

References

    1. Younossi Z.M., Koenig A.B., Abdelatif D., Fazel Y., Henry L., Wymer M. Global epidemiology of nonalcoholic fatty liver disease-Meta-analytic assessment of prevalence, incidence, and outcomes. Hepatology. 2016;64:73–84. doi: 10.1002/hep.28431. - DOI - PubMed
    1. Masuoka H.C., Chalasani N. Nonalcoholic fatty liver disease: An emerging threat to obese and diabetic individuals. Ann. N. Y. Acad. Sci. 2013;1281:106–122. doi: 10.1111/nyas.12016. - DOI - PMC - PubMed
    1. Stefan N., Häring H.-U., Cusi K. Non-alcoholic fatty liver disease: Causes, diagnosis, cardiometabolic consequences, and treatment strategies. Lancet Diabetes Endocrinol. 2019;7:313–324. doi: 10.1016/S2213-8587(18)30154-2. - DOI - PubMed
    1. Nassir F., Rector R.S., Hammoud G.M., Ibdah J.A. Pathogenesis and Prevention of Hepatic Steatosis. Gastroenterol. Hepatol. N. Y. 2015;11:167–175. - PMC - PubMed
    1. Zhang Y., Fowler K.J., Hamilton G., Cui J.Y., Sy E.Z., Balanay M., Hooker J.C., Szeverenyi N., Sirlin C.B. Liver fat imaging—A clinical overview of ultrasound, CT, and M R imaging. Br. J. Radiol. 2018;91:20170959. doi: 10.1259/bjr.20170959. - DOI - PMC - PubMed

LinkOut - more resources