. 2022 Mar 18;12(3):738.
doi: 10.3390/diagnostics12030738.

Comparison of CO-RADS Scores Based on Visual and Artificial Intelligence Assessments in a Non-Endemic Area

Affiliations

Comparison of CO-RADS Scores Based on Visual and Artificial Intelligence Assessments in a Non-Endemic Area

Yoshinobu Ishiwata et al. Diagnostics (Basel). .

Abstract

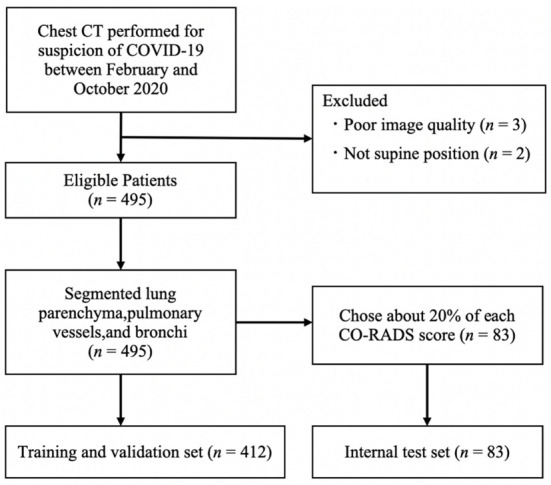
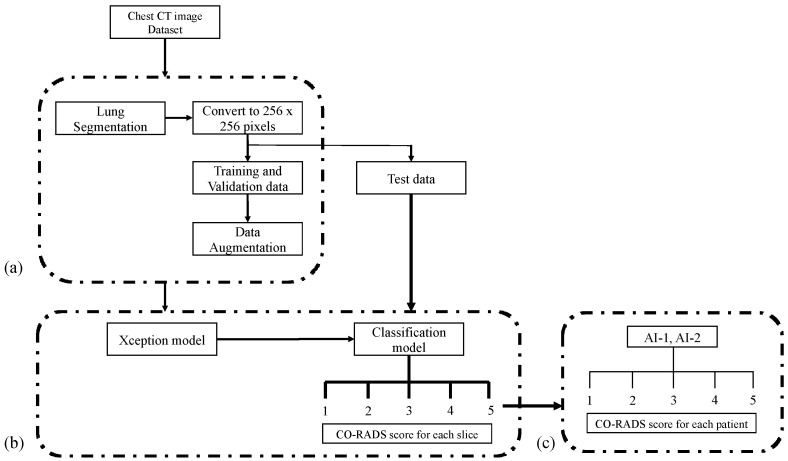
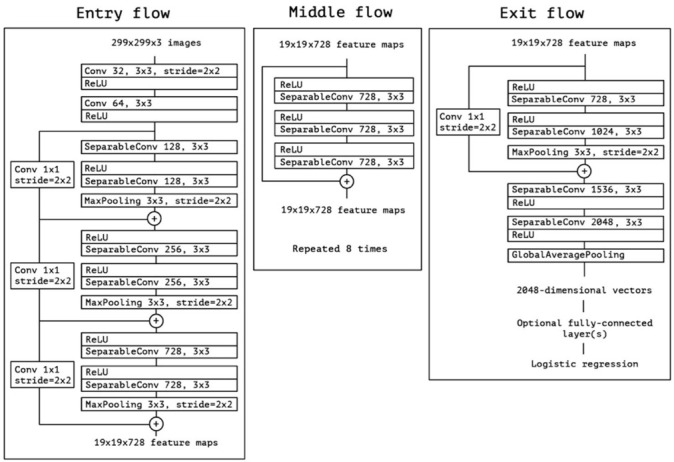
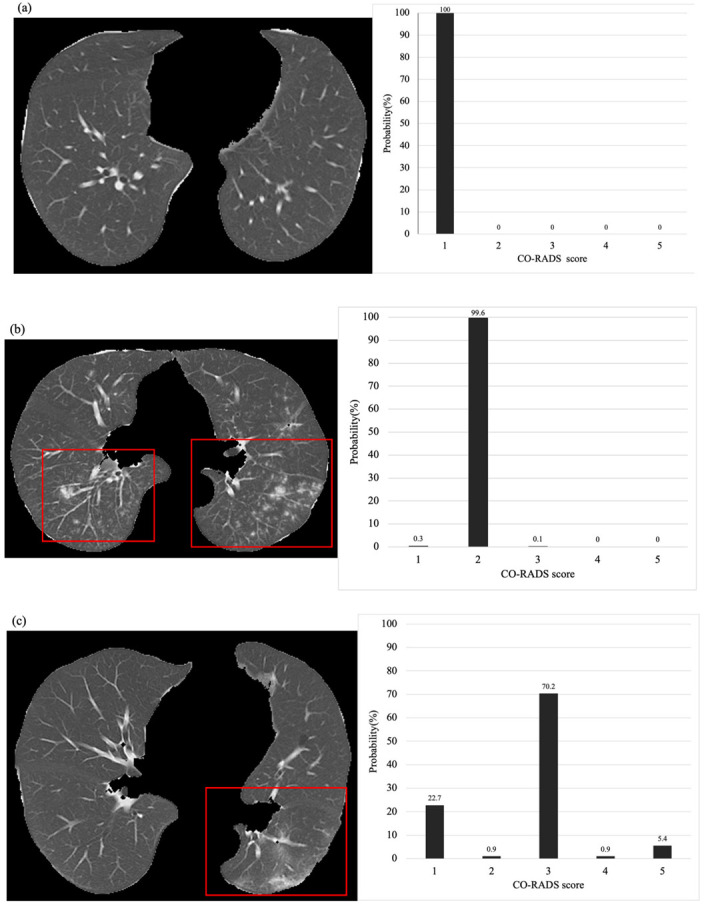
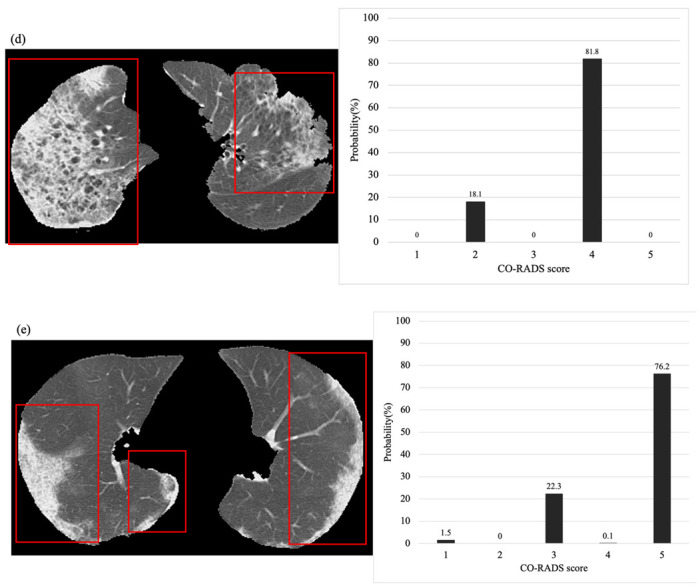
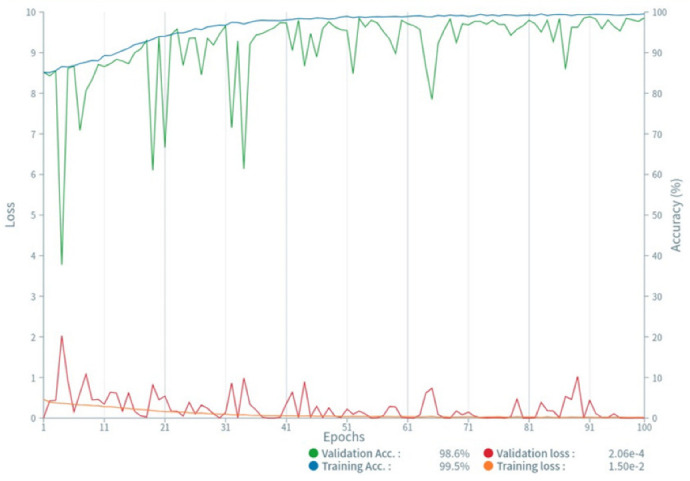
In this study, we first developed an artificial intelligence (AI)-based algorithm for classifying chest computed tomography (CT) images using the coronavirus disease 2019 Reporting and Data System (CO-RADS). Subsequently, we evaluated its accuracy by comparing the calculated scores with those assigned by radiologists with varying levels of experience. This study included patients with suspected SARS-CoV-2 infection who underwent chest CT imaging between February and October 2020 in Japan, a non-endemic area. For each chest CT, the CO-RADS scores, determined by consensus among three experienced chest radiologists, were used as the gold standard. Images from 412 patients were used to train the model, whereas images from 83 patients were tested to obtain AI-based CO-RADS scores for each image. Six independent raters (one medical student, two residents, and three board-certified radiologists) evaluated the test images. Intraclass correlation coefficients (ICC) and weighted kappa values were calculated to determine the inter-rater agreement with the gold standard. The mean ICC and weighted kappa were 0.754 and 0.752 for the medical student and residents (taken together), 0.851 and 0.850 for the diagnostic radiologists, and 0.913 and 0.912 for AI, respectively. The CO-RADS scores calculated using our AI-based algorithm were comparable to those assigned by radiologists, indicating the accuracy and high reproducibility of our model. Our study findings would enable accurate reading, particularly in areas where radiologists are unavailable, and contribute to improvements in patient management and workflow.

Keywords: artificial intelligence; coronavirus disease 2019; coronavirus disease 2019 Reporting and Data System; deep learning.


Conflict of interest statement

The authors declare no conflict of interest.

Figures

Figure 1
Figure 1
Flow diagram. Data for 500 patients who underwent chest CT for suspected COVID-19 pneumonia were collected. After exclusion, 495 eligible patients were included in the model development and evaluation. The dataset was classified into a training set (n = 412) and an independent patient-level test set (n = 83). The proportion of images with different CO-RADS scores in the test set was equivalent to that in the training set. CO-RADS; COVID-19 Reporting and Data System.
Figure 2
Figure 2
Classification workflow. (a) The collected chest CT DICOM images were subjected to lung segmentation using a workstation. The extracted lung fields were converted to images with 256 × 256 pixels and saved as PNG images, and the training images were augmented. (b) The augmented training images were subjected to the Xception model, and the test images were applied to the constructed artificial intelligence model to obtain the CO-RADS score for each slice. (c) The CO-RADS score for each patient was determined according to the defined method.
Figure 3
Figure 3
The Xception Network architecture. Reprinted with permission from ref. [22]. Copyright © 2017, IEEE.
Figure 4
Figure 4
Representative output from the classification model. (a) The CT image shows no abnormal density in both lungs. The classification model presented a 100% probability of a CO-RADS score of 1. (b) CT imaging shows multiple centrilobular nodules in both lungs. The classification model presented an approximately 99% probability of obtaining a CO-RADS score of 2. (c) The CT images show unilateral nonspecific ground-glass opacity in the dorsal aspect of the left lung. The classification model presented an approximately 70% probability of obtaining a CO-RADS score of 3. Although a score of 3 was determined, the possibility of 1 or 5 was also suggested. (d) CT imaging shows bilateral subpleural predominant ground-glass opacity and consolidation and strong emphysematous changes in the background. In classification models, a CO-RADS score of 4 is most likely. (e) The CT image shows crazy-paving-like ground-glass opacity in the bilateral subpleural areas. The classification model also presents the highest possibility of a CO-RADS score of 5.
Figure 4
Figure 4
Representative output from the classification model. (a) The CT image shows no abnormal density in both lungs. The classification model presented a 100% probability of a CO-RADS score of 1. (b) CT imaging shows multiple centrilobular nodules in both lungs. The classification model presented an approximately 99% probability of obtaining a CO-RADS score of 2. (c) The CT images show unilateral nonspecific ground-glass opacity in the dorsal aspect of the left lung. The classification model presented an approximately 70% probability of obtaining a CO-RADS score of 3. Although a score of 3 was determined, the possibility of 1 or 5 was also suggested. (d) CT imaging shows bilateral subpleural predominant ground-glass opacity and consolidation and strong emphysematous changes in the background. In classification models, a CO-RADS score of 4 is most likely. (e) The CT image shows crazy-paving-like ground-glass opacity in the bilateral subpleural areas. The classification model also presents the highest possibility of a CO-RADS score of 5.
Figure 5
Figure 5
Accuracy and loss of training and validation data. The plots of training loss and validation loss decreased to a stable point, with a small gap between them.

Similar articles

References

    1. Ai T., Yang Z., Hou H., Zhan C., Chen C., Lv W., Tao Q., Sun Z., Xia L. Correlation of chest CT and RT-PCR testing for coronavirus disease 2019 (COVID-19) in China: A report of 1014 cases. Radiology. 2020;296:E32–E40. doi: 10.1148/radiol.2020200642. - DOI - PMC - PubMed
    1. Fang Y., Zhang H., Xie J., Lin M., Ying L., Pang P., Ji W. Sensitivity of chest CT for COVID-19: Comparison to RT-PCR. Radiology. 2020;296:E115–E117. doi: 10.1148/radiol.2020200432. - DOI - PMC - PubMed
    1. Waller J.V., Kaur P., Tucker A., Lin K.K., Diaz M.J., Henry T.S., Hope M. Diagnostic tools for coronavirus disease (COVID-19): Comparing CT and RT-PCR viral nucleic acid testing. AJR Am. J. Roentgenol. 2020;215:834–838. doi: 10.2214/AJR.20.23418. - DOI - PubMed
    1. Ye Z., Zhang Y., Wang Y., Huang Z., Song B. Chest CT manifestations of new coronavirus disease 2019 (COVID-19): A pictorial review. Eur. Radiol. 2020;30:4381–4389. doi: 10.1007/s00330-020-06801-0. - DOI - PMC - PubMed
    1. Zu Z.Y., Jiang M.D., Xu P.P., Chen W., Ni Q.Q., Lu G.M., Zhang L.J. Coronavirus disease 2019 (COVID-19): A perspective from China. Radiology. 2020;296:E15–E25. doi: 10.1148/radiol.2020200490. - DOI - PMC - PubMed

LinkOut - more resources