

Comparison of Mean Corneal Power of Annular Rings and Zones Using Swept-Source Optical Coherence Tomography
- PMID: 35328307
- PMCID: PMC8946905
- DOI: 10.3390/diagnostics12030754
Comparison of Mean Corneal Power of Annular Rings and Zones Using Swept-Source Optical Coherence Tomography
Abstract
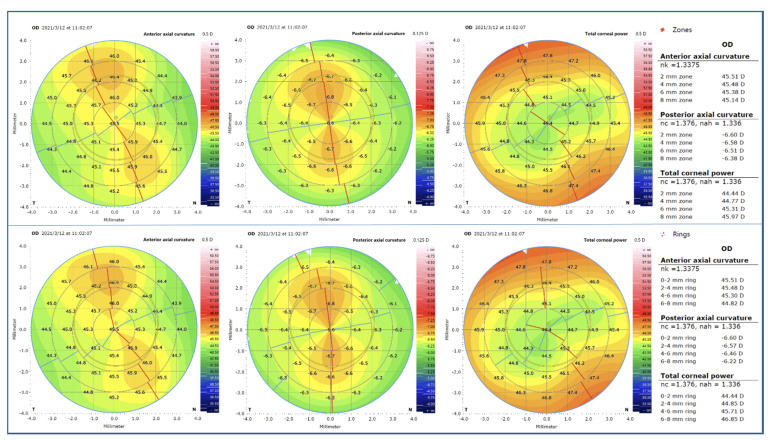
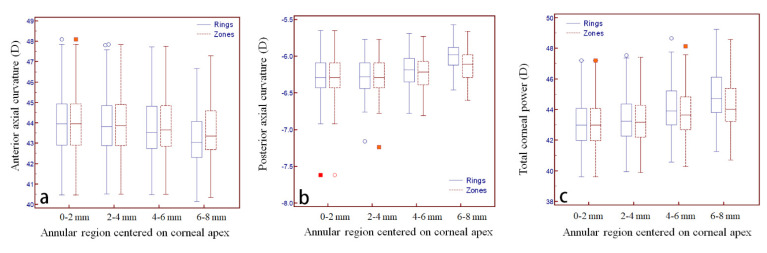
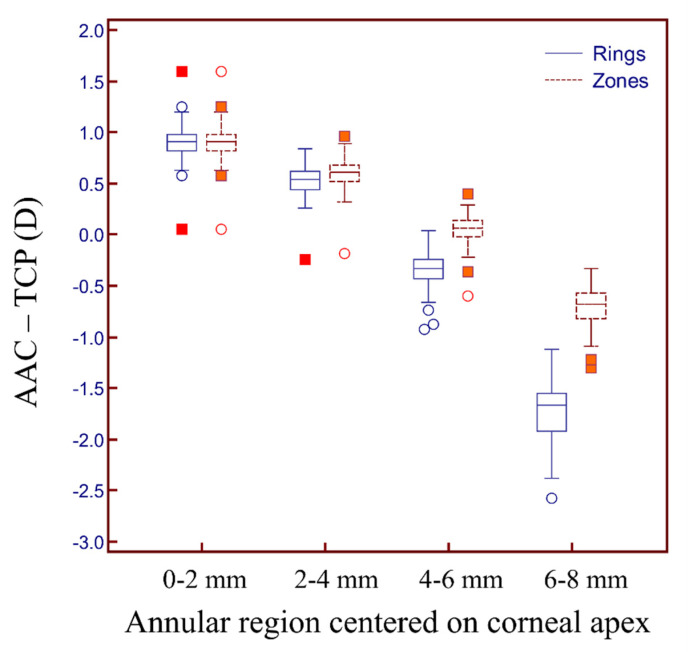
This study aims to investigate differences in the mean corneal power of annular zones (corneal power measured over the inner annular zone of difference diameters) and rings (corneal power measured over a ring of different diameters) centered on the corneal apex using the swept-source optical coherence tomography technique. The mean anterior axial curvature (AAC), posterior axial curvature (PAC), and total corneal power (TCP) centered on the corneal apex with the annular rings (0−2 mm, 2−4 mm, 4−6 mm, and 6−8 mm) and zones were assessed using the ANTERION device. The paired-sample t-test was used for data comparison. For the 0−2 mm comparison, the AAC, PAC, and TCP values of rings and zones were interchangeable. For the 2−4 mm comparison, the AAC of the rings was lower than that of the zones (p = 0.004), and the TCP values of the rings were higher than that of the zones (p < 0.001). For the 4−6 mm comparison, the AAC of the rings was lower than that of the zones (p < 0.001), and the PAC and TCP values of the rings were higher than that of the zones (both p < 0.001). For the 6−8 mm comparison, the AAC of the rings was lower than that of the zones (p < 0.001), and the PAC and TCP values of the rings were higher than that of the zones (both p < 0.001). Comparisons between AAC and TCP in each sub-region showed significant differences both in the rings (p < 0.001) and the zones (p < 0.008). Differences in the AAC, PAC, and TCP measured at different diameters (2−4 mm, 4−6 mm, and 6−8 mm) of the rings and zones, centered on the corneal apex, should be noticed in clinical practice. As the diameter increases, the difference between the rings and the zones in terms of AAC, PAC, and TCP increase as well. Clinicians should also pay attention to differences between AAC and TCP for the rings and the zones within the same annular region.
Keywords: anterior axial curvature; posterior axial curvature; rings; total cornea power; zones.
Conflict of interest statement
There are no conflict of interest to declare.
Figures
Similar articles
-
Comparison of Corneal Power and Corneal Astigmatism of Different Diameter Zones Centered on the Pupil and Corneal Apex Using Scheimpflug Tomography.Cornea. 2020 Jan;39(1):77-83. doi: 10.1097/ICO.0000000000002052. Cornea. 2020. PMID: 31335537
-
Agreement of total corneal power between 2 swept-source optical coherence tomography and Scheimpflug tomography in normal and keratoconic patients.PLoS One. 2022 May 24;17(5):e0268856. doi: 10.1371/journal.pone.0268856. eCollection 2022. PLoS One. 2022. PMID: 35609043 Free PMC article.
-
[Comparison of corneal refractive power and astigmatism measured by the new anterior segment optical coherence tomographic device and Scheimpflug imaging device in age-related cataract patients].Zhonghua Yan Ke Za Zhi. 2021 Jan 11;57(1):48-55. doi: 10.3760/cma.j.cn112142-20200904-00574. Zhonghua Yan Ke Za Zhi. 2021. PMID: 33412642 Chinese.
-
Comparison study of the axial length measured using the new swept-source optical coherence tomography ANTERION and the partial coherence interferometry IOL Master.PLoS One. 2020 Dec 31;15(12):e0244590. doi: 10.1371/journal.pone.0244590. eCollection 2020. PLoS One. 2020. PMID: 33382814 Free PMC article.
-
[A review of mathematical descriptors of corneal asphericity].J Fr Ophtalmol. 2002 Jan;25(1):81-90. J Fr Ophtalmol. 2002. PMID: 11965125 Review. French.
Cited by
-
Comparison of Corneal Power Difference Maps with Achieved Myopic Correction Using Scheimpflug Tomography After LASIK, PRK, and SMILE.Clin Ophthalmol. 2023 Jun 19;17:1717-1727. doi: 10.2147/OPTH.S419327. eCollection 2023. Clin Ophthalmol. 2023. PMID: 37361690 Free PMC article.
-
Vitreous Substitutes from Bench to the Operating Room in a Translational Approach: Review and Future Endeavors in Vitreoretinal Surgery.Int J Mol Sci. 2023 Feb 7;24(4):3342. doi: 10.3390/ijms24043342. Int J Mol Sci. 2023. PMID: 36834754 Free PMC article. Review.
References
-
- Huang D., Tang M., Wang L., Zhang X., Armour R.L., Gattey D.M., Lombardi L.H., Koch D.D. Optical coherence tomography-based corneal power measurement and intraocular lens power calculation following laser vision correction (an American Ophthalmological Society thesis) Trans. Am. Ophthalmol. Soc. 2013;111:34–45. - PMC - PubMed
-
- Asam J.S., Polzer M., Tafreshi A., Hirnschall N., Findl O. Anterior Segment OCT. In: Bille J.F., editor. High Resolution Imaging in Microscopy and Ophthalmology: New Frontiers in Biomedical Optics. Springer; Cham, Switzerland: 2019. pp. 285–299. - PubMed
-
- Grzybowski A., Kanclerz P. Recent Developments in Cataract Surgery. In: Grzybowski A., editor. Current Concepts in Ophthalmology. Springer; Cham, Switzerland: 2020.
Grants and funding
LinkOut - more resources
Full Text Sources
Research Materials
Miscellaneous
