

A Deep Learning Model for Prostate Adenocarcinoma Classification in Needle Biopsy Whole-Slide Images Using Transfer Learning
- PMID: 35328321
- PMCID: PMC8947489
- DOI: 10.3390/diagnostics12030768
A Deep Learning Model for Prostate Adenocarcinoma Classification in Needle Biopsy Whole-Slide Images Using Transfer Learning
Abstract
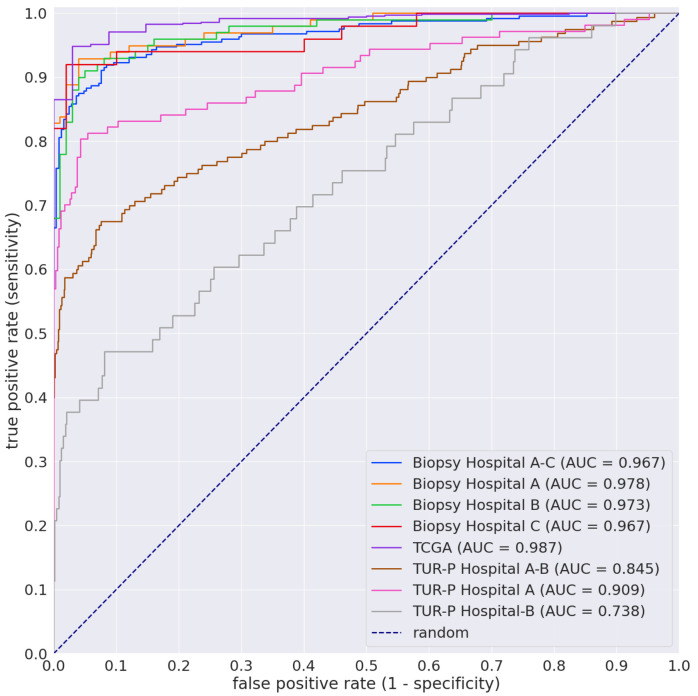
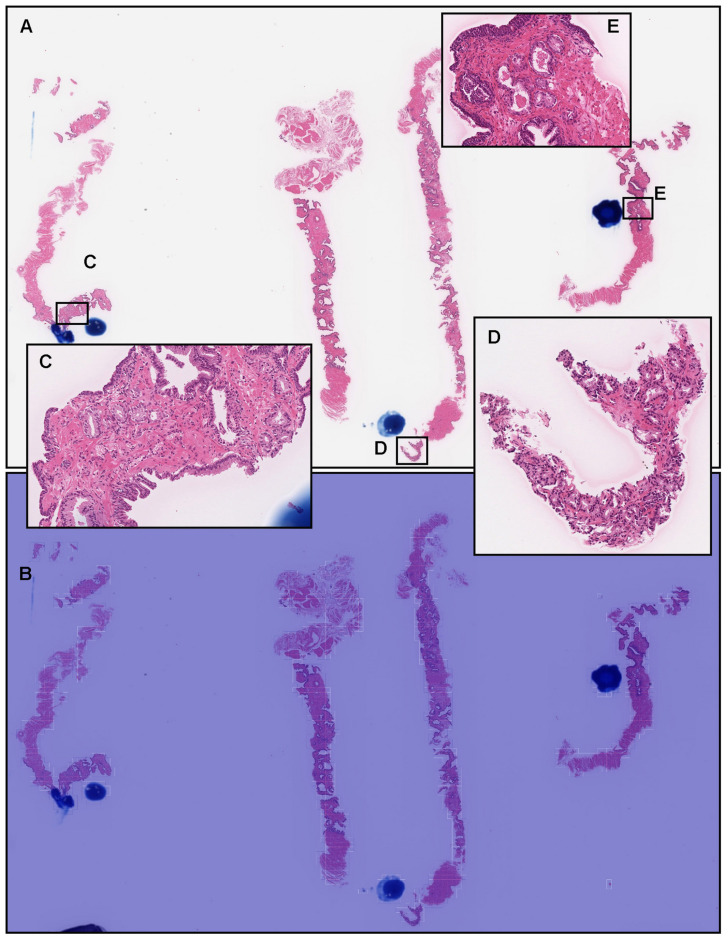
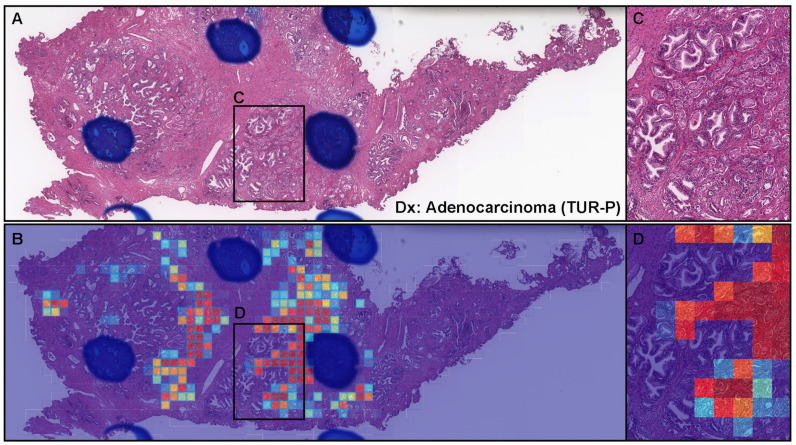
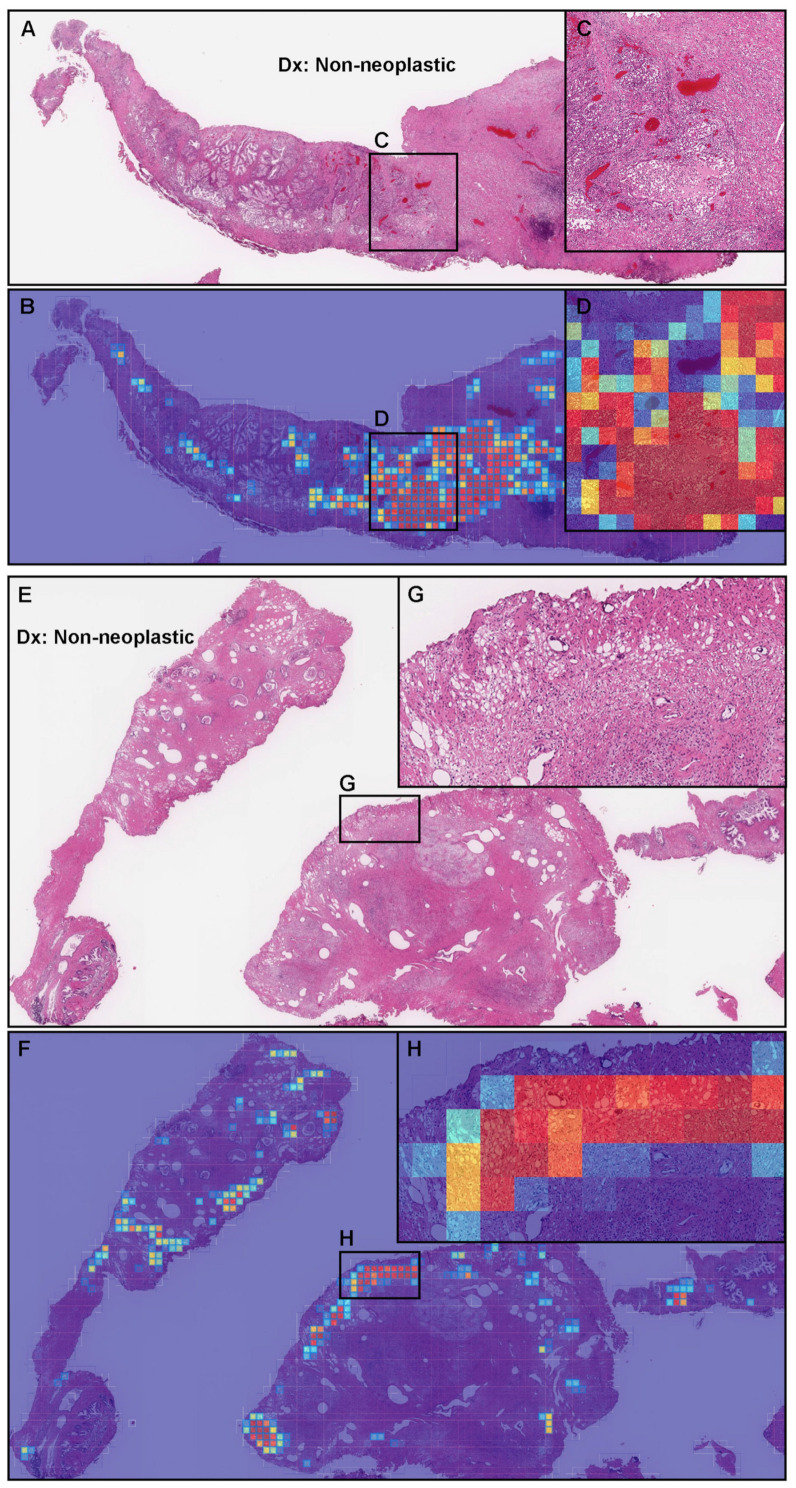
The histopathological diagnosis of prostate adenocarcinoma in needle biopsy specimens is of pivotal importance for determining optimum prostate cancer treatment. Since diagnosing a large number of cases containing 12 core biopsy specimens by pathologists using a microscope is time-consuming manual system and limited in terms of human resources, it is necessary to develop new techniques that can rapidly and accurately screen large numbers of histopathological prostate needle biopsy specimens. Computational pathology applications that can assist pathologists in detecting and classifying prostate adenocarcinoma from whole-slide images (WSIs) would be of great benefit for routine pathological practice. In this paper, we trained deep learning models capable of classifying needle biopsy WSIs into adenocarcinoma and benign (non-neoplastic) lesions. We evaluated the models on needle biopsy, transurethral resection of the prostate (TUR-P), and The Cancer Genome Atlas (TCGA) public dataset test sets, achieving an ROC-AUC up to 0.978 in needle biopsy test sets and up to 0.9873 in TCGA test sets for adenocarcinoma.
Keywords: adenocarcinoma; biopsy; deep learning; prostate; transfer learning; whole-slide image.
Conflict of interest statement
M.T. and F.K. are employees of Medmain Inc. All authors declare no competing interest.
Figures
Similar articles
-
Transfer Learning for Adenocarcinoma Classifications in the Transurethral Resection of Prostate Whole-Slide Images.Cancers (Basel). 2022 Sep 28;14(19):4744. doi: 10.3390/cancers14194744. Cancers (Basel). 2022. PMID: 36230666 Free PMC article.
-
A deep learning model for breast ductal carcinoma in situ classification in whole slide images.Virchows Arch. 2022 May;480(5):1009-1022. doi: 10.1007/s00428-021-03241-z. Epub 2022 Jan 25. Virchows Arch. 2022. PMID: 35076741
-
Weakly Supervised Learning for Poorly Differentiated Adenocarcinoma Classification in GastricEndoscopic Submucosal Dissection Whole Slide Images.Technol Cancer Res Treat. 2022 Jan-Dec;21:15330338221142674. doi: 10.1177/15330338221142674. Technol Cancer Res Treat. 2022. PMID: 36476107 Free PMC article.
-
The diagnosis and reporting of adenocarcinoma of the prostate in core needle biopsy specimens.Cancer. 1996 Jul 15;78(2):350-6. doi: 10.1002/(SICI)1097-0142(19960715)78:2<350::AID-CNCR26>3.0.CO;2-U. Cancer. 1996. PMID: 8674016 Review.
-
Deep learning for colon cancer histopathological images analysis.Comput Biol Med. 2021 Sep;136:104730. doi: 10.1016/j.compbiomed.2021.104730. Epub 2021 Aug 4. Comput Biol Med. 2021. PMID: 34375901 Review.
Cited by
-
Deep Learning Methodologies Applied to Digital Pathology in Prostate Cancer: A Systematic Review.Diagnostics (Basel). 2023 Aug 14;13(16):2676. doi: 10.3390/diagnostics13162676. Diagnostics (Basel). 2023. PMID: 37627935 Free PMC article. Review.
-
Transfer Learning for Adenocarcinoma Classifications in the Transurethral Resection of Prostate Whole-Slide Images.Cancers (Basel). 2022 Sep 28;14(19):4744. doi: 10.3390/cancers14194744. Cancers (Basel). 2022. PMID: 36230666 Free PMC article.
-
Inference of core needle biopsy whole slide images requiring definitive therapy for prostate cancer.BMC Cancer. 2023 Jan 5;23(1):11. doi: 10.1186/s12885-022-10488-5. BMC Cancer. 2023. PMID: 36600203 Free PMC article.
-
Automated Cellular-Level Dual Global Fusion of Whole-Slide Imaging for Lung Adenocarcinoma Prognosis.Cancers (Basel). 2023 Oct 1;15(19):4824. doi: 10.3390/cancers15194824. Cancers (Basel). 2023. PMID: 37835518 Free PMC article.
-
Histopathology-Based Prostate Cancer Classification Using ResNet: A Comprehensive Deep Learning Analysis.J Imaging Inform Med. 2025 May 20. doi: 10.1007/s10278-025-01543-1. Online ahead of print. J Imaging Inform Med. 2025. PMID: 40394318
References
LinkOut - more resources
Full Text Sources
