

Early Effects of Extracellular Vesicles Secreted by Adipose Tissue Mesenchymal Cells in Renal Ischemia Followed by Reperfusion: Mechanisms Rely on a Decrease in Mitochondrial Anion Superoxide Production
- PMID: 35328327
- PMCID: PMC8955255
- DOI: 10.3390/ijms23062906
Early Effects of Extracellular Vesicles Secreted by Adipose Tissue Mesenchymal Cells in Renal Ischemia Followed by Reperfusion: Mechanisms Rely on a Decrease in Mitochondrial Anion Superoxide Production
Abstract
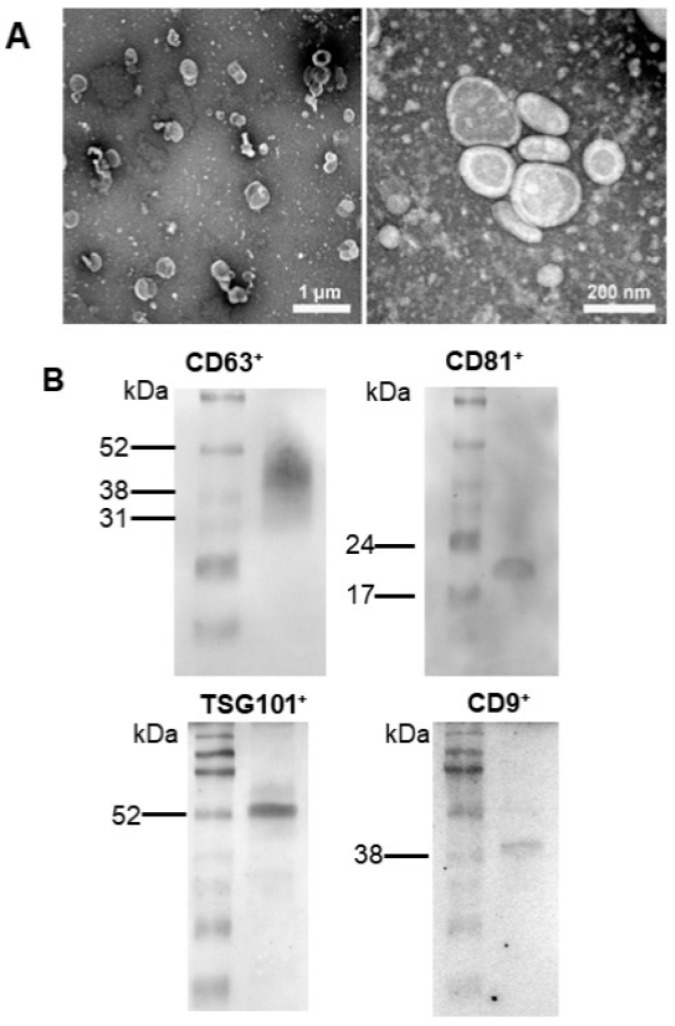
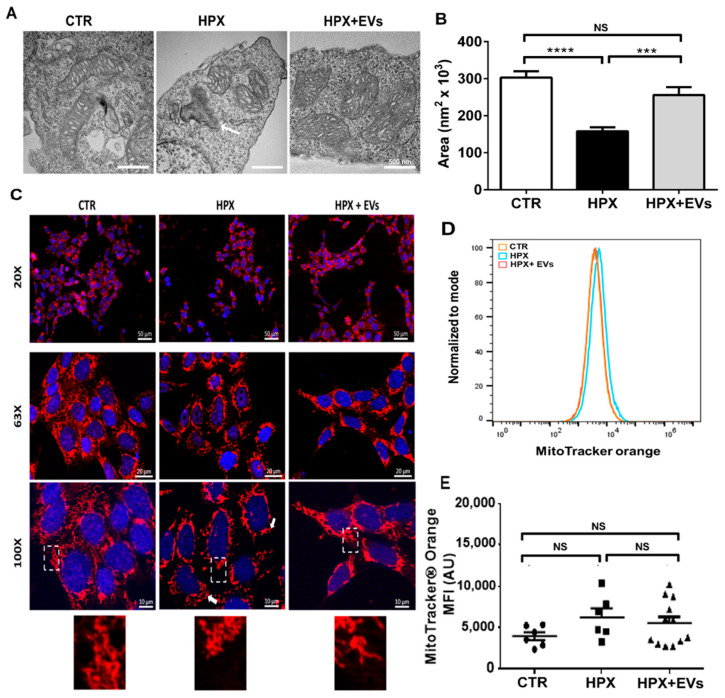
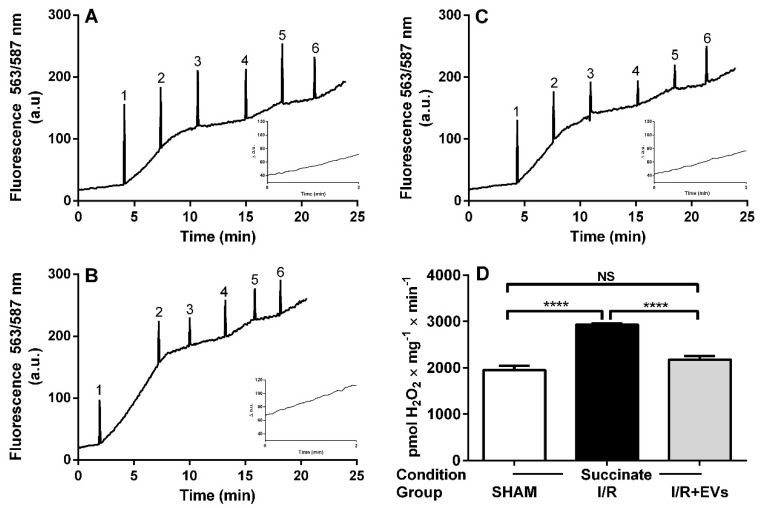
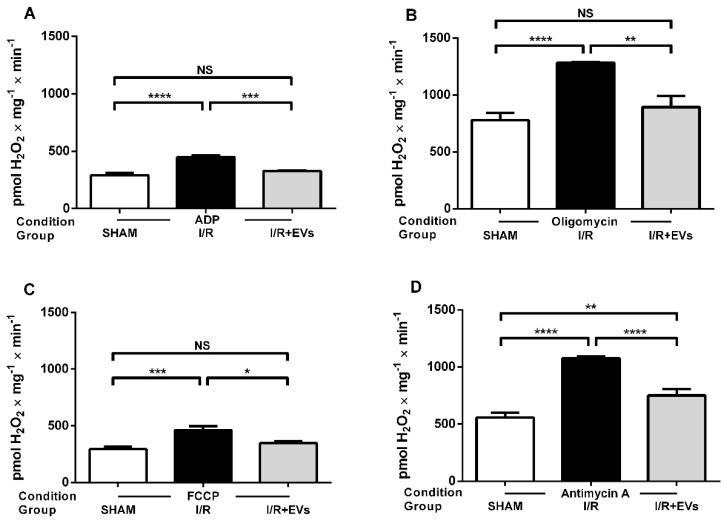
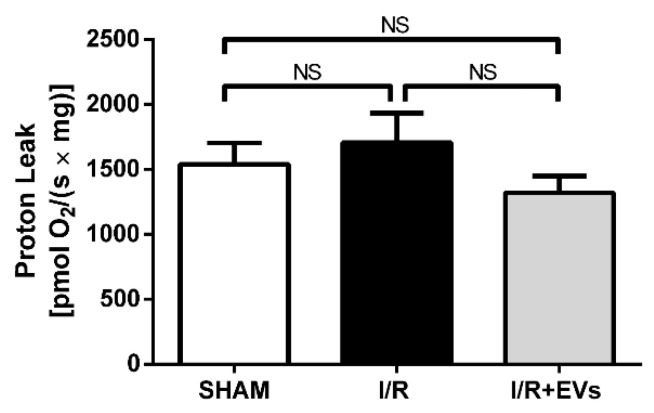
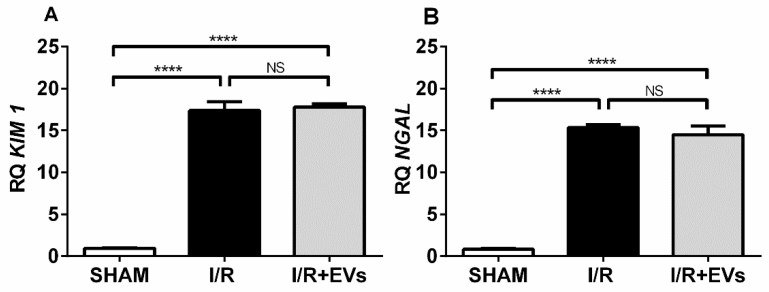
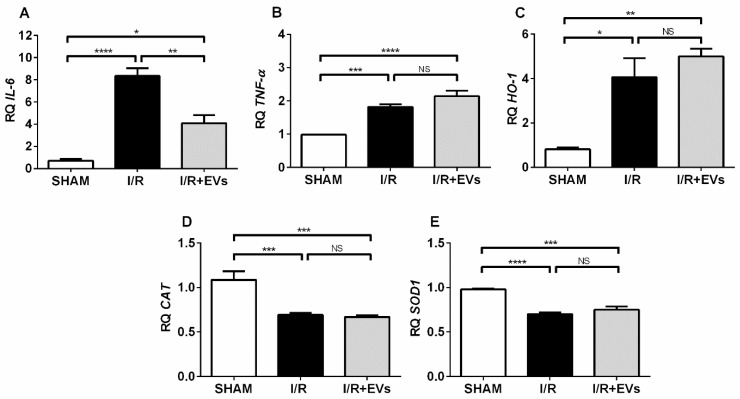
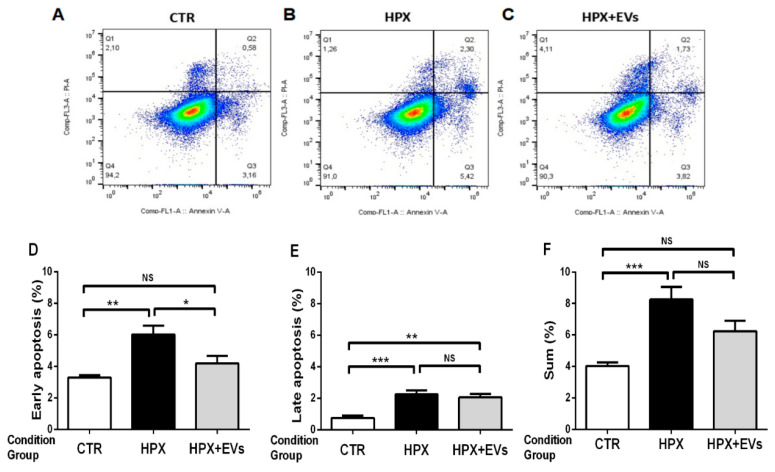
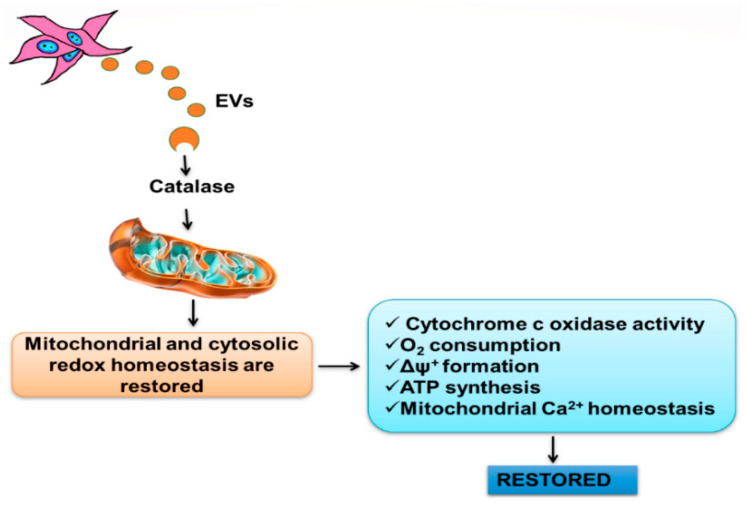
Acute kidney injury (AKI) caused by ischemia followed by reperfusion (I/R) is characterized by intense anion superoxide (O2•-) production and oxidative damage. We investigated whether extracellular vesicles secreted by adipose tissue mesenchymal cells (EVs) administered during reperfusion can suppress the exacerbated mitochondrial O2•- formation after I/R. We used Wistar rats subjected to bilateral renal arterial clamping (30 min) followed by 24 h of reperfusion. The animals received EVs (I/R + EVs group) or saline (I/R group) in the kidney subcapsular space. The third group consisted of false-operated rats (SHAM). Mitochondria were isolated from proximal tubule cells and used immediately. Amplex Red™ was used to measure mitochondrial O2•- formation and MitoTracker™ Orange to evaluate inner mitochondrial membrane potential (Δψ). In vitro studies were carried out on human renal proximal tubular cells (HK-2) co-cultured or not with EVs under hypoxic conditions. Administration of EVs restored O2•- formation to SHAM levels in all mitochondrial functional conditions. The gene expression of catalase and superoxide dismutase-1 remained unmodified; transcription of heme oxygenase-1 (HO-1) was upregulated. The co-cultures of HK-2 cells with EVs revealed an intense decrease in apoptosis. We conclude that the mechanisms by which EVs favor long-term recovery of renal structures and functions after I/R rely on a decrease of mitochondrial O2•- formation with the aid of the upregulated antioxidant HO-1/Nuclear factor erythroid 2-related factor 2 system, thus opening new vistas for the treatment of AKI.
Keywords: acellular therapy; anion superoxide; extracellular vesicles; mesenchymal cells; mitochondria; proximal tubular cells; regenerative medicine; renal ischemia/reperfusion.
Conflict of interest statement
The authors declare that the research was conducted in the absence of any commercial or financial relationships that could represent potential conflicts of interest.
Figures
Similar articles
-
Adipose-Derived Mesenchymal Stromal Cells Under Hypoxia: Changes in Extracellular Vesicles Secretion and Improvement of Renal Recovery after Ischemic Injury.Cell Physiol Biochem. 2019;52(6):1463-1483. doi: 10.33594/000000102. Cell Physiol Biochem. 2019. PMID: 31099507
-
In Vivo Tracking of Mesenchymal Stem Cell-Derived Extracellular Vesicles Improving Mitochondrial Function in Renal Ischemia-Reperfusion Injury.ACS Nano. 2020 Apr 28;14(4):4014-4026. doi: 10.1021/acsnano.9b08207. Epub 2020 Apr 3. ACS Nano. 2020. PMID: 32212674
-
Hypoxic mesenchymal stem cell-derived extracellular vesicles ameliorate renal fibrosis after ischemia-reperfusion injure by restoring CPT1A mediated fatty acid oxidation.Stem Cell Res Ther. 2022 May 7;13(1):191. doi: 10.1186/s13287-022-02861-9. Stem Cell Res Ther. 2022. PMID: 35526054 Free PMC article.
-
Acute Kidney Injury by Ischemia/Reperfusion and Extracellular Vesicles.Int J Mol Sci. 2023 Oct 18;24(20):15312. doi: 10.3390/ijms242015312. Int J Mol Sci. 2023. PMID: 37894994 Free PMC article. Review.
-
Extracellular vesicles for ischemia/reperfusion injury-induced acute kidney injury: a systematic review and meta-analysis of data from animal models.Syst Rev. 2022 Sep 8;11(1):197. doi: 10.1186/s13643-022-02003-5. Syst Rev. 2022. PMID: 36076305 Free PMC article.
Cited by
-
Human umbilical cord mesenchymal stem cells-derived extracellular vesicles ameliorate kidney ischemia-reperfusion injury by suppression of senescent tubular epithelial cells: experimental study.Int J Surg. 2025 Jan 1;111(1):394-410. doi: 10.1097/JS9.0000000000002074. Int J Surg. 2025. PMID: 39236098 Free PMC article.
-
Effects and Mechanisms of Extracellular Vesicles in Different Models of Acute Kidney Injury.Stem Cells Int. 2025 Mar 24;2025:1075016. doi: 10.1155/sci/1075016. eCollection 2025. Stem Cells Int. 2025. PMID: 40165854 Free PMC article. Review.
-
Emerging Frontiers in acute kidney injury: The role of extracellular vesicles.Bioact Mater. 2025 Feb 18;48:149-170. doi: 10.1016/j.bioactmat.2025.02.018. eCollection 2025 Jun. Bioact Mater. 2025. PMID: 40046015 Free PMC article. Review.
-
Extracellular vesicles: opening up a new perspective for the diagnosis and treatment of mitochondrial dysfunction.J Nanobiotechnology. 2024 Aug 14;22(1):487. doi: 10.1186/s12951-024-02750-8. J Nanobiotechnology. 2024. PMID: 39143493 Free PMC article. Review.
References
MeSH terms
Substances
Grants and funding
- E-26/202.963/2017/Carlos Chagas Filho Rio de Janeiro Research State Foundation/FAPERJ
- E-26/200.866/2021/Carlos Chagas Filho Rio de Janeiro Research State Foundation/FAPERJ
- E-26/202.312/2021/Carlos Chagas Filho Rio de Janeiro Research State Foundation/FAPERJ
- 465656/2014-5/National Institute of Science and Technology for Regenerative Medicine/REGENERA
- 311578/2019-5/Brazilian National Research Council/CNPq
