. 2022 Mar 8;23(6):2918.
doi: 10.3390/ijms23062918.

Sodium-Iodate Injection Can Replicate Retinal Degenerative Disease Stages in Pigmented Mice and Rats: Non-Invasive Follow-Up Using OCT and ERG

Affiliations

Sodium-Iodate Injection Can Replicate Retinal Degenerative Disease Stages in Pigmented Mice and Rats: Non-Invasive Follow-Up Using OCT and ERG

Céline Koster et al. Int J Mol Sci. .

Abstract

Purpose: The lack of suitable animal models for (dry) age-related macular degeneration (AMD) has hampered therapeutic research into the disease, so far. In this study, pigmented rats and mice were systematically injected with various doses of sodium iodate (SI). After injection, the retinal structure and visual function were non-invasively characterized over time to obtain in-depth data on the suitability of these models for studying experimental therapies for retinal degenerative diseases, such as dry AMD.

Methods: SI was injected into the tail vein (i.v.) using a series of doses (0-70 mg/kg) in adolescent C57BL/6J mice and Brown Norway rats. The retinal structure and function were assessed non-invasively at baseline (day 1) and at several time points (1-3, 5, and 10-weeks) post-injection by scanning laser ophthalmoscopy (SLO), optical coherence tomography (OCT), and electroretinography (ERG).

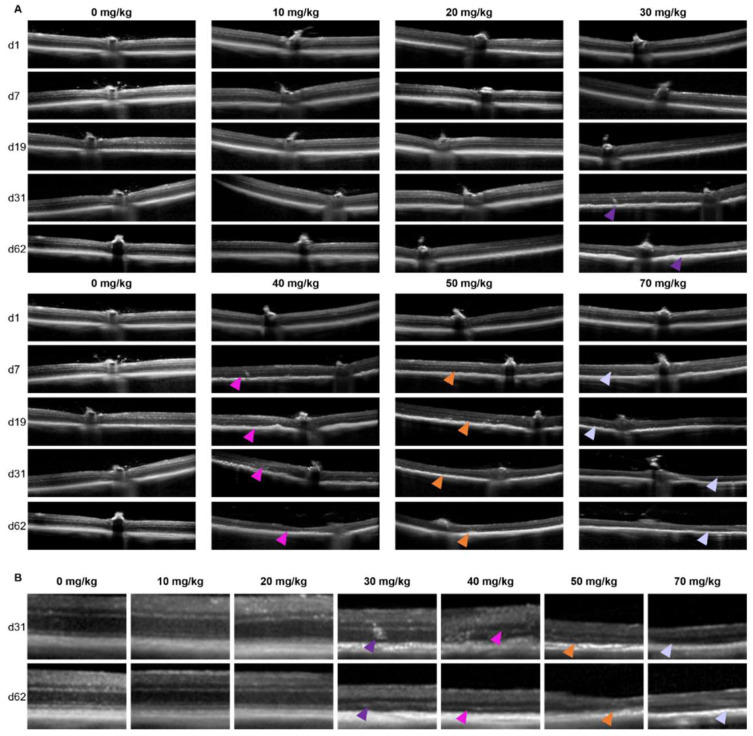
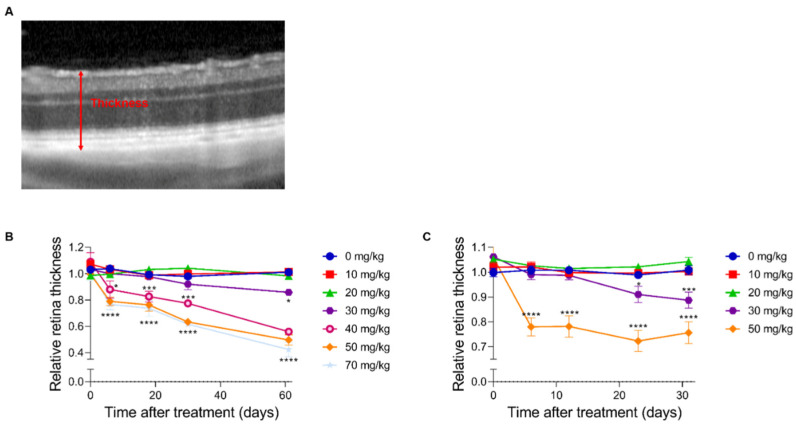
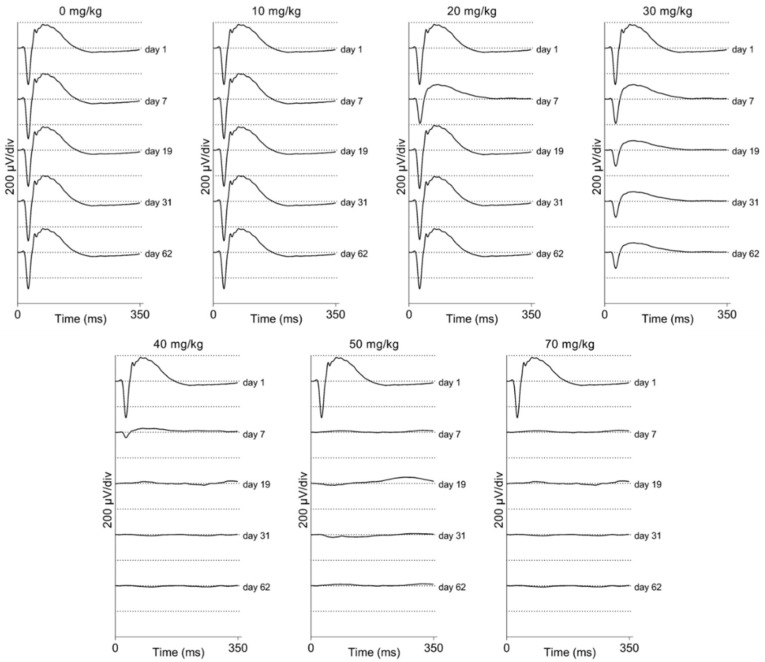
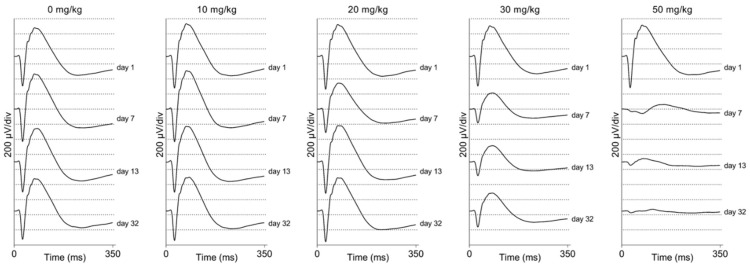
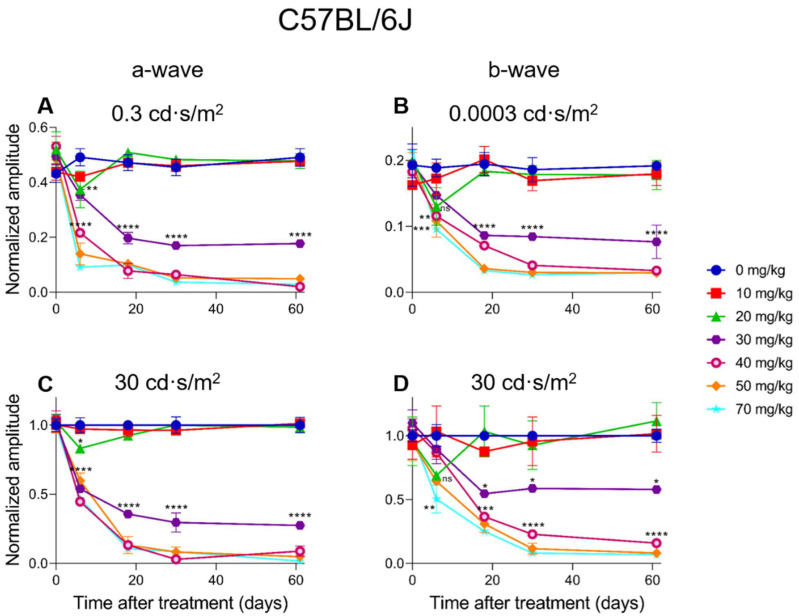
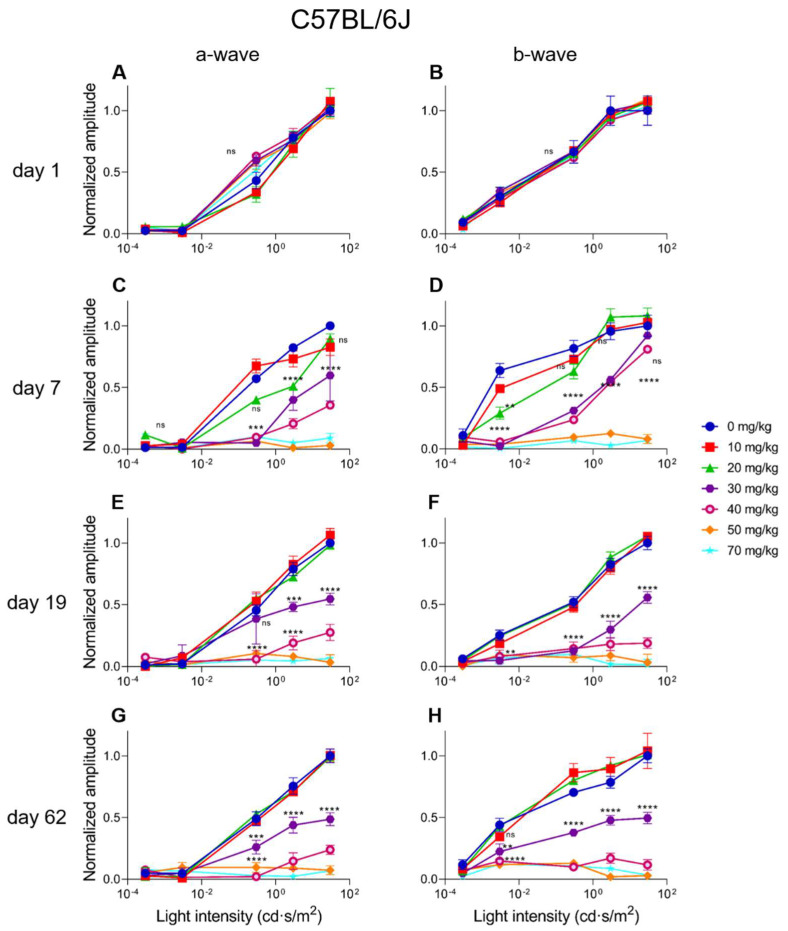
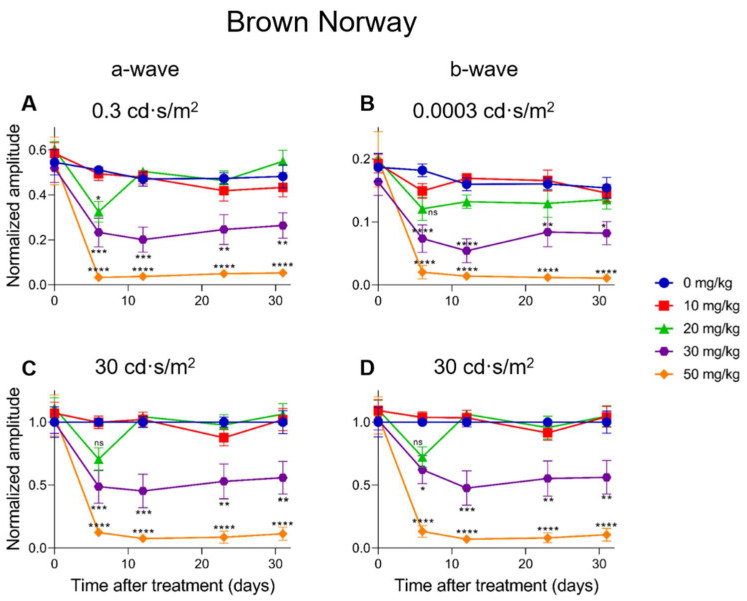
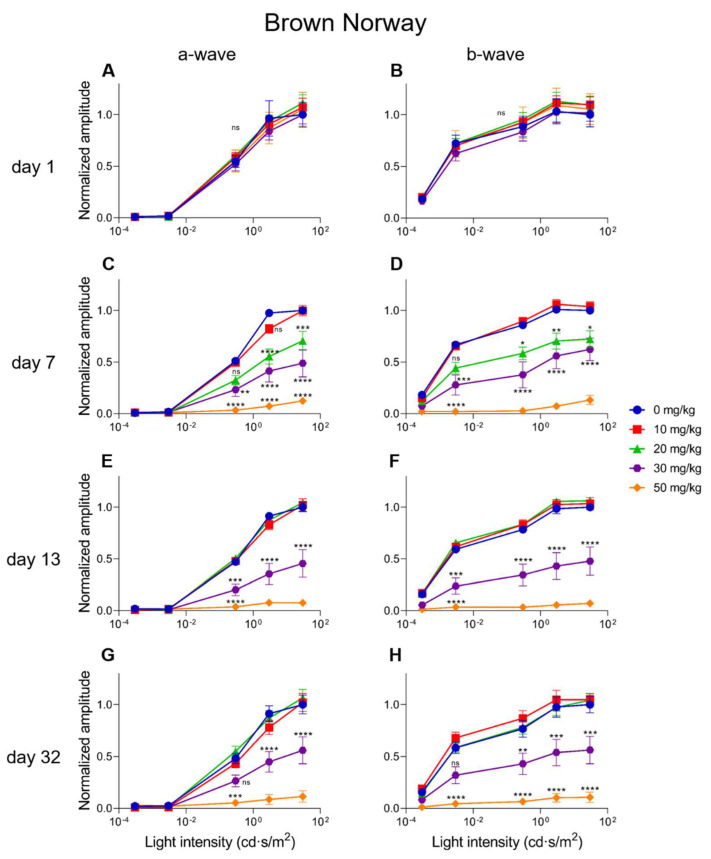
Results: After the SI injection, retinal degeneration in mice and rats yielded similar results. The lowest dose (10 mg/kg) resulted in non-detectable structural or functional effects. An injection with 20 mg/kg SI did not result in an evident retinal degeneration as judged from the OCT data. In contrast, the ERG responses were temporarily decreased but returned to baseline within two-weeks. Higher doses (30, 40, 50, and 70 mg/kg) resulted in moderate to severe structural RPE and retinal injury and decreased the ERG amplitudes, indicating visual impairment in both mice and rat strains.

Conclusions: After the SI injections, we observed dose-dependent structural and functional pathological effects on the retinal pigment epithelium (RPE) and retina in the pigmented mouse and rat strains that were used in this study. Similar effects were observed in both species. In particular, a dose of 30 mg/kg seems to be suitable for future studies on developing experimental therapies. These relatively easily induced non-inherited models may serve as useful tools for evaluating novel therapies for RPE-related retinal degenerations, such as AMD.

Keywords: Brown Norway; C57BL/6J; ERG; OCT; macula degeneration; mouse; rat; retinal degeneration; retinal pigment epithelium; rodent; sodium iodate.


Conflict of interest statement

The authors declare no conflict of interest.

Figures

Figure 1
Figure 1
Representative serial OCT images of C57BL/6J mice of the central retina (A) and a magnification at the later timepoints (B) are shown. Serial scans are shown from single animals within the treatment group. In panel (A) the doses are horizontally shown in increasing concentration. The day of follow-up is shown vertically. No clear effects were observed for the 10 and 20 mg/kg groups compared to the control. Retinal degenerations was observed in all other groups. This is also better visible in panel (B), where the zoomed-in scans are shown per concentration SI (horizontally) and the later follow-up times (vertically). In the 30 mg/kg treatment group, retinal thinning started to show roughly 1 month post-injection (purple arrows). More drastic effects at the end of the experiments were observed for the 40 (pink arrows), 50 (orange arrows) and 70 mg/kg (lilac arrows) treatment groups. Quantification of the overall retinal thickness is shown in Figure 3.
Figure 2
Figure 2
Representative serial OCT images of Brown Norway rats of the central retina (A) and a magnification at the later time points (B) are shown. Serial scans are shown from single animals within the treatment group. In panel (A) the doses are vertically shown in increasing concentration. The day of the follow-up is shown horizontally. No clear effects were observed for the 10 and 20 mg/kg groups compared to the control. Retinal degeneration is observed in both the 30 (purple arrows) and 50 mg/kg (orange arrows) groups at the later time points. Quantification of the overall retinal thickness is shown in Figure 3.
Figure 3
Figure 3
A quantitative analysis of the full retina thickness. The degeneration after SI injection was quantified in C57BL/6J mice (B) and Brown Norway rats (C) using the full thickness of the retina (red arrow) (A) (n = 4 per group). No significant effects were observed in both species for the 10 and 20 mg/kg treatment group compared to the control group (0 mg/kg). At two months post-injection, a thickness of ±90% of its original thickness was observed in the 30 mg/kg treatment group. More dramatic effects were observed in the higher treatment groups (40, 50, and 70 mg/kg). The degeneration started to show within a week post-injection. A relative thickness of 40–60% was observed two months post-injection. The results are presented as the mean ± the standard deviation. *: p ≤ 0.05, ***: p ≤ 0.001 and ****: p ≤ 0.0001.
Figure 4
Figure 4
Averaged scotopic electroretinograms are shown for C57BL/6J mice (n = 4 per group). The averaged traces per treatment group and per day of follow-up are plotted. No difference can be observed between the 10 mg/kg group and the control group by eye. A temporary effect was seen for the 20 mg/kg group: a slightly decreased response was seen a week post-injection. A moderate effect was seen for the 30 mg/kg group: decreased responses were observed from seven-days post-injection onwards. This effect is larger later in time but seems stable after one-month post-injection. Direct and drastic effects were observed for higher treatment groups (40, 50, and 70 mg/kg). ERG responses were (almost) completely not recordable from one-week post-injection onwards. Similar effects were observed in ERG recordings from Brown Norway rats (Figure 5).
Figure 5
Figure 5
Averaged scotopic electroretinograms are shown for Brown Norway rats (n = 4 per group). The averaged traces per treatment group and per day of follow-up are plotted. No difference could be observed between the 10 mg/kg group and the control group by eye. A temporary effect was seen for the 20 mg/kg group: a slightly decreased response was seen a week post-injection. A moderate effect was seen for the 30 mg/kg group: decreased responses were observed from seven-days post-injection onwards. Direct and drastic effects were observed for the higher treatment group (50 mg/kg). The ERG responses were hardly recordable from one-week post-injection onwards. Similar effects were observed in the ERG recordings from C57BL/6J mice (Figure 4).
Figure 6
Figure 6
The normalized a- wave (A,C) and b-wave (B,D) amplitudes are plotted versus the time after treatment for all the treatment groups in C57BL/6J mice (n = 4 per group). The amplitudes are shown measured at 0.3 cd·s/m2 (A) and 30 cd·s/m2 (C) (a-wave) and 0.0003 cd·s/m2 (B) and 30 cd·s/m2 (D) (b-wave) including the standard deviations. No significant effect was observed for the 10 mg/kg group compared to the control. Although not significant for the b-wave, a temporary effect, and significant for the a-wave amplitude, was seen for the 20 mg/kg treatment group (A,C). This effect was not observed anymore later in the experiment. From seven-days post-injection onwards, significant decreased responses were observed for all the other treatment groups. The effects of the 30 mg/kg group was moderate and more prominently visible in the a-wave amplitude compared to the b-wave amplitude for both light intensities. Tremendous effects were seen for the higher treatment groups (40, 50, and 70 mg/kg). From three-weeks post-injection onwards, almost non-detectable a-wave amplitudes were observed and extremely decreased b-wave amplitudes. ns: not significant, *: p ≤ 0.05, **: p ≤ 0.01, ***: p ≤ 0.001, and ****: p ≤ 0.0001.
Figure 7
Figure 7
The normalized a-wave (A,C,E,G) and b-wave (B,D,F,H) amplitudes are plotted versus the light intensity for all the treatment groups in C57BL/6J mice (n = 4 per group). The amplitudes are shown ± the standard deviations. No significant differences can be observed at day 1 (baseline) between all the treatment groups. The treatment effects started to show from seven-days post-injection onwards. A slight effect was observed for the 20 mg/kg treatment group for both the a- and b-wave. The 30 and 40 mg/kg caused similar and moderate effects, and 50 and 70 mg/kg caused more extreme decreased amplitudes. From day 19 onwards, more long-term effects were visible. No significant differences were observed between the control, 10 mg/kg and 20 mg/kg groups. A significant and moderate effect was observed for the 30 mg/kg treatment group. Injection of 30 mg/kg SI caused a reduction of the a- and b-wave amplitudes of roughly 50% at least up to two-months post-injection. More extreme effects were observed for the higher doses (40, 50 and 70 mg/kg). Reduced responses to 20% to non-recordable ERG responses were observed in these groups. ns: not significant, **: p ≤ 0.01, ***: p ≤ 0.001, and ****: p ≤ 0.0001.
Figure 8
Figure 8
The normalized a-wave (A,C) and b-wave (B,D) amplitudes are plotted versus the time after treatment for all treatment groups in Brown Norway rats (n = 4 per group). The amplitudes are shown measured at 0.3 cd·s/m2 and 30 cd·s/m2 (a-wave) and 0.0003 cd·s/m2 and 30 cd·s/m2 (b-wave) including the standard deviations. No significant effect was observed for the 10 mg/kg group compared to the control. Although not always significant, a temporary effect and significant for the a-wave amplitude at 0.3 cd·s/m2 was seen for the 20 mg/kg treatment group. This effect was not observed anymore later in the experiment. From seven-days post-injection onwards, significantly decreased responses were observed for all the other treatment groups. The effects of the 30 mg/kg group were moderate for both the a- and b-wave amplitudes at all light intensities. A tremendous effect was seen for the higher treatment group (50 mg/kg). From one-week post-injection onwards, the recorded a- and b-wave amplitudes decreased to less than 10% of the original value. ns: not significant, *: p ≤ 0.05, **: p ≤ 0.01, ***: p ≤ 0.001, and ****: p ≤ 0.0001.
Figure 9
Figure 9
The normalized a-wave (A,C,E,G) and b-wave (B,D,F,H) amplitudes are plotted versus the light intensity for all the treatment groups in Brown Norway rats (n = 4 per group). The amplitudes are shown ± the standard deviations. No significant differences could be observed at day one (baseline) between all the treatment groups. The treatment effects started to show from seven-days post-injection onwards. A significant and clear effect was observed for the 20 mg/kg treatment group for both the a- and b-wave. A 30 mg/kg dose caused moderate effects, and 50 mg/kg caused more extreme decreased amplitudes. From day 13 onwards, more long-term effects were visible. No significant differences were observed (anymore) between the control, 10 mg/kg, and 20 mg/kg groups. A significant, stable, and moderate effect was observed for the 30 mg/kg treatment group. Injection of 30 mg/kg SI caused a reduction of the a- and b-wave amplitudes of roughly 50% at least up to one-month post-injection. More extreme effects were observed for the higher dose (50 mg/kg). Almost non-recordable ERG responses were observed in this group. ns: not significant, *: p ≤ 0.05, **: p ≤ 0.01, ***: p ≤ 0.001, and ****: p ≤ 0.0001.3.

Similar articles

Cited by

References

    1. Garcia-Layana A., Cabrera-Lopez F., Garcia-Arumi J., Arias-Barquet L., Ruiz-Moreno J.M. Early and intermediate age-related macular degeneration: Update and clinical review. Clin. Interv. Aging. 2017;12:1579–1587. doi: 10.2147/CIA.S142685. - DOI - PMC - PubMed
    1. Fleckenstein M., Keenan T.D.L., Guymer R.H., Chakravarthy U., Schmitz-Valckenberg S., Klaver C.C., Wong W.T., Chew E.Y. Age-related macular degeneration. Nat. Rev. Dis. Primers. 2021;7:31. doi: 10.1038/s41572-021-00265-2. - DOI - PubMed
    1. Gorin M.B., Breitner J.C., De Jong P.T., Hageman G.S., Klaver C.C., Kuehn M.H., Seddon J.M. The genetics of age-related macular degeneration. Mol. Vis. 1999;5:29. - PubMed
    1. Klein R., Myers C.E., Buitendijk G.H., Rochtchina E., Gao X., de Jong P.T., Sivakumaran T.A., Burlutsky G., McKean-Cowdin R., Hofman A., et al. Lipids, lipid genes, and incident age-related macular degeneration: The three continent age-related macular degeneration consortium. Am. J. Ophthalmol. 2014;158:513–524.e3. doi: 10.1016/j.ajo.2014.05.027. - DOI - PMC - PubMed
    1. de Jong P.T. Age-related macular degeneration. N. Engl. J. Med. 2006;355:1474–1485. doi: 10.1056/NEJMra062326. - DOI - PubMed