. 2022 Mar 8;23(6):2919.
doi: 10.3390/ijms23062919.

The Rationale for the Dual-Targeting Therapy for RSK2 and AKT in Multiple Myeloma

Affiliations

The Rationale for the Dual-Targeting Therapy for RSK2 and AKT in Multiple Myeloma

Reiko Isa et al. Int J Mol Sci. .

Abstract

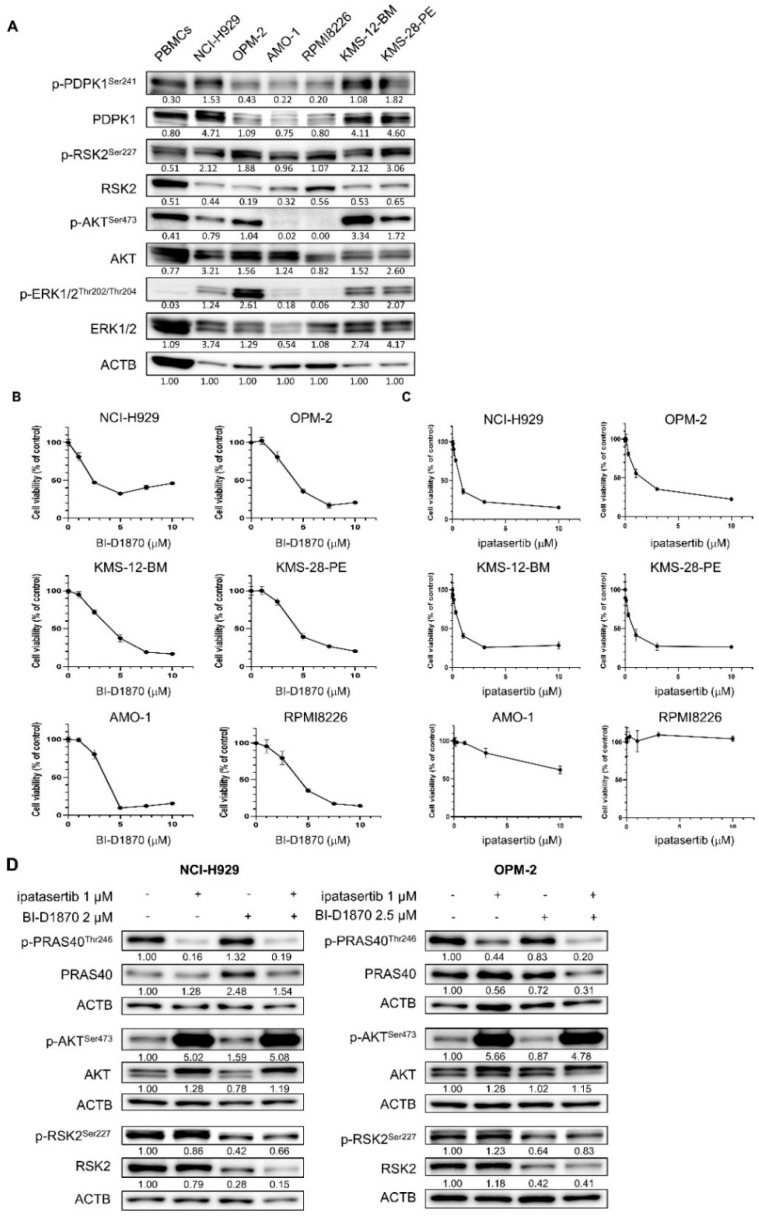
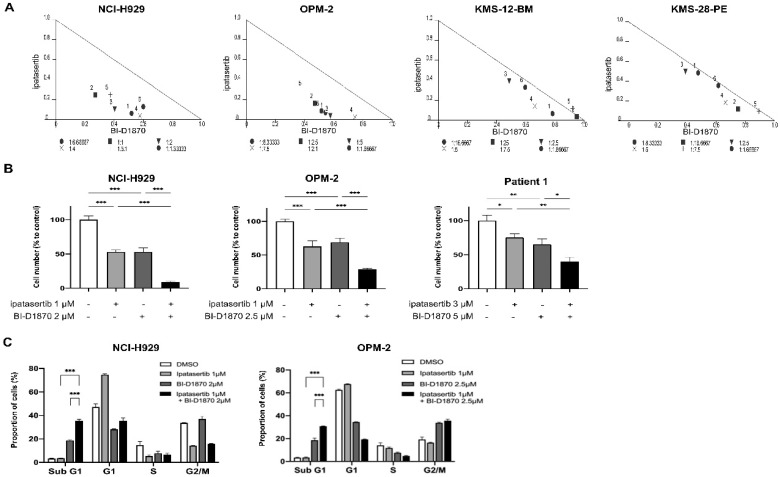
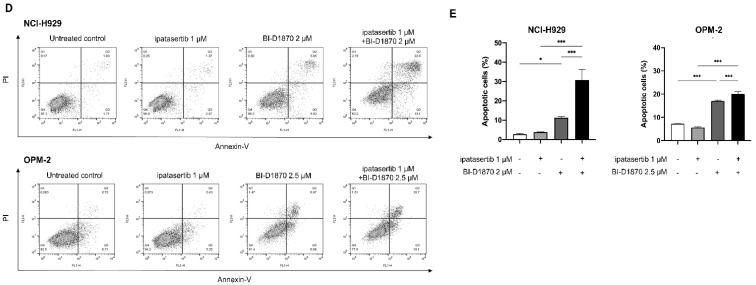
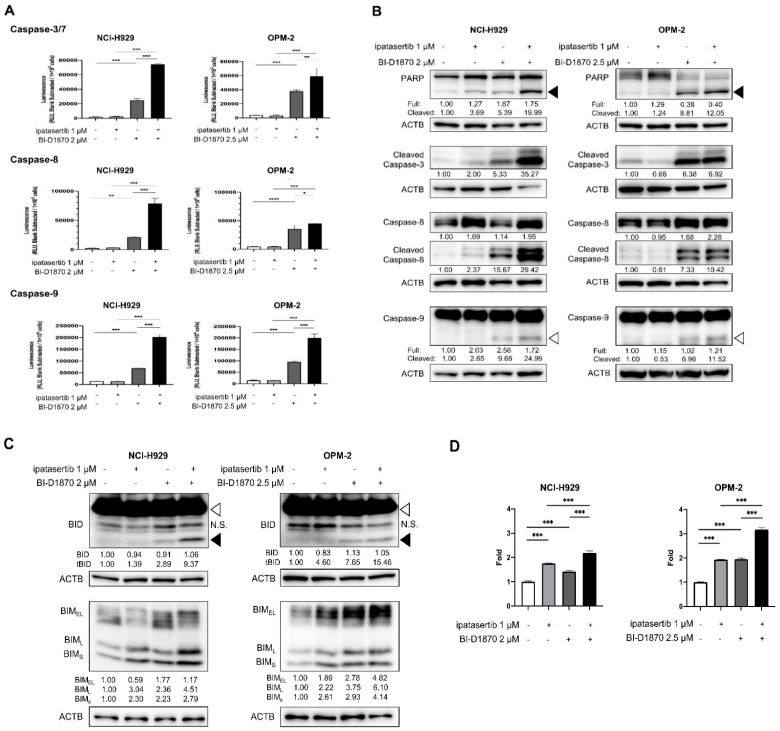
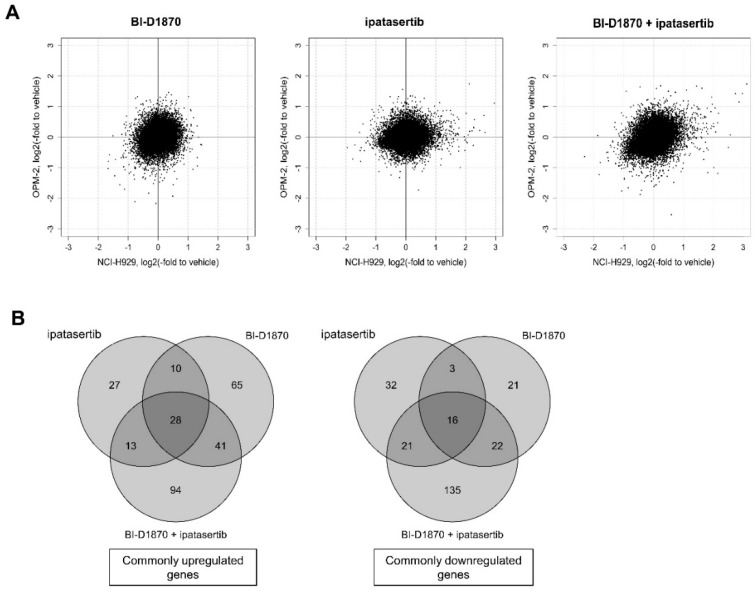
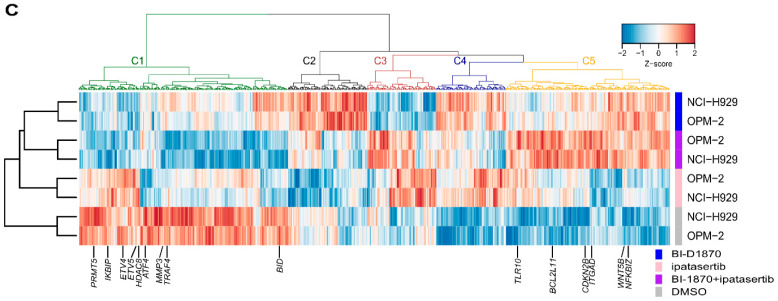
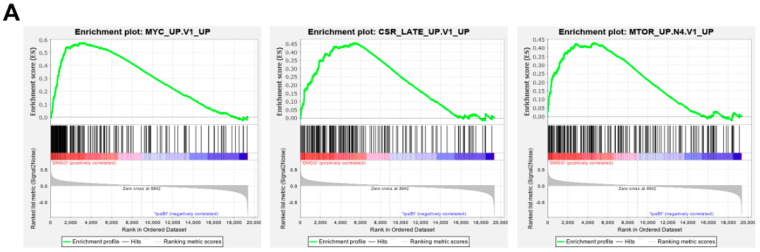
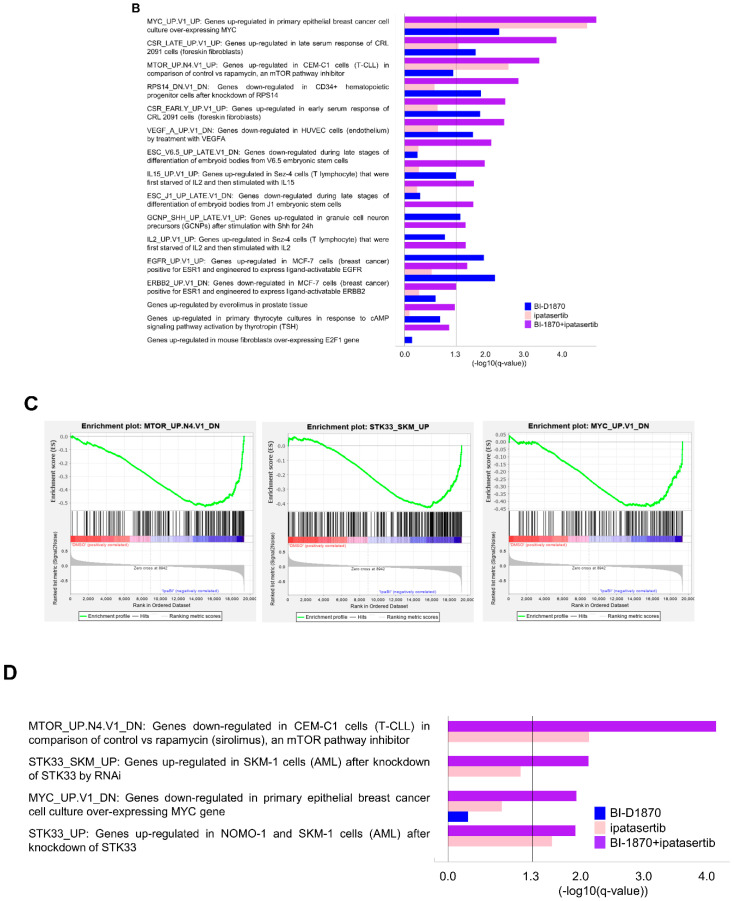
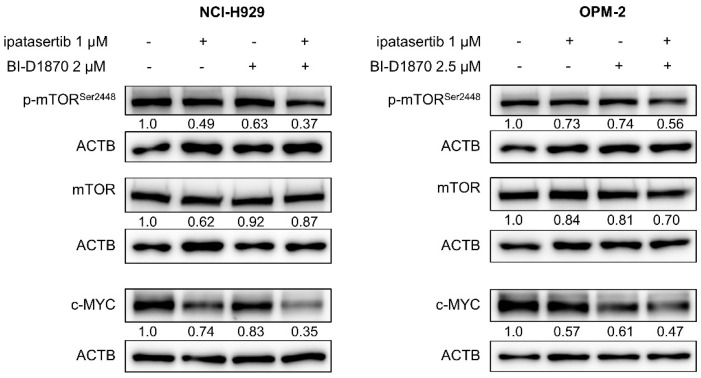
Multiple myeloma (MM) is characterized by remarkable cytogenetic/molecular heterogeneity among patients and intraclonal diversity even in a single patient. We previously demonstrated that PDPK1, the master kinase of series of AGC kinases, is universally active in MM, and plays pivotal roles in cell proliferation and cell survival of myeloma cells regardless of the profiles of cytogenetic and genetic abnormalities. This study investigated the therapeutic efficacy and mechanism of action of dual blockade of two major PDPK1 substrates, RSK2 and AKT, in MM. The combinatory treatment of BI-D1870, an inhibitor for N-terminal kinase domain (NTKD) of RSK2, and ipatasertib, an inhibitor for AKT, showed the additive to synergistic anti-tumor effect on human MM-derived cell lines (HMCLs) with active RSK2-NTKD and AKT, by enhancing apoptotic induction with BIM and BID activation. Moreover, the dual blockade of RSK2 and AKT exerted robust molecular effects on critical gene sets associated with myeloma pathophysiologies, such as those with MYC, mTOR, STK33, ribosomal biogenesis, or cell-extrinsic stimuli of soluble factors, in HMCLs. These results provide the biological and molecular rationales for the dual-targeting strategy for RSK2 and AKT, which may overcome the therapeutic difficulty due to cytogenetic/molecular heterogeneity in MM.

Keywords: AKT; MYC; RSK2; gene set enrichment analysis; mTOR; multiple myeloma.


Conflict of interest statement

J.K. received research funding from Kyowa Kirin, Chugai Pharmaceutical, Ono Pharmaceutical, Sanofi, Eisai, Bristol-Myers Squibb (BMS), Sysmex, Dainippon Sumitomo Pharma, Nippon Shinyaku, Abbvie, Teijin and Otsuka Pharmaceutical, has received honoraria from Janssen Pharmaceutical K.K, Kyowa Kirin, Chugai Pharmaceutical, Ono Pharmaceutical, Sanofi, Eisai, Symbio, BMS, Astellas Pharma, Pfizer, Nippon Shinyaku, Daiichi Sankyo, Dainippon Sumitomo Pharma, Abbvie and Otsuka Pharmaceutical, and is a consultant for Janssen Pharmaceutical K.K, and BMS. T.T. received research funding from Nippon Shinyaku.

Figures

Figure 1
Figure 1
Activities and the role of cell proliferation of RSK2 and AKT in human myeloma–derived cell lines (HMCLs): (A) Baseline activities of RSK, AKT, and related kinases examined by Western blot (WB) in six HMCLs and peripheral blood mononuclear cells (PBMCs). The expression level of ACTB was examined as the internal control. Expression levels relative to ACTB are shown below each band measured by densitometric analysis using Image-J software. (B,C) Growth inhibitory effects of BI-D1870 (C) or ipatasertib (D) in six HMCLs. Cells were seeded at 2 × 10⁵ cells/mL and treated with various concentrations of BI-D1870 (C) or ipatasertib (D) for 48 h. The IC50 values of BI-D1870 for NCI-H929, OPM-2, KMS12-BM, KMS28-PE, AMO-1, and RPMI8226 cells were 4.00, 4.34, 3.88, 4.95, 3.14, and 4.09 μM, respectively, while those of ipatasertib for NCI-H929, OPM-2, KMS12-BM, and KMS28-PE cells were 0.95, 2.12, 0.81, and 0.79 μM respectively. (D) Effects of BI-D1870 and ipatasertib on their target molecules in NCI-H929 and OPM-2 cells. Cells were treated with either ipatasertib, BI-D1870, or their combination at the indicated concentrations for 48 h. Expression levels relative to control (untreated cells) are shown below each band measured by densitometric analysis using Image-J software. ACTB was used as an internal control.
Figure 2
Figure 2
Combinatory effect of BI-D1870 and ipatasertib in HMCLs: (A) Isobolograms for the in vitro growth inhibitory effect by the combination of BI-D1870 and ipatasertib in NCI-H929, OPM-2, KMS-12-BM, and KMS-28-PE cells. X-axis and Y-axis indicate the fraction affected by BI-D1870 and ipatasertib, respectively. (B) Cells were treated with ipatasertib (1 μM) and/or BI-D1870 (2 μM) in NCI-H929, while with ipatasertib (1 μM) and/or BI-D1870 (2.5 μM) in OPM-2 for 48 h. Patient-derived myeloma cells were treated with ipatasertib (3 μM) and/or BI-D1870 (5 μM) for 48 h. (CE) Anti-tumor effects of BI-D1870, ipatasertib, and their combination in HMCLs. Cells were seeded at 2 × 10⁵ cells/mL and treated with ipatasertib (1 μM) and/or BI-D1870 (2 μM) in NCI-H929, while with ipatasertib (1 μM) and/or BI-D1870 (2.5 μM) in OPM-2 for 48 h, and then were subjected to flow cytometric analysis. DNA content was examined by propidium iodide (PI)-staining cells for cell cycle analysis (C). Induction of apoptosis was examined by double staining with Annexin-V and PI. Apoptotic cells were Annexin-V (+)/PI (−) and Annexin-V (+)/PI (+) populations (D). The proportion of apoptotic cells were shown. Mean value with standard deviation (S.D.) of triplicate data. * p < 0.05, ** p < 0.01, *** p < 0.001.
Figure 2
Figure 2
Combinatory effect of BI-D1870 and ipatasertib in HMCLs: (A) Isobolograms for the in vitro growth inhibitory effect by the combination of BI-D1870 and ipatasertib in NCI-H929, OPM-2, KMS-12-BM, and KMS-28-PE cells. X-axis and Y-axis indicate the fraction affected by BI-D1870 and ipatasertib, respectively. (B) Cells were treated with ipatasertib (1 μM) and/or BI-D1870 (2 μM) in NCI-H929, while with ipatasertib (1 μM) and/or BI-D1870 (2.5 μM) in OPM-2 for 48 h. Patient-derived myeloma cells were treated with ipatasertib (3 μM) and/or BI-D1870 (5 μM) for 48 h. (CE) Anti-tumor effects of BI-D1870, ipatasertib, and their combination in HMCLs. Cells were seeded at 2 × 10⁵ cells/mL and treated with ipatasertib (1 μM) and/or BI-D1870 (2 μM) in NCI-H929, while with ipatasertib (1 μM) and/or BI-D1870 (2.5 μM) in OPM-2 for 48 h, and then were subjected to flow cytometric analysis. DNA content was examined by propidium iodide (PI)-staining cells for cell cycle analysis (C). Induction of apoptosis was examined by double staining with Annexin-V and PI. Apoptotic cells were Annexin-V (+)/PI (−) and Annexin-V (+)/PI (+) populations (D). The proportion of apoptotic cells were shown. Mean value with standard deviation (S.D.) of triplicate data. * p < 0.05, ** p < 0.01, *** p < 0.001.
Figure 3
Figure 3
Molecular effects with apoptotic induction by BI-D1870, ipatasertib, and their combination: Cells were seeded at 2 × 10⁵ cells/mL and treated with indicated concentrations of BI-D1870, ipatasertib, or both agents for 48 h. (A) Activities of Caspase-3/7, Caspase-8, and Caspase-9 of untreated and treated cells measured by Caspase-Glo assay systems. (B) WB analyses for the detection of processing of caspases and PARP. Black arrow head and white arrow head indicate cleaved form of PARP and cleaved form of Caspase-9, respectively. (C) WB analysis for the detection of the activation of BID and the induction of BIM in untreated and treated HMCLs. White arrow head and black arrow head indicate full length BID and truncated BID, respectively. N.S.; no specific band. Expression levels relative to control (untreated cells) are shown below each band measured by densitometric analysis using Image-J software. ACTB was used as an internal control. (D) Transcriptional levels of BIM in treated cells relative to untreated cells. Mean value with S.D. of triplicate data. * p < 0.05, ** p < 0.01 *** p < 0.001, **** p < 0.0001.
Figure 4
Figure 4
Gene expression change induced by BI-D1870, ipatasertib, or their combination in HMCLs: (A) Expression changes in all investigated genes relative to vehicle cells in NCI-H929 (X-axis) and OPM-2 cells (Y-axis). (B) Venn diagrams for numbers of commonly significantly upregulated (left) and downregulated (right) genes in NCI-H929 and OPM-2 cells. (C) Clustering of significantly modulated genes after treatment in NCI-H929 and OPM-2 cells.
Figure 4
Figure 4
Gene expression change induced by BI-D1870, ipatasertib, or their combination in HMCLs: (A) Expression changes in all investigated genes relative to vehicle cells in NCI-H929 (X-axis) and OPM-2 cells (Y-axis). (B) Venn diagrams for numbers of commonly significantly upregulated (left) and downregulated (right) genes in NCI-H929 and OPM-2 cells. (C) Clustering of significantly modulated genes after treatment in NCI-H929 and OPM-2 cells.
Figure 5
Figure 5
Functional assessment of gene sets significantly modulated either by BI-D1870, ipatasertib, or their combination in HMCLs: (A) Plots for top 3 significantly enriched gene sets, MYC_UP.V1_UP (left), CSR_LATE_UP.V1_UP (middle), and MTOR_UP.N4.V1_UP (right) (www.gsea-misgdb.org/gsea/index.jsp, accessed on 1 December 2021), consisted of genes downregulated by the combination of BI-D1870 and ipatasertib in NCI-H929 and OPM-2 cells. (B) List of downregulated gene sets that are more significantly enriched by the combination treatment of BI-D1870 and ipatasertib compared to the treatment by either BI-D1870 or ipatasertib alone. Significance was shown by false discovery rate (FDR)(q-value) scores. −log10(FDR-q-value) score bigger than 1.3 is significant. (C) Plots for top 3 significantly enriched gene sets, MTOR_UP.N4.V1_DN (left), STK33_SKM_UP (middle), and MYC_UP.V1_DN (right) (www.gsea-misgdb.org/gsea/index.jsp, accessed on 1 December 2021), consisted of genes upregulated by the combination of BI-D1870 and ipatasertib in NCI-H929 and OPM-2 cells. (D) List of upregulated gene sets that are more significantly enriched by the combination treatment of BI-D1870 and ipatasertib compared to the treatment by either BI-D1870 or ipatasertib alone. Significance was shown by FDR(q-value) scores. -log10(FDR-q-value) score bigger than 1.3 is significant.
Figure 5
Figure 5
Functional assessment of gene sets significantly modulated either by BI-D1870, ipatasertib, or their combination in HMCLs: (A) Plots for top 3 significantly enriched gene sets, MYC_UP.V1_UP (left), CSR_LATE_UP.V1_UP (middle), and MTOR_UP.N4.V1_UP (right) (www.gsea-misgdb.org/gsea/index.jsp, accessed on 1 December 2021), consisted of genes downregulated by the combination of BI-D1870 and ipatasertib in NCI-H929 and OPM-2 cells. (B) List of downregulated gene sets that are more significantly enriched by the combination treatment of BI-D1870 and ipatasertib compared to the treatment by either BI-D1870 or ipatasertib alone. Significance was shown by false discovery rate (FDR)(q-value) scores. −log10(FDR-q-value) score bigger than 1.3 is significant. (C) Plots for top 3 significantly enriched gene sets, MTOR_UP.N4.V1_DN (left), STK33_SKM_UP (middle), and MYC_UP.V1_DN (right) (www.gsea-misgdb.org/gsea/index.jsp, accessed on 1 December 2021), consisted of genes upregulated by the combination of BI-D1870 and ipatasertib in NCI-H929 and OPM-2 cells. (D) List of upregulated gene sets that are more significantly enriched by the combination treatment of BI-D1870 and ipatasertib compared to the treatment by either BI-D1870 or ipatasertib alone. Significance was shown by FDR(q-value) scores. -log10(FDR-q-value) score bigger than 1.3 is significant.
Figure 6
Figure 6
WB for MYC, mTOR, and p-mTOR: Cells were treated for 48 h at the indicated concentrations of agents. Expression levels relative to control (untreated cells) are shown below each band measured by densitometric analysis using Image-J software. ACTB was used as an internal control.

Similar articles

Cited by

References

    1. Kazandjian D. Multiple myeloma epidemiology and survival: A unique malignancy. Semin. Oncol. 2016;43:676–681. doi: 10.1053/j.seminoncol.2016.11.004. - DOI - PMC - PubMed
    1. Bolli N., Avet-Loiseau H., Wedge D.C., Van Loo P., Alexandrov L.B., Martincorena I., Dawson K.J., Iorio F., Nik-Zainal S., Bignell G.R., et al. Heterogeneity of genomic evolution and mutational profiles in multiple myeloma. Nat. Commun. 2014;5:2997. doi: 10.1038/ncomms3997. - DOI - PMC - PubMed
    1. Barwick B.G., Gupta V.A., Vertino P.M., Boise L.H. Cell of Origin and Genetic Alterations in the Pathogenesis of Multiple Myeloma. Front. Immunol. 2019;10:1121. doi: 10.3389/fimmu.2019.01121. - DOI - PMC - PubMed
    1. Díaz-Rodríguez E., Álvarez-Fernández S., Chen X., Paiva B., López-Pérez R., García-Hernández J.L., San Miguel J.F., Pandiella A. Deficient spindle assembly checkpoint in multiple myeloma. PLoS ONE. 2011;6:e27583. - PMC - PubMed
    1. Fujibayashi Y., Isa R., Nishiyama D., Sakamoto-Inada N., Kawasumi N., Yamaguchi J., Kuwahara-Ota S., Matsumura-Kimoto Y., Tsukamoto T., Chinen Y., et al. Aberrant BUB1 Overexpression Promotes Mitotic Segregation Errors and Chromosomal Instability in Multiple Myeloma. Cancers. 2020;12:2206. doi: 10.3390/cancers12082206. - DOI - PMC - PubMed

MeSH terms

Substances