. 2022 Mar 8;23(6):2926.
doi: 10.3390/ijms23062926.

MicroRNA-mRNA Regulatory Network Mediates Activation of mTOR and VEGF Signaling in African American Prostate Cancer

Affiliations

MicroRNA-mRNA Regulatory Network Mediates Activation of mTOR and VEGF Signaling in African American Prostate Cancer

Himali Gujrati et al. Int J Mol Sci. .

Abstract

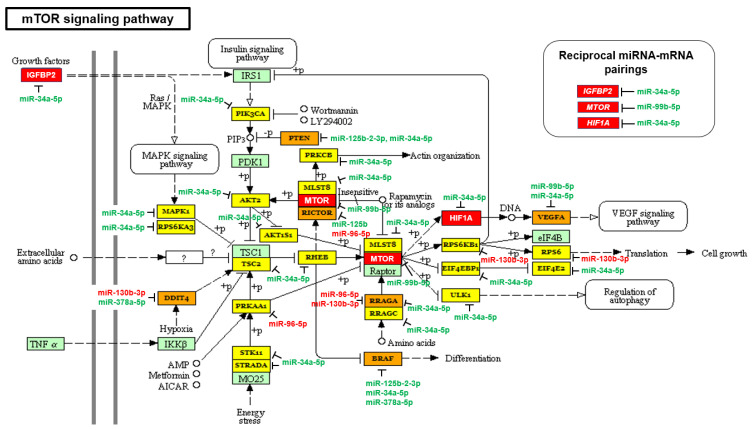
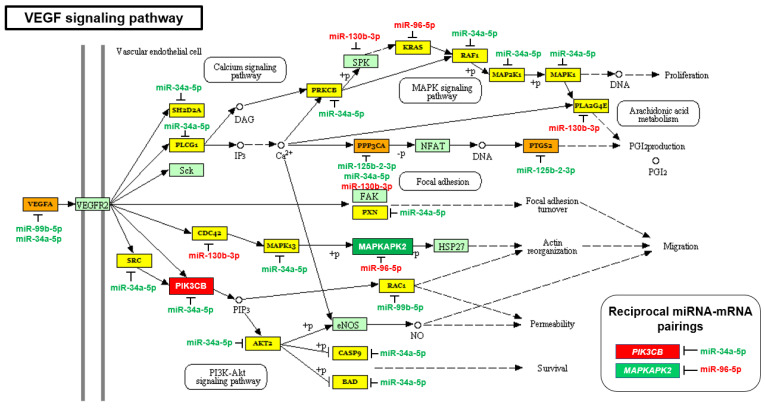
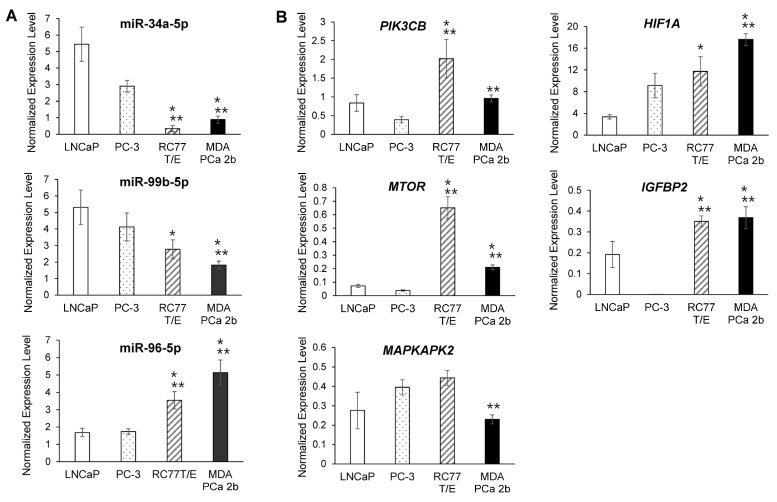
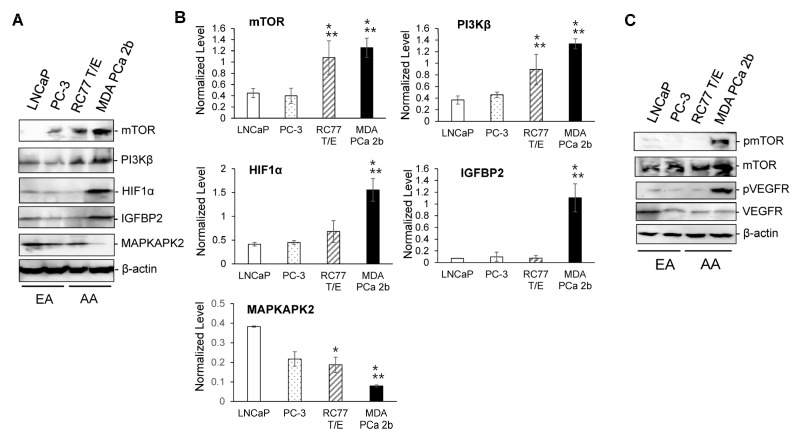
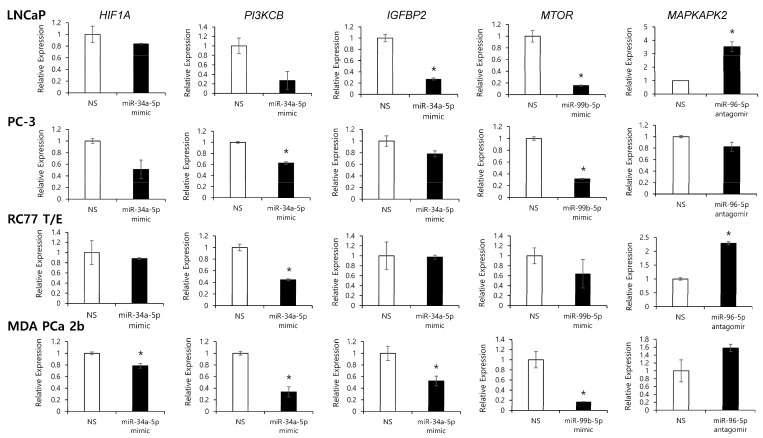
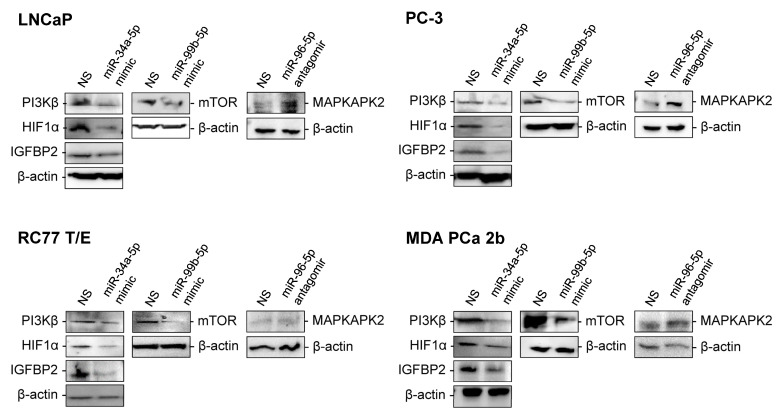
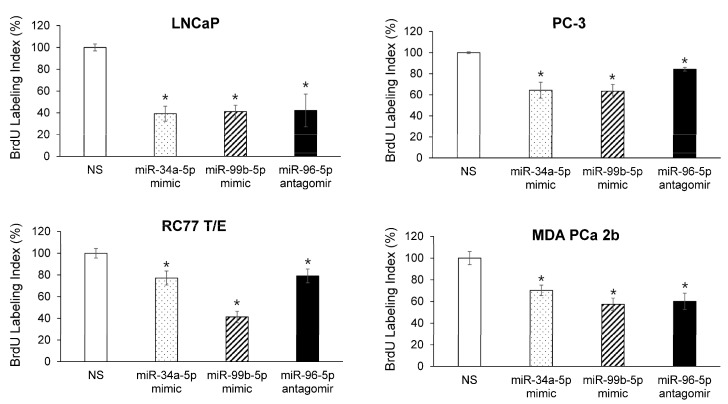
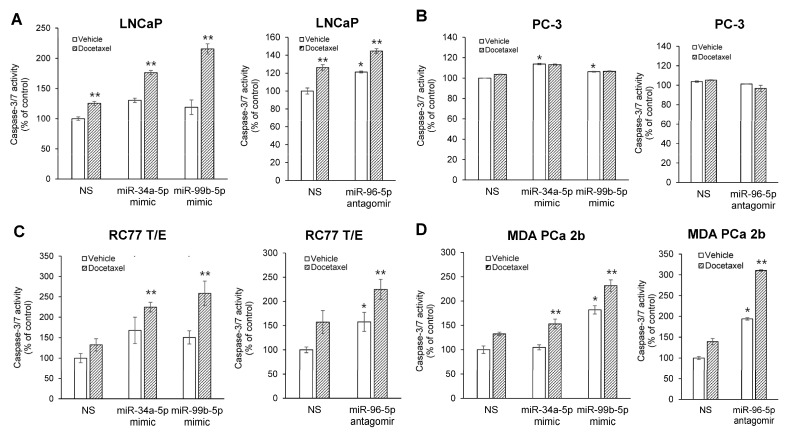
African American (AA) men exhibit 1.6-fold higher prostate cancer (PCa) incidence and 2.4-fold higher mortality rates compared to European American (EA) men. In addition to socioeconomic factors, emerging evidence suggests that intrinsic biological differences may explain part of PCa disparities. In this study, we applied microRNA (miRNA)-driven bioinformatics to evaluate whether differential miRNA-mRNA regulatory networks play a role in promoting the AA PCa disparities. 10 differentially expressed miRNAs were imported to mirPath V.3 algorithm, leading to identification of 58 signaling pathways differentially regulated in AA PCa versus EA PCa. Among these pathways, we particularly focused on mTOR and VEGF signaling, where we identified 5 reciprocal miRNA-mRNA pairings: miR-34a-5p/HIF1A, miR-34a-5p/PIK3CB, miR-34a-5p/IGFBP2, miR-99b-5p/MTOR and miR-96-5p/MAPKAPK2 in AA PCa versus EA PCa. RT-qPCR validation confirmed that miR-34a-5p, miR-99b-5p and MAPKAPK2 were downregulated, while miR-96-5p, IGFBP2, HIF1A, PIK3CB and MTOR were upregulated in AA PCa versus EA PCa cells. Transfection of miRNA mimics/antagomir followed by RT-qPCR and Western blot analysis further verified that IGFBP2, HIF1A and PIK3CB are negatively regulated by miR-34a-5p, whereas MTOR and MAPKAPK2 are negatively regulated by miR-99b-5p and miR-96-5p, respectively, at mRNA and protein levels. Targeting reciprocal pairings by miR-34a-5p mimic, miR-99b-5p mimic or miR-96-5p antagomir downregulates HIF1α, PI3Kβ, mTOR, IGFBP2 but upregulates MAPKAPK2, subsequently reducing cell proliferation and sensitizing docetaxel-induced cytotoxicity in PCa cells. These results suggest that miRNA-mRNA regulatory network plays a critical role in AA PCa disparities, and targeting these core miRNA-mRNA pairings may reduce PCa aggressiveness and overcome the chemoresistance in AA patients.

Keywords: microRNA; precision biomarker; prostate cancer disparities; reciprocal miRNA-mRNA pairing; therapeutic strategy.


Conflict of interest statement

These authors declare no conflict of interest.

Figures

Figure 1
Figure 1
The mTOR signaling pathway is upregulated in AA prostate cancer (PCa) specimens. MirPath v.3 was used to evaluate the impact of the 10 differentially expressed miRNAs (in AA PCa vs. EA PCa) in regulating the biological signaling pathways in AA PCa compared to EA PCa. Downregulated (green) and upregulated (red) miRNAs and mRNAs, in AA PCa vs. EA PCa, were indicated in mTOR signaling pathway. Three robust reciprocal miRNA-mRNA pairings, IGFBP2/miR-34a-5p (up/down), MTOR/miR-99b-5p (up/down) and HIF1A/miR-34a-5p (up/down), were highlighted. Unpaired AA-depleted miRNAs (miR-125b-2-3p, miR-378a-5p and miR-34a-5p) and AA-enriched miRNAs (miR-130b-3p and miR-96-5p) were indicated adjacent to their predicted target genes. The genes highlighted with yellow are genes targeted by one AA-depleted/enriched miRNA. The genes highlighted with orange are genes targeted by at least two AA-depleted/enriched miRNAs. The genes highlighted with light green are genes not targeted by any AA-depleted/enriched miRNA.
Figure 2
Figure 2
VEGF signaling pathway is upregulated in AA PCa specimens. Using mirPath v.3, VEGF signaling was identified as significant signaling pathway differentially regulated by AA depleted/enriched miRNAs (adjusted p-value = 0.0155). Downregulated (green) and upregulated (red) miRNAs and mRNAs, in AA PCa vs. EA PCa, were mapped in VEGF signaling pathway. Two reciprocal miRNA-mRNA pairings, PIK3CB/miR-34a-5p (up/down) and MAPKAPK2/miR-96-5p (down/up), were highlighted. Other unpaired downregulated and upregulated miRNAs (miR-125b-2-3p, miR-99b-5p and upregulated miR-130b-3p) were indicated next to their predicted target genes. The genes highlighted with yellow are genes targeted by one AA-depleted/enriched miRNA. The genes highlighted with orange are genes targeted by at least two AA-depleted/enriched miRNAs. The genes highlighted with light green are genes not targeted by any AA-depleted/enriched miRNA.
Figure 3
Figure 3
RT-qPCR validation of differentially expressed miRNAs and mRNAs in AA and EA PCa cell line models. (A) RT-qPCR assays for examining expression level of miR-34a-5p, miR-99b-5p and miR-96-5p in cell lines derived from EA PCa (LNCaP and PC-3) and AA PCa (RC77 T/E and MDA PCa 2b). (B) RT-qPCR assays for examining expression level of PIK3CB, MTOR, HIF1A, IGFBP2 and MAPKAPK2 in AA and EA PCa cell line models. Data were presented as mean ± SEM of n = 4-6 independent experiments, with technical triplicates for each independent experiment. The significance (* p < 0.05 in AA PCa cell line vs. LNCaP, and ** p < 0.05 in AA PCa cell line vs. PC-3) was determined based on ANOVA with Tukey post hoc test.
Figure 4
Figure 4
Western blot analysis of mTOR, PI3Kβ, HIF1α, IGFBP2 and MAPKAPK2 in AA and EA PCa cell line models. (A) Representative Western blot images of mTOR, PI3Kβ, HIF1α, IGFBP2, MAPKAPK2 and β-actin in EA PCa (LNCaP, PC-3) and AA PCa (RC77 T/E and MDA PCa 2b) cell lines. (B) Normalized protein levels of mTOR, PI3Kβ, HIF1α, IGFBP2 and MAPKAPK2 in EA PCa and AA PCa cell line models. The normalized protein level was measured by dividing intensity of the tested protein (mTOR, PI3Kβ, HIF1α, IGFBP2 or MAPKAPK2) with intensity of endogenous protein β-actin. Data were presented as mean ± SD of n = 3–4 independent immunoblot experiments, and the significance (* p < 0.05 in AA PCa cell line vs. LNCaP, and ** p < 0.05 in AA PCa vs. PC-3) was determined based on ANOVA with Tukey post hoc test. (C) Phosphorylation states of mTOR and VEGF in EA PCa (LNCaP and PC-3) and AA PCa (RC77 T/E and MDA PCa 2b) cell models. The pmTOR/mTOR and pVEGFR/VEGFR ratios were significantly higher in MDA PCa 2b (a metastatic AA PCa line) than in other three cell lines.
Figure 5
Figure 5
Modulation of miRNA expression affects the transcriptional regulation of its target genes in EA and AA PCa cell lines. RT-qPCR analysis of MTOR, PIK3CB, HIF1A, IGFBP2 and MAPKAPK2 expression in EA and AA PCa cell line models. Relative expression levels of MTOR, PIK3CB, HIF1A, IGFBP2 and MAPKAPK2 were shown in EA PCa (LNCaP and PC-3) and AA PCa (RC77 T/E and MDA PCa 2b) cell lines transfected with nonsense scrambled miRNA (NS), miRNA mimic or antagomir (miR-34a-5p mimic, miR-99b-5p mimic, or miR-96-5p antagomir). Data were presented as mean ± SEM of n = 3–4 independent RT-qPCR experiments, with technical triplicates for each independent experiment. The significance (* p < 0.05 in miRNA mimic or antagomir vs. NS) was determined based on student’s t-test.
Figure 6
Figure 6
Western blot analysis of mTOR, PI3Kβ, HIF1α, IGFBP2 and MAPKAPK2 in EA and AA PCa cell line models transfected with miRNA mimics or antagomir. Protein levels of mTOR, PI3Kβ, HIF1α, IGFBP2, MAPKAPK2 and β-actin were shown in EA PCa (LNCaP and PC-3) and AA PCa (RC77 T/E and MDA PCa 2b) cell lines transfected with nonsense scrambled miRNA (NS), miR-34a-5p mimic, miR-99b-5p mimic, or miR-96-5p antagomir. Representative Western blot images were selected from 3–4 independent immunoblot assays with consistent results.
Figure 7
Figure 7
Overexpressing AA-depleted miRNAs or suppressing AA-enrich miRNA causes inhibition of cell proliferation in EA and AA PCa cell lines. BrdU-labeling assays were performed after PCa cell lines were transfected with NS, miR-34a-5p mimic, miR-99b-5p mimic or miR-96-5p antagomir for 48 h. Data were plotted as mean ± SEM of n = 3–4 independent assays, with 3–4 technical replicates for each independent assay. The significance (* p < 0.05 in miRNA mimic/antagomir vs. NS) was determined based on ANOVA with Dunnett post hoc test.
Figure 8
Figure 8
Overexpression of miR-34a-5p mimic, miR-99b-5p mimic or miR-96-5p antagomir enhances docetaxel-induced cytotoxicity in EA PCa (A,B) and AA PCa (C,D) cell lines. Apoptosis activity was assessed by measuring caspase-3/7 activity using the Apo-ONE Kit, and the data were normalized to caspase-3/7 level of vehicle-treated NS control. Data were plotted as mean ± SEM for n of 3–4 independent experiments, with technical triplicates for each independent experiment. The significance (* p < 0.05 in miRNA mimic or antagomir transfection plus vehicle treatment vs. NS plus vehicle treatment, and ** p < 0.05 in miRNA mimic or antagomir transfection plus docetaxel treatment to miRNA mimic or antagomir transfection with vehicle treatment) was determined using ANOVA with Tukey post hoc test.

Similar articles

Cited by

References

    1. Friedman R.C., Farh K.K.-H., Burge C.B., Bartel D.P. Most mammalian mRNAs are conserved targets of microRNAs. Genome Res. 2008;19:92–105. doi: 10.1101/gr.082701.108. - DOI - PMC - PubMed
    1. Lewis B.P., Burge C.B., Bartel D.P. Conserved Seed Pairing, Often Flanked by Adenosines, Indicates that Thousands of Human Genes are MicroRNA Targets. Cell. 2005;120:15–20. doi: 10.1016/j.cell.2004.12.035. - DOI - PubMed
    1. Chen B., Li H., Zeng X., Yang P., Liu X., Zhao X., Liang S. Roles of microRNA on cancer cell metabolism. J. Transl. Med. 2012;10:228. doi: 10.1186/1479-5876-10-228. - DOI - PMC - PubMed
    1. Pedroza-Torres A., Romero-Córdoba S.L., Justo-Garrido M., Salido-Guadarrama I., Rodríguez-Bautista R., Montaño S., Muñiz-Mendoza R., Arriaga-Canon C., Fragoso-Ontiveros V., Álvarez-Gómez R.M., et al. MicroRNAs in Tumor Cell Metabolism: Roles and Therapeutic Opportunities. Front. Oncol. 2019;9:1404. doi: 10.3389/fonc.2019.01404. - DOI - PMC - PubMed
    1. Jackson R.J., Standart N. How do microRNAs regulate gene expression? Sci. STKE. 2007;2007:re1. doi: 10.1126/stke.3672007re1. - DOI - PubMed

MeSH terms