. 2022 Mar 9;23(6):2943.
doi: 10.3390/ijms23062943.

A Role of Complement in the Pathogenic Sequelae of Mouse Neonatal Germinal Matrix Hemorrhage

Affiliations

A Role of Complement in the Pathogenic Sequelae of Mouse Neonatal Germinal Matrix Hemorrhage

Mohammed Alshareef et al. Int J Mol Sci. .

Abstract

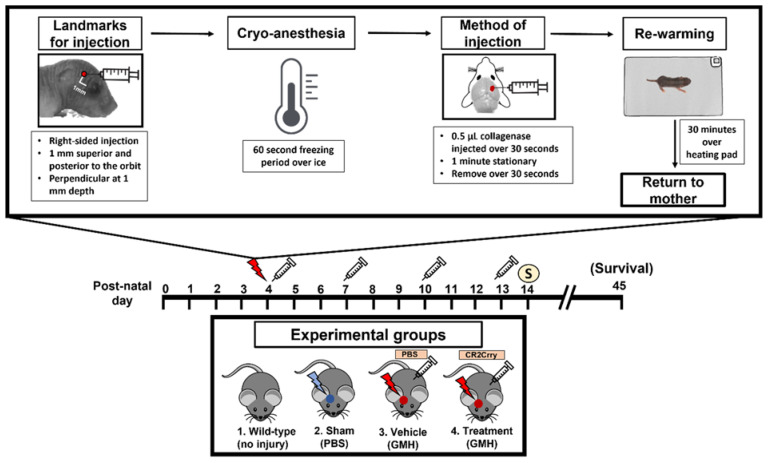
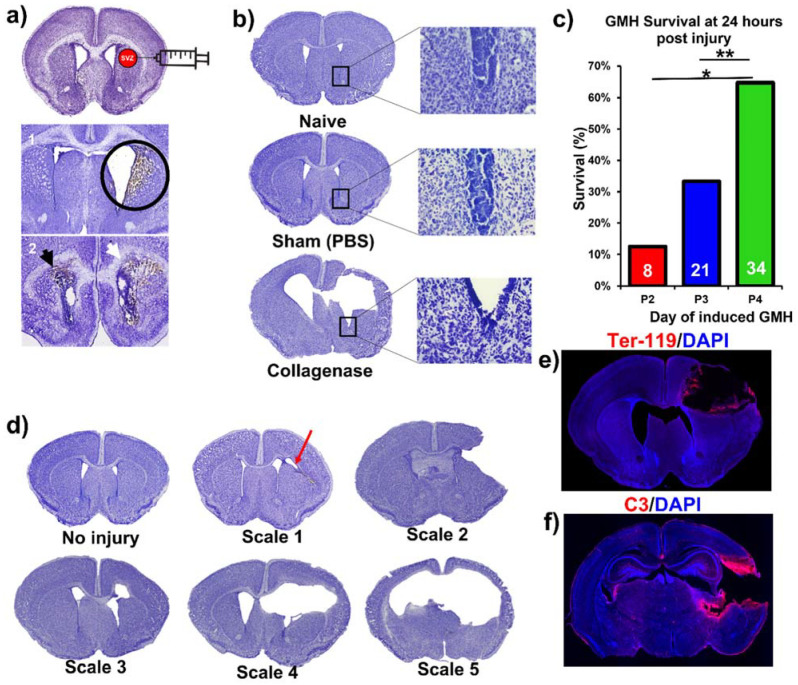
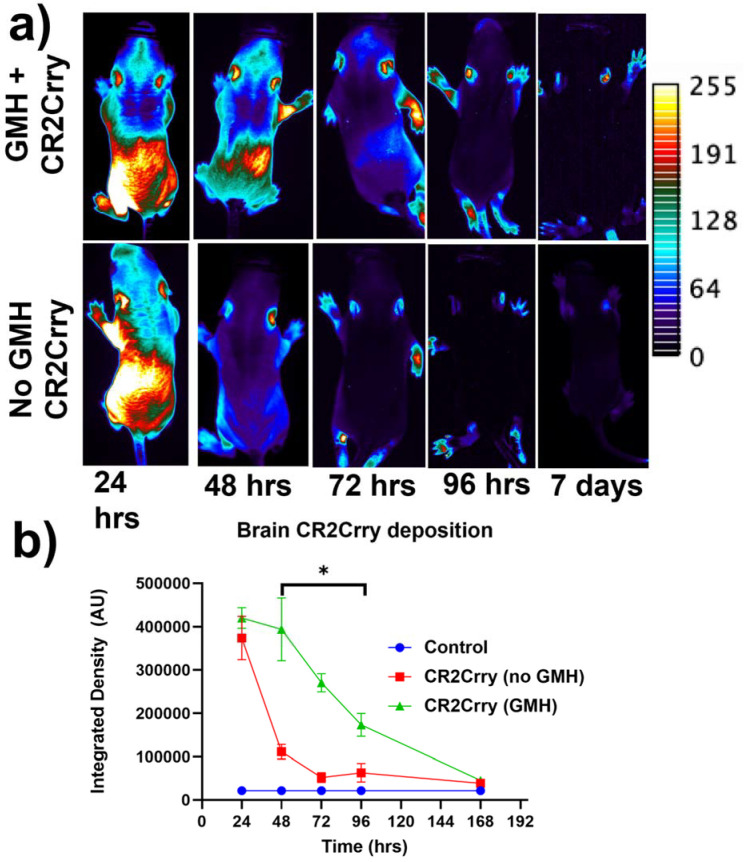
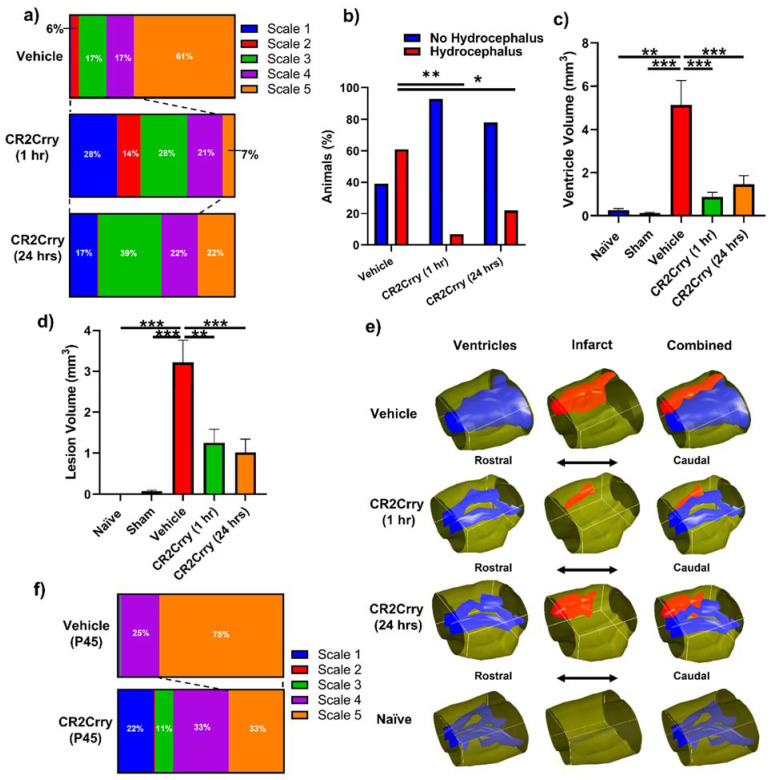
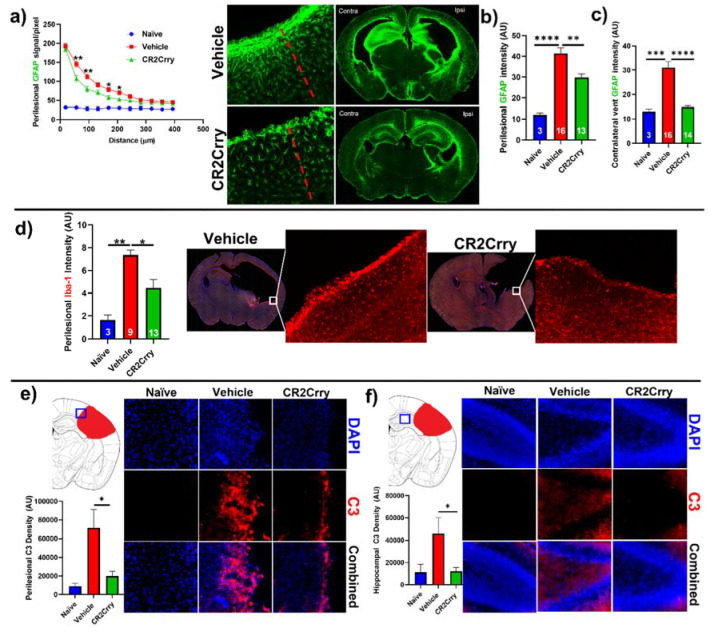
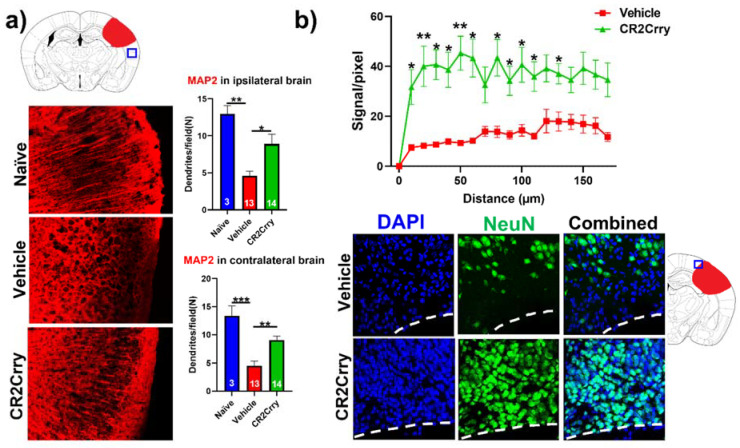
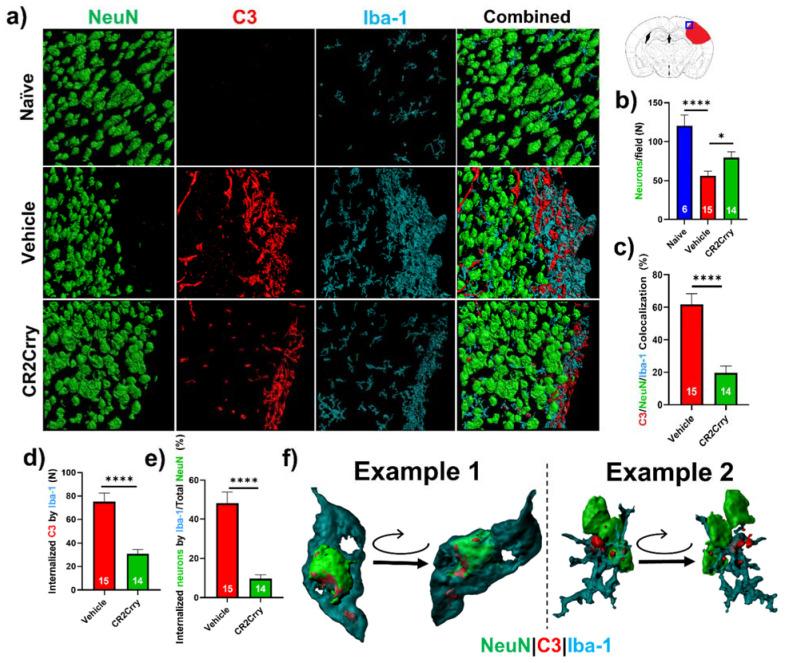
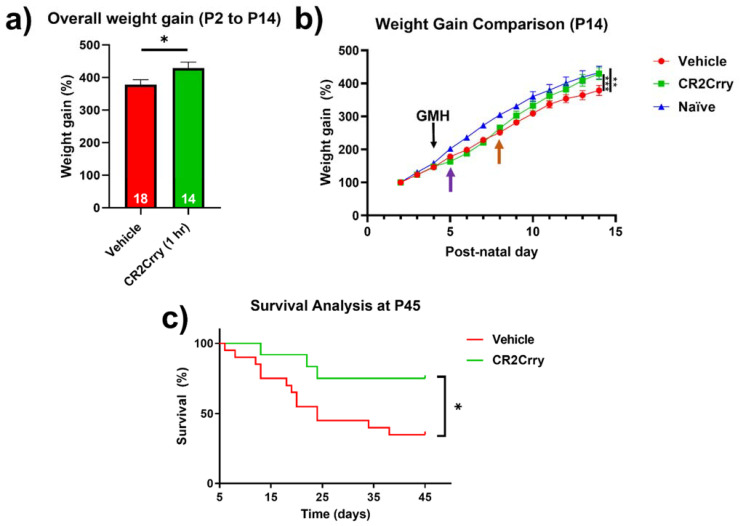
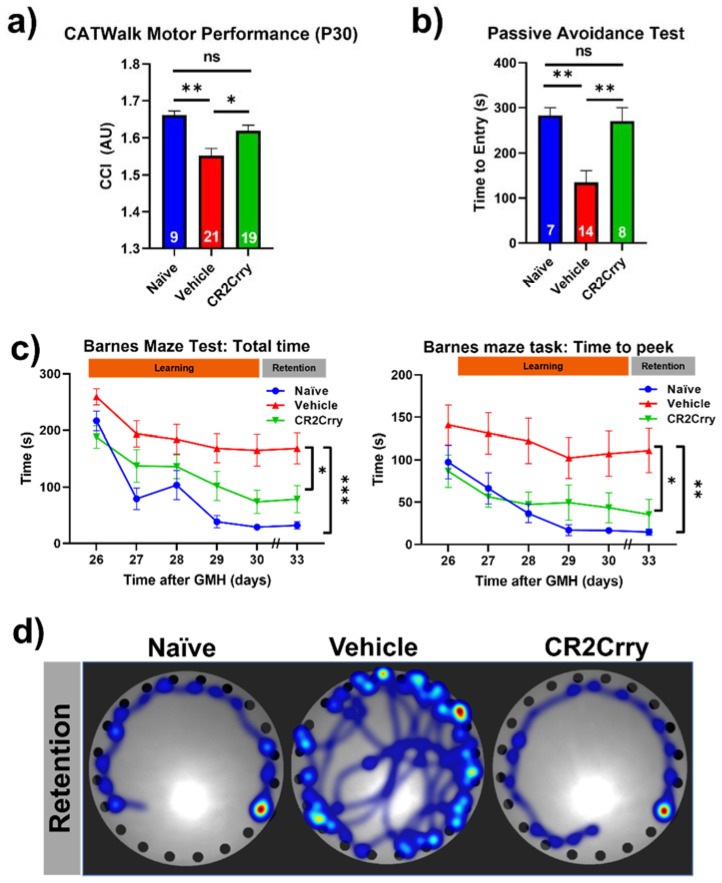
Germinal matrix hemorrhage (GMH) is a devastating disease of infancy that results in intraventricular hemorrhage, post-hemorrhagic hydrocephalus (PHH), periventricular leukomalacia, and neurocognitive deficits. There are no curative treatments and limited surgical options. We developed and characterized a mouse model of GMH based on the injection of collagenase into the subventricular zone of post-natal pups and utilized the model to investigate the role of complement in PHH development. The site-targeted complement inhibitor CR2Crry, which binds deposited C3 complement activation products, localized specifically in the brain following its systemic administration after GMH. Compared to vehicle, CR2Crry treatment reduced PHH and lesion size, which was accompanied by decreased perilesional complement deposition, decreased astrocytosis and microgliosis, and the preservation of dendritic and neuronal density. Complement inhibition also improved survival and weight gain, and it improved motor performance and cognitive outcomes measured in adolescence. The progression to PHH, neuronal loss, and associated behavioral deficits was linked to the microglial phagocytosis of complement opsonized neurons, which was reversed with CR2Crry treatment. Thus, complement plays an important role in the pathological sequelae of GMH, and complement inhibition represents a novel therapeutic approach to reduce the disease progression of a condition for which there is currently no treatment outside of surgical intervention.

Keywords: complement; germinal matrix hemorrhage; hydrocephalus; microglia; neuroinflammation; pediatric.


Conflict of interest statement

S.T. is an inventor of a licensed patent for CR2-targeted complement inhibitors. The remaining authors declare that the research was conducted in the absence of any commercial or financial relationships that could be construed as a potential conflict of interest.

Figures

Figure 1
Figure 1
Workflow of surgical procedure and treatment paradigms for all experimental groups. At P4, the surgical coordinate was marked, and pups were cryo-anesthetized. Then, 0.5 µL of collagenase was injected into the subventricular zone of the brain via a lateral transcortical approach, and pups were returned to their mother after re-warming. The experimental groups were (1) Wild-type non-injured (Naïve), (2) PBS injected into the SVZ (Sham), (3) Collagenase injected into the SVZ and subsequent IP treatment with PBS (Vehicle control), and (4) Collagenase injected into the SVZ and subsequent IP treatment with CR2Crry. Mice received first PBS or CR2Crry treatment 1 h after collagenase injection and at subsequent 3-day intervals as indicated (depicted by syringe). Mice were euthanized for sample collection on post-natal day 14 or monitored for survival (up to day 45).
Figure 2
Figure 2
Collagenase-induced intraparenchymal GMH results in lesion coupled with hydrocephalus and hemorrhage within the SVZ. (a) Nissl-stained images demonstrating the collagenase injection site and showing blood product deposition within surrounding tissue in both ipsilateral and contralateral ventricles as labeled by the black and white arrowheads. (b) Nissl stains of naïve, sham, and vehicle brains (showing hydrocephalus), with magnified images of the lower tip of the ventricle. (c) Survival at 24 h after collagenase injection in pups at P2, P3, or P4. Two separate Chi-square tests were performed, one between P2 and P4, and the other between P3 and P4. * p < 0.05, ** p < 0.01. (d) Nissl image examples of different injury scales (0 to 5) used to categorize injury severity. (e) Representative IF staining of red blood cells (Ter-119 in red) and cell nuclei (DAPI in blue) in an injured P7 animal brain (3 days after injury) with deposition of blood products along the lesion. (f) Representative IF staining of complement deposition (C3 in red) and cell nuclei (DAPI in blue) in an injured P7 animal brain (i.e., 3 days after injury) showing extensive perilesional C3 deposition. No data points were excluded from the analysis.
Figure 3
Figure 3
Fluorescence-tagged CR2Crry targets to the brain following injury. Fluorescent-tagged CR2Crry was administered i.p. to mice 1 hour after induction of GMH or to control mice (no injury). (a) Representative live animal fluorescence tomography images at indicated time points after CR2Crry administration, showing initial systemic distribution with subsequent retention of signal in the brain of GMH mice. (b) Quantification of fluorescence intensity in brains of GMH mice and control mice at indicated time points after CR2Crry administration, showing that the drug has a tissue half-life in the brain of about 3 days in GMH mice. Two-way ANOVA with Bonferroni’s correction for multiple comparisons. * p < 0.05. n = 4 for GMH, no GMH, and control groups. Error bars = mean ± SEM.
Figure 4
Figure 4
Complement inhibition leads to a reduction in lesion size and hydrocephalus. (a) Distribution of injury scales among the three different experimental groups: vehicle, CR2Crry (1 h), and CR2Crry (24 h). (b) Quantification of percent of animals that develop hydrocephalus (scale 5) vs. no hydrocephalus in vehicle, CR2Crry (1 h), CR2Crry (24 h). Chi-squared test performed between each hydrocephalus group. * p < 0.05, ** p < 0.001. (c,d) Lesion volume and ventricular volume quantification for the different groups together with naïve wild type and sham. One-way ANOVA with Bonferroni’s correction for multiple comparisons. ** p < 0.01, *** p < 0.001. n = 5 for Naïve, n = 7 for sham, n = 17 for vehicle, n = 14 for CR2Crry (1 h), and n = 17 for CR2Crry (24 h). Error bars = mean ± SEM. (e) Representative images with 3D reconstruction of ventricle and lesion volumes. No data points were excluded from the analysis. (f) Distribution of injury scales among the P45 vehicle and CR2Crry-treated groups. PHH was lower in the CR2Crry group (p < 0.05).
Figure 5
Figure 5
CR2Crry treatment decreases astrocyte and microglia/macrophage recruitment and decreases complement deposition. (a) Quantification of astrocyte signal with respect to distance in the perilesional region (left) and representative whole brain IF images (right) in CR2Crry vs. vehicle. Two-way ANOVA with Bonferroni’s correction for multiple comparisons. * p < 0.05, ** p < 0.01. n = 3 for naïve, n = 16 for vehicle, and n = 13 for CR2Crry. Error bars = mean ± SEM. (b) Perilesional astrocytosis. GFAP mean gray value (AU, image J) quantified along the lesion edge (within 100 µm of lesion border) showing a higher average intensity in vehicle compared to CR2Crry. Cortical mean gray value was obtained for naïve animals for comparison. One-way ANOVA with Bonferroni’s correction for multiple comparisons. ** p < 0.01, **** p < 0.0001. (c) GFAP mean gray value quantified for all images with visible contralateral ventricle (within 100 µm of ventricle border). There was increased periventricular astrocytosis in vehicle brains compared to both naïve and CR2Crry animals. One-way ANOVA with Bonferroni’s correction for multiple comparisons. *** p < 0.001, **** p < 0.0001. (d) Microglia/macrophages (Iba-1) density quantification in the perilesional area and representative images of the vehicle (left) and CR2Crry (right) treatment groups. One-way ANOVA with Bonferroni’s correction for multiple comparisons. * p < 0.05, ** p < 0.01. Error bars = mean ± SEM. (e) Representative images of C3 deposition with quantification of deposition in the perilesional area naïve, vehicle, and CR2Crry-treated animals, showing perilesional C3 deposition with reduction following CR2Crry treatment. One-way ANOVA with Bonferroni’s correction for multiple comparisons. * p < 0.05. n = 6 for naïve, n = 15 for vehicle, and n = 14 for CR2Crry. Error bars = mean ± SEM. (f) Representative images of C3 deposition with quantification of deposition within the ipsilateral hippocampus for naïve, vehicle, and CR2Crry-treated animals, showing perilesional C3 deposition with reduction following CR2Crry treatment. One-way ANOVA with Bonferroni’s correction for multiple comparisons. * p < 0.05. n = 5 for naïve, n = 12 for vehicle, and n = 14 for CR2Crry. Error bars = mean ± SEM. No data points were excluded from the analysis.
Figure 6
Figure 6
CR2Crry treatment decreases neurodegeneration by maintaining dendritic arborization and halting neuronal loss. (a) Representative IF images of dendritic processes (MAP2) of cortical tissue in the ipsilateral hemisphere and quantification of MAP2 dendritic density in both the ipsilateral and contralateral hemisphere of naïve, vehicle, and CR2Crry animals. One-way ANOVA with Bonferroni’s correction for multiple comparisons. * p < 0.05, ** p < 0.01, *** p < 0.001. Error bars = mean ± SEM. (b) Representative IF images of NeuN-stained sections of the perilesional area, and quantification of NeuN signal starting from lesion border inward toward the ipsilateral cortical tissue. Two-way ANOVA with Bonferroni’s correction for multiple comparisons. * p < 0.05, ** p < 0.01. n = 15 for vehicle, and n = 14 for CR2Crry. Error bars = mean ± SEM. No data points were excluded from the analysis.
Figure 7
Figure 7
Complement inhibition reduces microglia/macrophage association with and internalization of C3-tagged neurons. (a) Representative images of perilesional area showing staining for Iba-1, C3, and NeuN, which were obtained using confocal microscopy with Z-stacking. Three-dimensional (3D) image reconstruction was performed using Imaris to obtain colocalization analysis. (b) Perilesional quantification of neurons in animals treated as indicated. Cortical images from naïve brains were used for comparison. * p < 0.05, **** p < 0.0001. Error bars = mean ± SEM. (c) IF stain for C3 deposition, Iba-1, and NeuN colocalization, performed based on surface proximity and analyzed as a percent of total neurons/field. Association of microglia/macrophages (Iba-1) with complement-tagged neurons as a percentage of total neurons present was higher in vehicle (62%) compared to CR2Crry-treated animals (20%). **** p < 0.0001. Error bars = mean ± SEM. n = 6 for naïve, n = 15 for vehicle, and n = 14 for CR2Crry. (d) Quantification of microglia/macrophages within the perilesional space with partial or complete internalization of C3 material. (e) Quantification of microglia/macrophages within the perilesional space with partial or complete internalization of NeuN+ material as a percent of total quantified neurons. **** p < 0.0001. Error bars = mean ± SEM. n = 15 for vehicle, and n = 14 for CR2Crry. (f) Example images showing microglia/macrophage association and internalization of C3-tagged neurons in vehicle animals (see also supplemental videos). No data points were excluded from the analysis.
Figure 8
Figure 8
CR2Crry treatment improves weight gain after GMH and promotes survival. (a) The overall percent weight gain from day P2 to P14 in vehicle and CR2rry-treated mice. Unpaired Student’s t-test. * p < 0.05. Error bars = mean ± SEM. (b) Daily weight percent gain over a 12-day period following GMH induction. Deceleration in percent daily weight gain in CR2Crry and vehicle animals at P5 (purple arrow). Acceleration of weight gain in CR2Crry-treated animals (orange arrow). Two-way ANOVA with Bonferroni’s correction for multiple comparisons. ** p < 0.01, *** p < 0.001. n = 11 for naïve, n = 18 for vehicle, and n = 14 for CR2Crry. Error bars = mean ± SEM. (c) Survival assessed over 41 days after injury (P45). Animal survival was assessed beginning at one day after injury (P5). Animals that died within 24 h of injury were excluded from analysis. CR2Crry group deaths plateau around P25, while vehicle animal deaths continue until close to P45. P45 animal survival was 75% in the CR2Crry group compared to 45% in the vehicle (p < 0.05). Log-rank (Mantel–Cox) test. * p < 0.05. n = 20 for vehicle and n = 12 for CR2Crry. Error bars = mean ± SEM.
Figure 9
Figure 9
CR2Crry treatment improves motor performance and cognitive performance of GMH injured mice. (a) Gait analysis evaluated using Catwalk XT. The output variables for all four limbs were combined into a previously described Combined Catwalk Index (CCI) 26 days after injury (P30). One-way ANOVA with Bonferroni’s correction for multiple comparisons. * p < 0.05, ** p < 0.01. Error bars = mean ± SEM. (b) Passive avoidance test (time to entry) performed 36 days after injury (P40) shows improvement in fear-conditioned learning in CR2Crry animals and naïve as compared to vehicle. One-way ANOVA with Bonferroni’s correction for multiple comparisons. ** p < 0.01. Error bars = mean ± SEM. (c) Barnes maze task performed beginning at 26 days after injury (P30). There was a training period of 5 days followed by a two-day rest period and subsequently underwent testing to evaluate retention memory 33 days after injury (P37). Variables presented were total latency and latency to first peek into the escape hole. Two-way ANOVA with Bonferroni’s correction for multiple comparisons. * p < 0.05, ** p < 0.01, *** p < 0.001. n = 7 for naïve, n = 21 for vehicle, and n = 16 for CR2Crry. Error bars= mean ± SEM. (d) Representative heat maps of movement of mice from the three treatment groups on the platform on the retention day. No data points were excluded from the analysis.

Similar articles

Cited by

References

    1. Heron M., Sutton P.D., Xu J., Ventura S.J., Strobino D.M., Guyer B. Annual Summary of Vital Statistics: 2007. Pediatrics. 2010;125:4–15. doi: 10.1542/peds.2009-2416. - DOI - PubMed
    1. Mukerji A., Shah V., Shah P.S. Periventricular/Intraventricular Hemorrhage and Neurodevelopmental Outcomes: A Meta-analysis. Pediatrics. 2015;136:1132–1143. doi: 10.1542/peds.2015-0944. - DOI - PubMed
    1. Robinson S. Neonatal posthemorrhagic hydrocephalus from prematurity: Pathophysiology and current treatment concepts. J. Neurosurg. Pediatr. 2012;9:242–258. doi: 10.3171/2011.12.PEDS11136. - DOI - PMC - PubMed
    1. Bolisetty S., Dhawan A., Abdel-Latif M., Bajuk B., Stack J., Oei J.-L., Lui K. New South Wales and Australian Capital Territory Neonatal Intensive Care Units’ Data Collection. Intraventricular Hemorrhage and Neurodevelopmental Outcomes in Extreme Preterm Infants. Pediatrics. 2014;133:55–62. doi: 10.1542/peds.2013-0372. - DOI - PubMed
    1. Radic J.A.E., Vincer M., McNeely P.D. Outcomes of intraventricular hemorrhage and posthemorrhagic hydrocephalus in a population-based cohort of very preterm infants born to residents of Nova Scotia from 1993 to 2010. J. Neurosurg. Pediatr. 2015;15:580–588. doi: 10.3171/2014.11.PEDS14364. - DOI - PubMed