

Complexity of NAC Action as an Antidiabetic Agent: Opposing Effects of Oxidative and Reductive Stress on Insulin Secretion and Insulin Signaling
- PMID: 35328386
- PMCID: PMC8950759
- DOI: 10.3390/ijms23062965
Complexity of NAC Action as an Antidiabetic Agent: Opposing Effects of Oxidative and Reductive Stress on Insulin Secretion and Insulin Signaling
Abstract
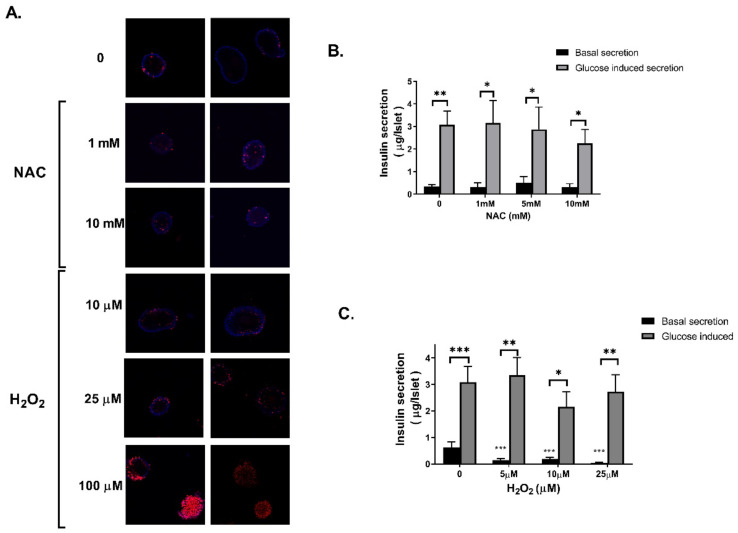
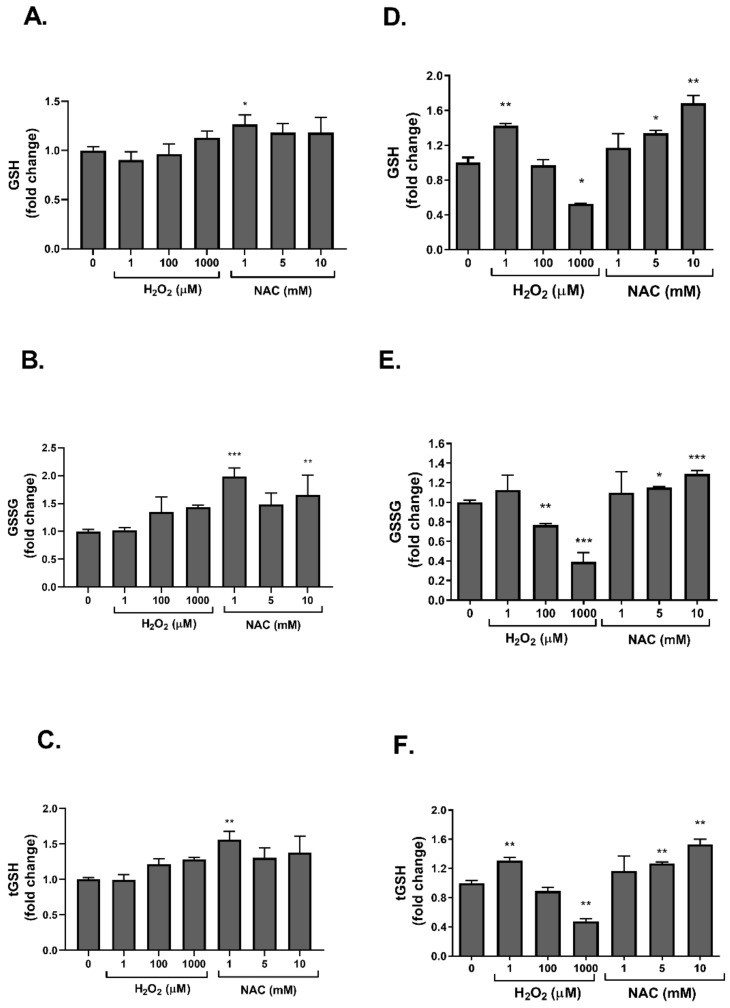
Dysregulated redox balance is involved in the pathogenesis of type 2 diabetes. While the benefit of antioxidants in neutralizing oxidative stress is well characterized, the potential harm of antioxidant-induced reductive stress is unclear. The aim of this study was to investigate the dose-dependent effects of the antioxidant N-acetylcysteine (NAC) on various tissues involved in the regulation of blood glucose and the mechanisms underlying its functions. H2O2 was used as an oxidizing agent in order to compare the outcomes of oxidative and reductive stress on cellular function. Cellular death in pancreatic islets and diminished insulin secretion were facilitated by H2O2-induced oxidative stress but not by NAC. On the other hand, myotubes and adipocytes were negatively affected by NAC-induced reductive stress, as demonstrated by the impaired transmission of insulin signaling and glucose transport, as opposed to H2O2-stimulatory action. This was accompanied by redox balance alteration and thiol modifications of proteins. The NAC-induced deterioration of insulin signaling was also observed in healthy mice, while both insulin secretion and insulin signaling were improved in diabetic mice. This study establishes the tissue-specific effects of NAC and the importance of the delicate maintenance of redox balance, emphasizing the challenge of implementing antioxidant therapy in the clinic.
Keywords: N-acetylcysteine; glucose uptake; glutathionylation; insulin signaling; oxidative stress; redox balance; type 2 diabetes.
Conflict of interest statement
The authors declare no conflict of interest.
Figures


Similar articles
-
N-acetylcysteine combined with insulin alleviates the oxidative damage of cerebrum via regulating redox homeostasis in type 1 diabetic mellitus canine.Life Sci. 2022 Nov 1;308:120958. doi: 10.1016/j.lfs.2022.120958. Epub 2022 Sep 12. Life Sci. 2022. PMID: 36108767
-
Beneficial effects of antioxidants in diabetes: possible protection of pancreatic beta-cells against glucose toxicity.Diabetes. 1999 Dec;48(12):2398-406. doi: 10.2337/diabetes.48.12.2398. Diabetes. 1999. PMID: 10580429
-
Free fatty acid-induced reduction in glucose-stimulated insulin secretion: evidence for a role of oxidative stress in vitro and in vivo.Diabetes. 2007 Dec;56(12):2927-37. doi: 10.2337/db07-0075. Epub 2007 Aug 23. Diabetes. 2007. PMID: 17717282
-
Nutrient Metabolism, Subcellular Redox State, and Oxidative Stress in Pancreatic Islets and β-Cells.J Mol Biol. 2020 Mar 6;432(5):1461-1493. doi: 10.1016/j.jmb.2019.10.012. Epub 2019 Oct 18. J Mol Biol. 2020. PMID: 31634466 Review.
-
A review on the possible molecular mechanism of action of N-acetylcysteine against insulin resistance and type-2 diabetes development.Clin Biochem. 2015 Nov;48(16-17):1200-8. doi: 10.1016/j.clinbiochem.2015.04.017. Epub 2015 Apr 25. Clin Biochem. 2015. PMID: 25920891 Review.
Cited by
-
N-acetylcysteine supplementation improves endocrine-metabolism profiles and ovulation induction efficacy in polycystic ovary syndrome.J Ovarian Res. 2024 Oct 16;17(1):205. doi: 10.1186/s13048-024-01528-8. J Ovarian Res. 2024. PMID: 39415242 Free PMC article. Clinical Trial.
-
Activation of Nrf2 at Critical Windows of Development Alters Tissue-Specific Protein S-Glutathionylation in the Zebrafish (Danio rerio) Embryo.Antioxidants (Basel). 2024 Aug 19;13(8):1006. doi: 10.3390/antiox13081006. Antioxidants (Basel). 2024. PMID: 39199250 Free PMC article.
-
Hypoglycemic and H2O2-induced oxidative injury protective effects and the phytochemical profiles of the ethyl acetate fraction from Radix Paeoniae Alba.Front Nutr. 2023 Feb 24;10:1126359. doi: 10.3389/fnut.2023.1126359. eCollection 2023. Front Nutr. 2023. PMID: 36908916 Free PMC article.
-
Redox Balance in Type 2 Diabetes: Therapeutic Potential and the Challenge of Antioxidant-Based Therapy.Antioxidants (Basel). 2023 Apr 25;12(5):994. doi: 10.3390/antiox12050994. Antioxidants (Basel). 2023. PMID: 37237860 Free PMC article. Review.
-
Long-Term Administration of Antioxidant N-Acetyl-L-Cysteine Impacts Beta Cell Oxidative Stress, Insulin Secretion, and Intracellular Signaling Pathways in Aging Mice.Antioxidants (Basel). 2025 Mar 31;14(4):417. doi: 10.3390/antiox14040417. Antioxidants (Basel). 2025. PMID: 40298742 Free PMC article.
References
-
- Safai N., Carstensen B., Vestergaard H., Ridderstråle M. Impact of a multifactorial treatment programme on clinical outcomes and cardiovascular risk estimates: A retrospective cohort study from a specialised diabetes centre in Denmark. BMJ Open. 2018;8:e019214. doi: 10.1136/bmjopen-2017-019214. - DOI - PMC - PubMed
MeSH terms
Substances
Grants and funding
LinkOut - more resources
Full Text Sources
Medical
