

Effects of Ultra-Short Pulsed Electric Field Exposure on Glioblastoma Cells
- PMID: 35328420
- PMCID: PMC8950115
- DOI: 10.3390/ijms23063001
Effects of Ultra-Short Pulsed Electric Field Exposure on Glioblastoma Cells
Abstract
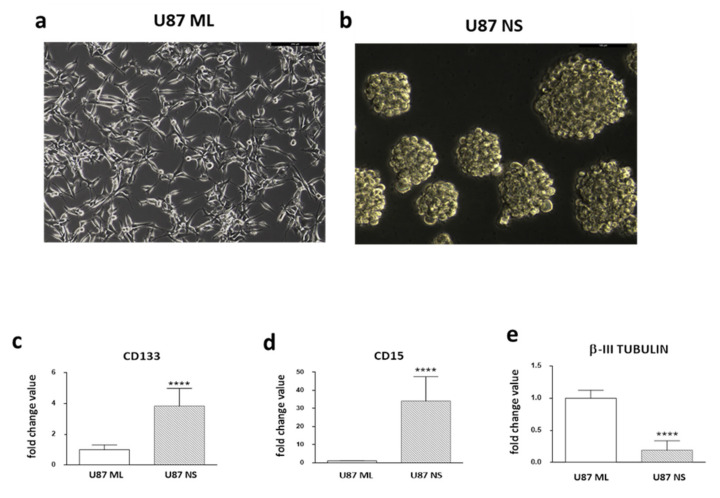
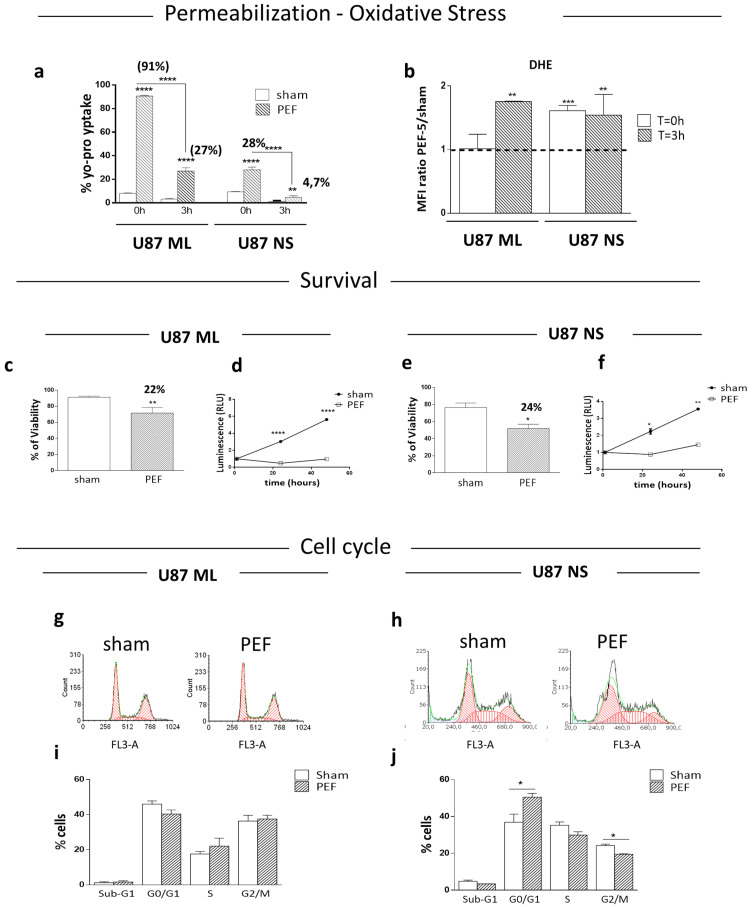
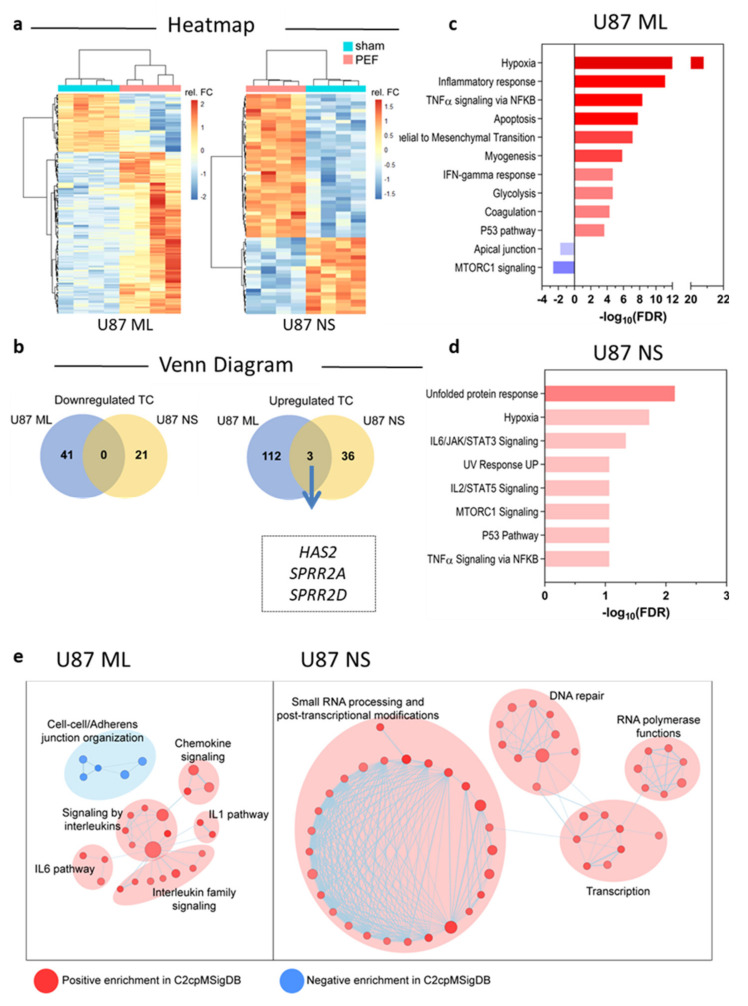
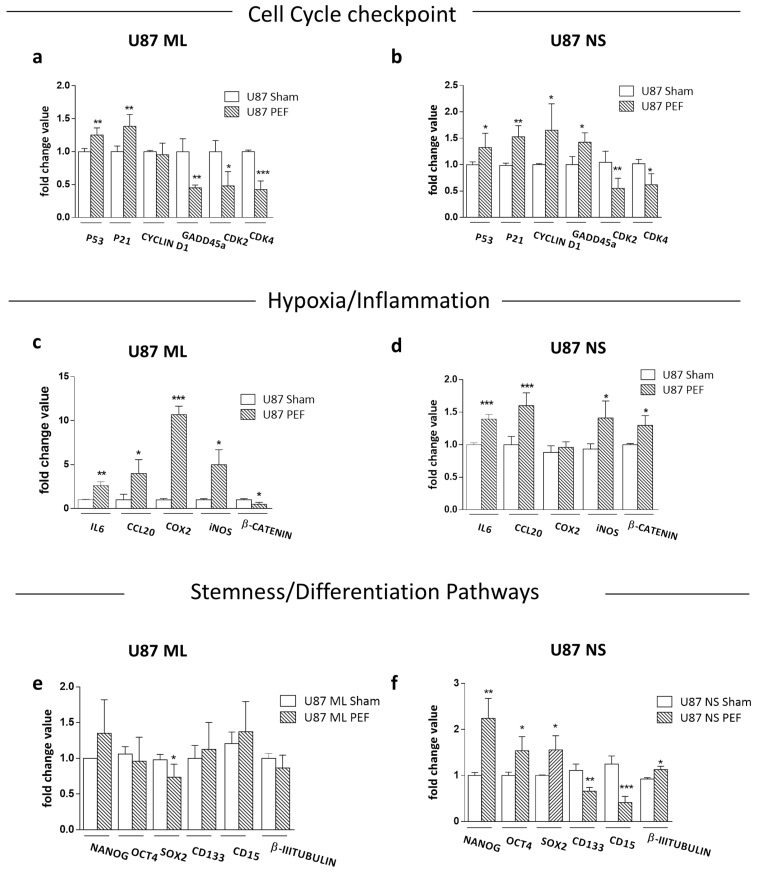
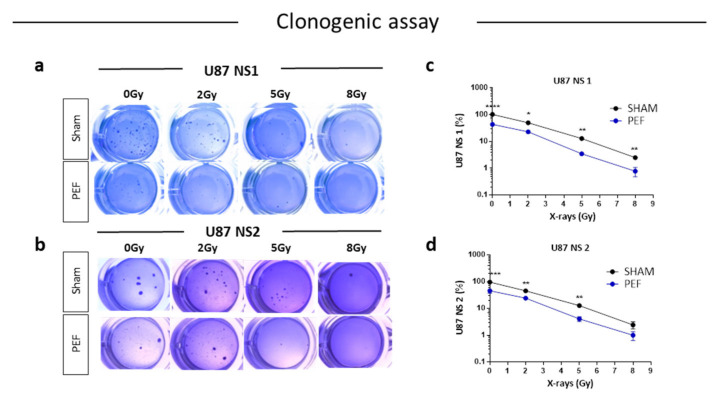
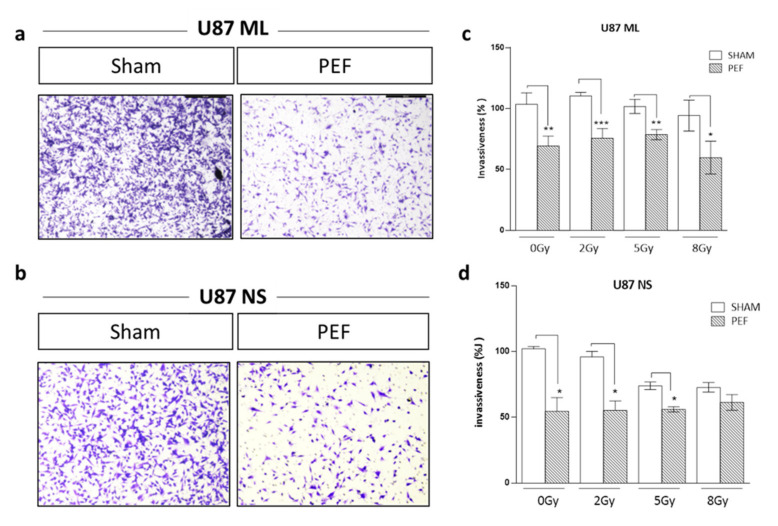
Glioblastoma multiforme (GBM) is the most common brain cancer in adults. GBM starts from a small fraction of poorly differentiated and aggressive cancer stem cells (CSCs) responsible for aberrant proliferation and invasion. Due to extreme tumor heterogeneity, actual therapies provide poor positive outcomes, and cancers usually recur. Therefore, alternative approaches, possibly targeting CSCs, are necessary against GBM. Among emerging therapies, high intensity ultra-short pulsed electric fields (PEFs) are considered extremely promising and our previous results demonstrated the ability of a specific electric pulse protocol to selectively affect medulloblastoma CSCs preserving normal cells. Here, we tested the same exposure protocol to investigate the response of U87 GBM cells and U87-derived neurospheres. By analyzing different in vitro biological endpoints and taking advantage of transcriptomic and bioinformatics analyses, we found that, independent of CSC content, PEF exposure affected cell proliferation and differentially regulated hypoxia, inflammation and P53/cell cycle checkpoints. PEF exposure also significantly reduced the ability to form new neurospheres and inhibited the invasion potential. Importantly, exclusively in U87 neurospheres, PEF exposure changed the expression of stem-ness/differentiation genes. Our results confirm this physical stimulus as a promising treatment to destabilize GBM, opening up the possibility of developing effective PEF-mediated therapies.
Keywords: cancer stem cells (CSCs); glioma; neurospheres; pulsed electric field; transcriptomic analysis.
Conflict of interest statement
The authors declare no conflict of interest. The funders had no role in the design of the study; in the collection, analyses, or interpretation of data; in the writing of the manuscript, or in the decision to publish the results.
Figures
Similar articles
-
Resveratrol targeting of AKT and p53 in glioblastoma and glioblastoma stem-like cells to suppress growth and infiltration.J Neurosurg. 2017 May;126(5):1448-1460. doi: 10.3171/2016.1.JNS152077. Epub 2016 Jul 15. J Neurosurg. 2017. PMID: 27419830 Free PMC article.
-
Microsecond Pulsed Electric Fields: An Effective Way to Selectively Target and Radiosensitize Medulloblastoma Cancer Stem Cells.Int J Radiat Oncol Biol Phys. 2021 Apr 1;109(5):1495-1507. doi: 10.1016/j.ijrobp.2020.11.047. Epub 2021 Jan 25. Int J Radiat Oncol Biol Phys. 2021. PMID: 33509660
-
The impact of arsenic trioxide and all-trans retinoic acid on p53 R273H-codon mutant glioblastoma.Tumour Biol. 2014 May;35(5):4567-80. doi: 10.1007/s13277-013-1601-6. Epub 2014 Jan 8. Tumour Biol. 2014. PMID: 24399651
-
The evolving landscape of glioblastoma stem cells.Curr Opin Neurol. 2013 Dec;26(6):701-7. doi: 10.1097/WCO.0000000000000032. Curr Opin Neurol. 2013. PMID: 24152818 Free PMC article. Review.
-
Effective treatment of glioblastoma requires crossing the blood-brain barrier and targeting tumors including cancer stem cells: The promise of nanomedicine.Biochem Biophys Res Commun. 2015 Dec 18;468(3):485-9. doi: 10.1016/j.bbrc.2015.06.137. Epub 2015 Jun 24. Biochem Biophys Res Commun. 2015. PMID: 26116770 Free PMC article. Review.
Cited by
-
In Vitro Imaging and Molecular Characterization of Ca2+ Flux Modulation by Nanosecond Pulsed Electric Fields.Int J Mol Sci. 2023 Oct 26;24(21):15616. doi: 10.3390/ijms242115616. Int J Mol Sci. 2023. PMID: 37958601 Free PMC article.
-
Involvement of Mitochondria in the Selective Response to Microsecond Pulsed Electric Fields on Healthy and Cancer Stem Cells in the Brain.Int J Mol Sci. 2024 Feb 13;25(4):2233. doi: 10.3390/ijms25042233. Int J Mol Sci. 2024. PMID: 38396911 Free PMC article.
-
Ultra-Low Intensity Post-Pulse Affects Cellular Responses Caused by Nanosecond Pulsed Electric Fields.Bioengineering (Basel). 2023 Sep 10;10(9):1069. doi: 10.3390/bioengineering10091069. Bioengineering (Basel). 2023. PMID: 37760171 Free PMC article.
-
Enhanced Cell Viability and Migration of Primary Bovine Annular Fibrosus Fibroblast-like Cells Induced by Microsecond Pulsed Electric Field Exposure.ACS Omega. 2023 Sep 30;8(40):36815-36822. doi: 10.1021/acsomega.3c03518. eCollection 2023 Oct 10. ACS Omega. 2023. PMID: 37841191 Free PMC article.
-
3D Cell Models in Radiobiology: Improving the Predictive Value of In Vitro Research.Int J Mol Sci. 2023 Jun 25;24(13):10620. doi: 10.3390/ijms241310620. Int J Mol Sci. 2023. PMID: 37445795 Free PMC article. Review.
References
-
- Meyer M., Reimand J., Lan X., Head R., Zhu X., Kushida M., Bayani J., Pressey J.C., Lionel A.C., Clarke I.D., et al. Single cell-derived clonal analysis of human glioblastoma links functional and genomic heterogeneity. Proc. Natl. Acad. Sci. USA. 2015;112:851–856. doi: 10.1073/pnas.1320611111. - DOI - PMC - PubMed
-
- Patel A.P., Tirosh I., Trombetta J.J., Shalek A.K., Gillespie S.M., Wakimoto H., Cahill D.P., Nahed B.V., Curry W.T., Martuza R.L., et al. Single-cell RNA-seq highlights intratumoral heterogeneity in primary glioblastoma. Science. 2014;344:1396–1401. doi: 10.1126/science.1254257. - DOI - PMC - PubMed
MeSH terms
Grants and funding
LinkOut - more resources
Full Text Sources
Medical
Molecular Biology Databases
Research Materials
Miscellaneous
