. 2022 Mar 10;23(6):3000.
doi: 10.3390/ijms23063000.

Optimized Protocol for Proportionate CNS Cell Retrieval as a Versatile Platform for Cellular and Molecular Phenomapping in Aging and Neurodegeneration

Affiliations

Optimized Protocol for Proportionate CNS Cell Retrieval as a Versatile Platform for Cellular and Molecular Phenomapping in Aging and Neurodegeneration

Quratul Ain et al. Int J Mol Sci. .

Abstract

Efficient purification of viable neural cells from the mature CNS has been historically challenging due to the heterogeneity of the inherent cell populations. Moreover, changes in cellular interconnections, membrane lipid and cholesterol compositions, compartment-specific biophysical properties, and intercellular space constituents demand technical adjustments for cell isolation at different stages of maturation and aging. Though such obstacles are addressed and partially overcome for embryonic premature and mature CNS tissues, procedural adaptations to an aged, progeroid, and degenerative CNS environment are underrepresented. Here, we describe a practical workflow for the acquisition and phenomapping of CNS neural cells at states of health, physiological and precocious aging, and genetically provoked neurodegeneration. Following recent, unprecedented evidence of post-mitotic cellular senescence (PoMiCS), the protocol appears suitable for such de novo characterization and phenotypic opposition to classical senescence. Technically, the protocol is rapid, efficient as for cellular yield and well preserves physiological cell proportions. It is suitable for a variety of downstream applications aiming at cell type-specific interrogations, including cell culture systems, Flow-FISH, flow cytometry/FACS, senescence studies, and retrieval of omic-scale DNA, RNA, and protein profiles. We expect suitability for transfer to other CNS targets and to a broad spectrum of engineered systems addressing aging, neurodegeneration, progeria, and senescence.

Keywords: CNS aging; CNS cell isolation; amyotrophic lateral sclerosis (ALS); neurodegeneration; neuropathology; progeria; senescence.


Conflict of interest statement

The authors declare no conflict of interest.

Figures
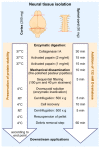
Figure 1
Figure 1
Flowchart delineating key procedural steps of the isolation algorithm. Bilateral murine cortices (~200 mg) or cervical and thoracic spinal cord moieties (~50 mg) are extracted. CNS tissue is digested by sequential treatment with collagenase type IA and activated papain coupled with mechanical trituration. To maintain the integrity of cellular components, D-trehalose is supplemented during enzymatic digestion and the cell recovery step. For downstream flow cytometry-based assays, the extract is cleared from debris. The procedure takes ~2–3 h to attain purified neural cell isolates.
Figure 4
Figure 4
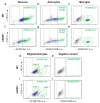
Dot plots representing individual neural cell populations in cervical and thoracic spinal cord isolates. (ad) Dot plots for the identification of neural cell entities in wild type animals. (fi) Dot plots depicting selection of different neural cell types in hSOD1G93A mutant animals. (e,j) Negative control for approval of primary antibody specificity in (e) wild type and (j) ALS transgenic conditions lacking AF488+ events with the CD68 marker, which primarily detects mononuclear cells but spares expression in CNS-autochthonic cell populations. (aj) grey colour indicates autofluorescence according to the gating strategy as delineated in the methods section; blue colour depicts singlet cell moieties with intermediate marker affinity; lower signal intensity is considered as background fluorescence. Populations marked in green represent cells with high marker affinity and strong AF488+ signal intensity and were assessed as cell type-specific events. FSC-H, forward scatter-height; AF488-A, Alexa Fluor 488-area.
Figure 5
Figure 5
Neural cell proportions in isolates derived from wild type and transgenic spinal cord. Cellular isolates from wild type and transgenic spinal cord were immuno-stained using entity-specific cellular markers. Individual cell types were identified with FACSAriaTM Fusion device and assessed via De Novo FCS Express version 5 Plus Flow Cytometry software. For wild type conditions, n = 4. For hSOD1G93A mutants, n = 4–6. Analyses were performed applying two-way ANOVA with Holm-Šidák’s post hoc test. NEU, neurons; AST, astrocytes; MG, microglia; OGD, oligodendrocytes; WT, wild type; SC, spinal cord.
Figure 6
Figure 6
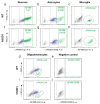
Dot plots representing individual neural cell populations in cortical isolates. (ad) Dot plots exemplifying cellular identities in wild type animals. (fi) Dot plots illustrating different neural cell types from hSOD1G93A mutant animals. (e,j) Negative control for approval of primary antibody specificity (e) in wild type and (j) ALS transgenic specimens. Note that two oligodendroglial populations are separated both in (d) the wild type and (i) the transgenic situation. FSC-H, forward scatter-height; AF488-A, Alexa Fluor 488-area.
Figure 7
Figure 7
Neural cell proportions in isolates from wild type and transgenic brain cortices. (a) Cellular isolates originating from wild type and transgenic cortices were immune-stained using entity-specific cellular markers. Individual cell types were identified with FACSAriaTM Fusion device and assessed via De Novo FCS Express version 5 Plus Flow Cytometry software. (b) Oligodendrocyte proportions in cortical isolates derived from wild type and hSOD1G93A mutant animals. Oligodendrocytes clustered in two subpopulations, displaying altered proportions in the diseased state. The fraction in gate 1, characterized by smaller oligodendrocytes with intense CAII signals (Figure 6d,i), gained in numbers, while the moiety in gate 2, featuring lower signal intensities but higher cell size (Figure 6d,i), decreased in quantity as compared to controls. The entire amount remained unchanged in the two groups. For wild type and transgenic hSOD1G93A mice, n = 3–6 in (a) and n = 3 in (b). For (a,b), a multiple comparison was performed by two-way ANOVA with Šidák’s post hoc test. NEU, neurons; AST, astrocytes; MG, microglia; OGD, oligodendrocytes; WT, wild type; Ctx, cortex.
Figure 12
Figure 12
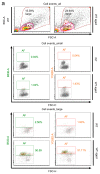
Gating strategies for neural cell selection from the CNS isolate. Scatter plots exemplifying flow cytometric cell events from a young wild type C57BL/6 cortex. (ad) Representative dot plots generated on the FACSAriaTM Fusion device and visualized with De Novo FCS Express version 5 Plus Flow Cytometry software: (a) Black moiety, representing debris and apoptotic cells, is excluded and vital cells are gated as ‘Cells’ on the basis of size (FSC-A) and granularity (SSC-A) (displayed in red). (b) Doublets are excluded. Singlets are selected on the basis of size and identified by their stringent, linear relation of FSC-A and FSC-H parameters represented by x- and y-axes. (c,d) The AF488 population, discriminated by (c) in absence of any antibody staining and (d) under control application of an appropriate secondary antibody while omitting a primary marker antibody, is excluded and thus distinguishes autofluorescence from specific signal events. (e) Gate view for sequentially identified neural subpopulations. Red, vital population; blue, singlets within vital moiety; grey, autofluorescence; green, AF488+ target population encompassing vital singlets. FSC-A, forward scatter-area; SSC-A, side scatter-area, AF488-A, Alexa Fluor 488-area, FSC-H, forward scatter-height.
Figure 2
Figure 2
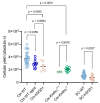
Cellular yield obtained from cortical and spinal cord isolates under healthy mature, chronological aging, progeroid, and ALS-like conditions. Absolute neural cell numbers collected from individual isolates after debris removal step are displayed for young mature (n = 24), wild type aged (n = 10), and hSOD1G93A mutant (n = 6) cortices, as well as for Klotho+/+ control (n = 3) and progeroid Klotho−/− (n = 9) cortices. Cellular yield from spinal cord was assessed from wild type (n = 31) and hSOD1G93A (n = 17) mutants. For statistical analyses, a one-way ANOVA with post hoc Tukey’s multiple comparison test was performed for cortex and a Student’s t-test was applied for spinal cord. WT, wild type; Ctx, cortex; SC, spinal cord; n, numbers.
Figure 3
Figure 3
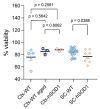
Percent cell viability for cortical and spinal cord isolates underlying wild type, aging, and ALS-like states. Neural cell viability was estimated after exclusion of debris by trypan blue assay and expressed as the percentage of cells surviving the isolation procedure. Cortex: n = 5 for wild type; n = 3 for aging; n = 3 for hSOD1G93A specimens. Spinal cord: n = 19 for wild type; n = 8 for hSOD1G93A specimens. For analyses on cortex, a multiple comparison was performed applying one-way ANOVA with post hoc Tukey’s test. For analyses on spinal cord, Student’s t-test was applied. WT, wild type; Ctx, cortex; SC, spinal cord.
Figure 8
Figure 8
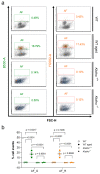
Cellular autofluorescence exemplified for cortex under wild type aged and progeroid conditions in comparison to respective controls. (a) Autofluorescence (AF), indicated by broad signal emissions both from the green (B530) and yellow/green (YG582) channels, was low in young wild type control specimens (a, upper row) but drastically increased in cellular isolates from aged counterparts (a, second row). By contrast, specimens from Klotho−/− animals at the stage of severe symptoms remained without an accumulation of AF cells (a, bottom row), which showed a comparable frequency in Klotho+/+ controls (a, third row). (b) Quantitative analyses of cells emitting AF, separated for B530 and YG582 channels. n = 3 per group and parameter. For b, a multiple comparison was performed by two-way ANOVA with Tukey’s post hoc test. B530-A, B530-area; YG582-A, YG582-area; AF_G, autofluorescence in green B530 channel; AF_R, autofluorescence in yellow/green YG582 channel; FSC-H, forward scatter-height; WT, wild type.
Figure 9
Figure 9
Cellular autofluoescence exemplified for spinal cord under neurodegenerative hSOD1G93A and young wild type control conditions. Autofluorescence (AF), indicated by simultaneous, broad signal emissions from the green (B530) and yellow/green (YG582) channel, in specimens derived from symptomatic hSOD1G93A mutant animals was indistinguishable from control isolates in both channels. AF, autofluorescence; FSC-H, forward scatter-height; WT, wild type, B530-A, B530-area; YG582-A, YG582-area. n = 3 per group and parameter.
Figure 10
Figure 10
Cellular autofluorescence exemplified for young versus aged wild type cortical specimens. (a) The total amount of vital cellular events harvested by flow cytometry, excluding apoptotic moieties, was size-separated into a condensed cluster of small cells and a scattered population of large-size cells (top row in a). Gating against autofluorescence (AF), i.e., displaying a typical ubiquitous emission from both the green (B530) and yellow/green (YG582) channels, indicated a drastic age-dependent rise in AF signals (a, second row in last block) as compared to young specimens (a, first row in last block). The data illustrate that the vast majority of AF cells originate from large-size cells (last block) with increased granularity, rather than from small-size cells (middle block) as assessed by FSC-A and SSC-A parameters, irrespective of age. (b,c) Quantitative discrimination of the total amount of sorted cellular events, according to the following parameters: total of small (b) and large cells (c); singlets (SL) of small (b) and large (c) moieties; singlets displaying AF in green B530 (SL_G) or yellow/green YG582 (SL_R) channel in either the small-size (b) or large-size (c) population. AF, autofluorescence; SL, singlets; WT, wild type; FSC-A, forward scatter-area; FSC-H, forward scatter-height; SSC-A, side scatter-area, B530-A, B530-area; YG582-A, YG582-area. n = 3–4 per group and parameter. For (b), a multiple comparison was performed by two-way ANOVA with Tukey’s post hoc test.
Figure 10
Figure 10
Cellular autofluorescence exemplified for young versus aged wild type cortical specimens. (a) The total amount of vital cellular events harvested by flow cytometry, excluding apoptotic moieties, was size-separated into a condensed cluster of small cells and a scattered population of large-size cells (top row in a). Gating against autofluorescence (AF), i.e., displaying a typical ubiquitous emission from both the green (B530) and yellow/green (YG582) channels, indicated a drastic age-dependent rise in AF signals (a, second row in last block) as compared to young specimens (a, first row in last block). The data illustrate that the vast majority of AF cells originate from large-size cells (last block) with increased granularity, rather than from small-size cells (middle block) as assessed by FSC-A and SSC-A parameters, irrespective of age. (b,c) Quantitative discrimination of the total amount of sorted cellular events, according to the following parameters: total of small (b) and large cells (c); singlets (SL) of small (b) and large (c) moieties; singlets displaying AF in green B530 (SL_G) or yellow/green YG582 (SL_R) channel in either the small-size (b) or large-size (c) population. AF, autofluorescence; SL, singlets; WT, wild type; FSC-A, forward scatter-area; FSC-H, forward scatter-height; SSC-A, side scatter-area, B530-A, B530-area; YG582-A, YG582-area. n = 3–4 per group and parameter. For (b), a multiple comparison was performed by two-way ANOVA with Tukey’s post hoc test.
Figure 11
Figure 11
Autofluorescence quenching in young and aged cortical specimens. (af) Dot plots representative of unquenched (ac) wild type young and (df) aged specimens. (gl) Dot plots for (gi) wild type young and (jl) aged samples displaying the effect of autofluorescence quenching in B530, YG582, and V450 channels that detect green, red, and violet fluorescence signals, respectively. FSC-H, forward scatter-height; B530-A, B530-area, YG582-A, YG582 area, V450-A, V450-area.

Similar articles

Cited by

References

    1. Brewer G.J., Torricelli J.R. Isolation and culture of adult neurons and neurospheres. Nat. Protoc. 2007;2:1490–1498. doi: 10.1038/nprot.2007.207. - DOI - PubMed
    1. Del Rio J.A., Soriano E. Regenerating cortical connections in a dish: The entorhino-hippocampal organotypic slice co-culture as tool for pharmacological screening of molecules promoting axon regeneration. Nat. Protoc. 2010;5:217–226. doi: 10.1038/nprot.2009.202. - DOI - PubMed
    1. Giandomenico S.L., Sutcliffe M., Lancaster M.A. Generation and long-term culture of advanced cerebral organoids for studying later stages of neural development. Nat. Protoc. 2021;16:579–602. doi: 10.1038/s41596-020-00433-w. - DOI - PMC - PubMed
    1. Kretz A., Marticke J.K., Happold C.J., Schmeer C., Isenmann S. A primary culture technique of adult retina for regeneration studies on adult CNS neurons. Nat. Protoc. 2007;2:131–140. doi: 10.1038/nprot.2007.12. - DOI - PubMed
    1. Sasaki T., Matsuki N., Ikegaya Y. Targeted axon-attached recording with fluorescent patch-clamp pipettes in brain slices. Nat. Protoc. 2012;7:1228–1234. doi: 10.1038/nprot.2012.061. - DOI - PubMed

LinkOut - more resources