. 2022 Mar 10;23(6):3015.
doi: 10.3390/ijms23063015.

Low Light Increases the Abundance of Light Reaction Proteins: Proteomics Analysis of Maize (Zea mays L.) Grown at High Planting Density

Affiliations

Low Light Increases the Abundance of Light Reaction Proteins: Proteomics Analysis of Maize (Zea mays L.) Grown at High Planting Density

Bin Zheng et al. Int J Mol Sci. .

Abstract

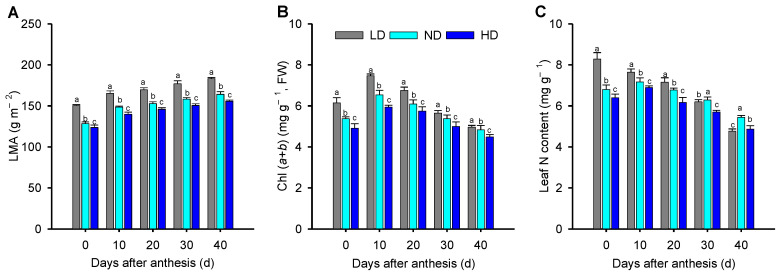
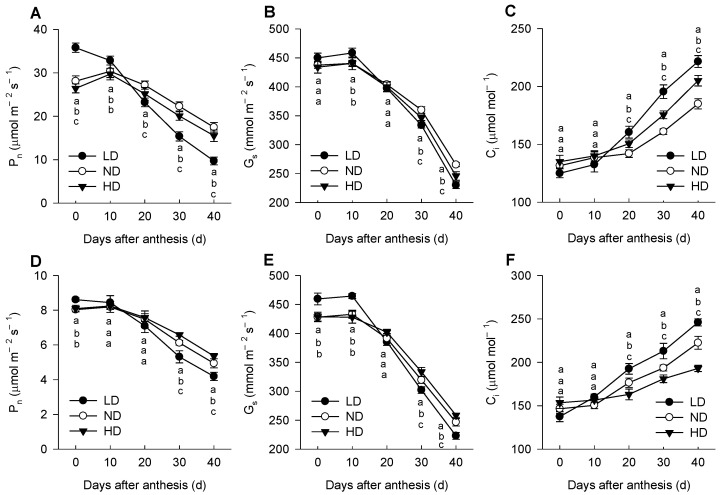
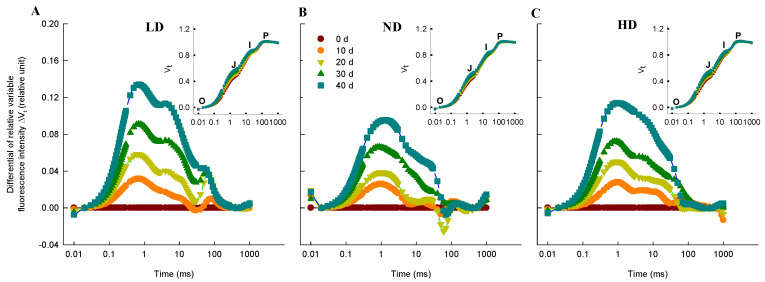
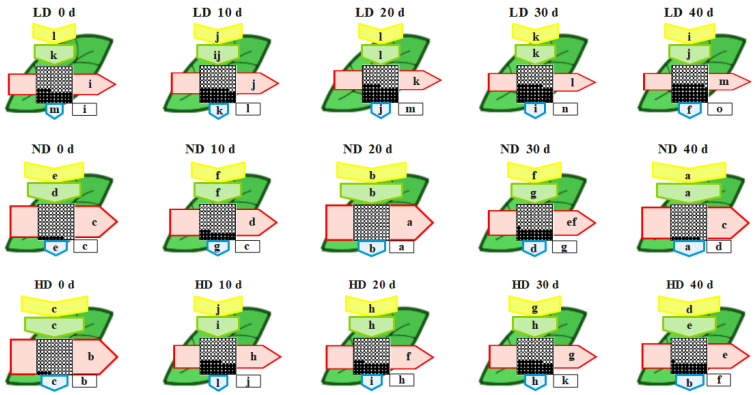
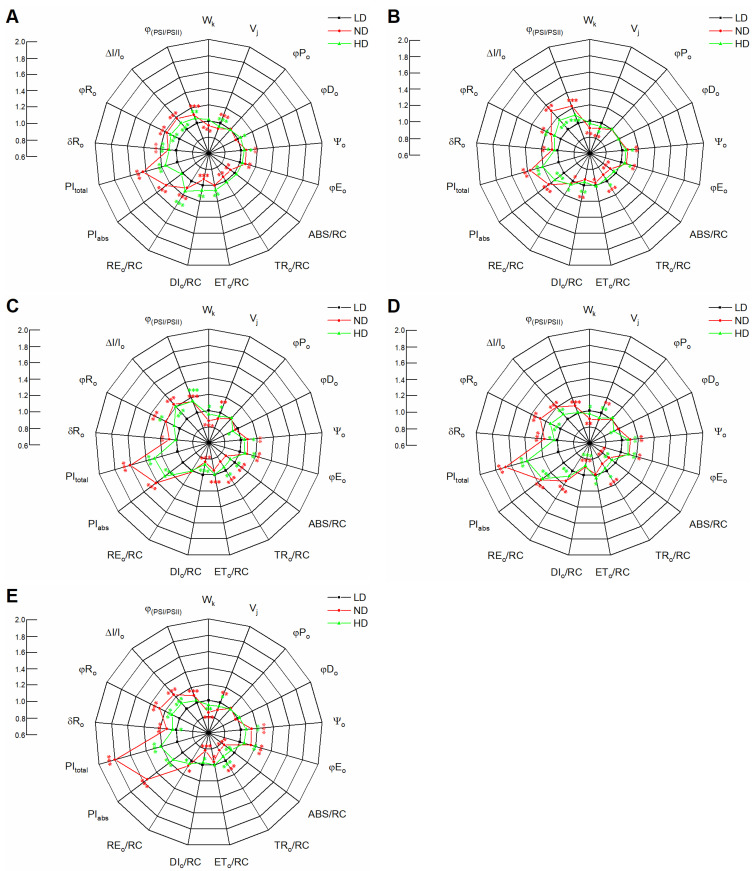
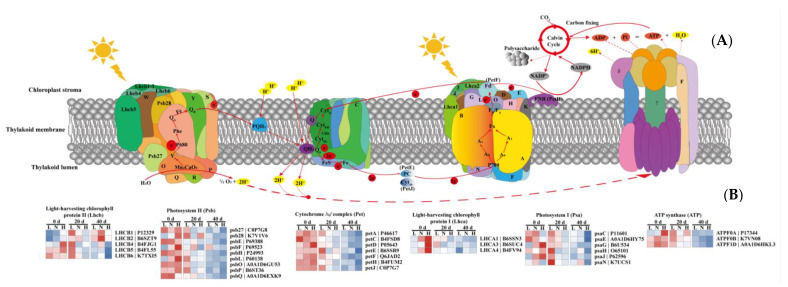
Maize (Zea mays L.) is usually planted at high density, so most of its leaves grow in low light. Certain morphological and physiological traits improve leaf photosynthetic capacity under low light, but how light absorption, transmission, and transport respond at the proteomic level remains unclear. Here, we used tandem mass tag (TMT) quantitative proteomics to investigate maize photosynthesis-related proteins under low light due to dense planting, finding increased levels of proteins related to photosystem II (PSII), PSI, and cytochrome b6f. These increases likely promote intersystem electron transport and increased PSI end electron acceptor abundance. OJIP transient curves revealed increases in some fluorescence parameters under low light: quantum yield for electron transport (φEo), probability that an electron moves beyond the primary acceptor QA-o), efficiency/probability of electron transfer from intersystem electron carriers to reduction end electron acceptors at the PSI acceptor side (δRo), quantum yield for reduction of end electron acceptors at the PSI acceptor side (φRo), and overall performance up to the PSI end electron acceptors (PItotal). Thus, densely planted maize shows elevated light utilization through increased electron transport efficiency, which promotes coordination between PSII and PSI, as reflected by higher apparent quantum efficiency (AQE), lower light compensation point (LCP), and lower dark respiration rate (Rd).

Keywords: chlorophyll fluorescence; dense planting; low light; maize; photosynthesis; proteomics.


Conflict of interest statement

The authors have declared no conflict of interest. All authors read and approved the final manuscript.

Figures

Figure 1
Figure 1
Maize leaf physiological parameters under low (LD), normal (ND), and high density (HD) planting at 0, 10, 20, 30, and 40 d after anthesis. (A) Leaf dry mass per area (LMA), (B) leaf total chlorophyll content (Chl (a + b)) and (C) leaf nitrogen content. Means ± SD, n = 5. Different lowercase letters (a, b, c) denote statistical differences by LSD test (p ≤ 0.05) between different treatments.
Figure 2
Figure 2
Changes in net photosynthetic rate (Pn, (A,D)), stomatal conductance (Gs, (B,E)), and intercellular CO2 concentration (Ci, (C,F)) of maize leaves under high-light (HL, 1600 μmol m−2 s−1; (AC)) and low-light (LL, 300 μmol m−2 s−1; (DF)) conditions. Means ± SD, n = 5. Different lowercase letters (a, b, c) denote statistical differences by LSD test (p ≤ 0.05) between different treatments. LD, low density; ND, normal density; HD, high density.
Figure 3
Figure 3
Chlorophyll a fluorescence (ChlF) induction transient curves of maize leaves. (AC) Effects of planting density ((A), low density, LD; (B), normal density, ND; (C), high density, HD) on differential plots of relative ChlF (ΔVt = (Ft − Fo)/(Fm − Fo) − Vt,0d) in the leaves of maize at 0, 10, 20, 30, and 40 d after anthesis. For ΔVt analysis, the fluorescence of leaves at 0 d after anthesis was used as a reference and set to 0. For the insert plot in (AC), the chlorophyll a fluorescence (ChlF) transient OJIP kinetics curves, O, J, I, and P, represent the fluorescence intensity at 20 μs, 2 ms, 30 ms, and 500 ms, respectively. Values are means (n = 9).
Figure 4
Figure 4
Leaf models showing the phenomenological energy fluxes per excited cross section (CS) of maize leaves grown under low (LD), normal (ND) and high density (HD) planting at 0, 10, 20, 30, and 40 d after anthesis. Each relative value is the mean (n = 9), and the width of each arrow corresponds to the intensity of the flux. ABS/CS, approximate absorption flux per CS (yellow arrows); TR/CS, trapped energy flux per CS (green arrows); ET/CS, electron transport flux per CS (red arrows); DI/CS, dissipated energy flux per CS (blue arrows); RC/CS, percent of active/inactive reaction centers (circles inscribed in squares). White circles inscribed in squares represent reduced QA reaction centers (active), black circles represent non-reducing QA reaction centers (inactive), and 100% of active reaction centers represent the highest mean value observed during the three measured stages. Means followed by the same letter (a–m) for each parameter are not significantly different from each other using the LSD test (p ≤ 0.05). Letters are inscribed into arrows, except for RC/CS where they are placed in a box in the lower right corner of the square with circles. LD, low density; ND, normal density; HD, high density; 0, 20, and 40 d, days after anthesis.
Figure 5
Figure 5
Spider plots showing changes in JIP-test parameters in maize leaves planted in low density (LD), normal density (ND), and high density (HD) and measured at 0 (A), 10 (B), 20 (C), 30 (D), and 40 d (E) after anthesis. Values are means (n = 9). Asterisks (*, **, and ***) denote significant differences between different planting densities according to Fisher’s LSD test at p ≤ 0.05, p ≤ 0.01, and p ≤ 0.001, respectively. Significant differences between low and normal (red) or high (green) density treatment are denoted by asterisks of different colors.
Figure 6
Figure 6
Overview of protein accumulation. (A) Venn diagrams depicting the overlap of differentially abundant proteins (DAPs) between different treatments at 0, 20, and 40 d after anthesis. (B) Bar chart showing the number of up- and down-regulated DAPs in each of the comparison groups at 0, 20, and 40 d after anthesis. Magenta color indicates up-regulated proteins, and green color indicates down-regulated proteins. (C) Venn diagram showing the distribution of up- and down-regulated DAPs in ND vs. LD and HD vs. LD. (D) Localizations of identified proteins. LD, low density; ND, normal density; HD, high density.
Figure 7
Figure 7
Heatmaps obtained from GO and KEGG pathway analysis comparing the differentially abundant protein (DAP) expression patterns under different conditions. (A) Biological process analysis; (B) cellular component analysis; (C) molecular function analysis; and (D) KEGG pathway analysis. Colored scales of the Z score (–log10 p-value) are shown; proteins that accumulated at high levels are in red, and proteins with low accumulation levels are in blue. LD, low density; ND, normal density; HD, high density; 0, 20, and 40 d, days after anthesis.
Figure 7
Figure 7
Heatmaps obtained from GO and KEGG pathway analysis comparing the differentially abundant protein (DAP) expression patterns under different conditions. (A) Biological process analysis; (B) cellular component analysis; (C) molecular function analysis; and (D) KEGG pathway analysis. Colored scales of the Z score (–log10 p-value) are shown; proteins that accumulated at high levels are in red, and proteins with low accumulation levels are in blue. LD, low density; ND, normal density; HD, high density; 0, 20, and 40 d, days after anthesis.
Figure 8
Figure 8
Light-induced changes in the levels of differentially abundant proteins (DAPs) in the photosynthetic apparatus. (A) Schematic representation of photosynthetic linear electron flow and proton translocation driven by protein complexes in the thylakoid membrane. (B) Levels of differentially abundant proteins (DAPs) in the photosynthetic apparatus. Core light-harvesting chlorophyll protein II and I are Lhcb 1-6 and Lhca 1-4, respectively. Core PSII subunits are Psb27, Psb28, PsbO, PsbP, PsbQ, PsbR, PsbS, PsbW, and PsbY. Core Cytb6f subunits are PetC, PetE, PetF, PetH, and PetJ. Core PSI subunits are PsaD, PsaE, PsaF, PsaG, PsaH, PsaK, PsaL, PsaN, and PsaO. Core subunits related to ATP synthase are ATPF, ATP γ, and ATP δ. Colored scales of the Z score (–log10 p-value) are shown: proteins that accumulated at high levels are in red, and proteins with low accumulation levels are in blue. L, low density; N, normal density; H, high density; 0, 20, and 40 d, days after anthesis.

References

    1. Sher A., Khan A., Li J.C., Ahmad M.I., Jamoro S.A. Response of maize grown under high plant density; performance, issues and management—A critical review. Adv. Crop. Sci. Technol. 2017;5:1000275. doi: 10.4172/2329-8863.1000275. - DOI
    1. Fu J., Sun Y., Chu X., Yang L., Xu Y., Hu T. Exogenously applied nitric oxide (NO) alleviates shade-induced oxidative stress in tall fescue. J. Hortic. Sci. Biotechnol. 2014;89:193–200. doi: 10.1080/14620316.2014.11513068. - DOI
    1. Yao X., Li C., Li S., Zhu Q., Zhang H., Wang H., Yu C., Steven K.S.M., Xie F. Effect of shade on leaf photosynthetic capacity, light-intercepting, electron transfer and energy distribution of soybeans. Plant Growth Regul. 2017;83:409–416. doi: 10.1007/s10725-017-0307-y. - DOI
    1. Poorter H., Nagel O. The role of biomass allocation in the growth response of plants to different levels of light, CO2, nutrients and water: A quantitative review. Aust. J. Plant Physiol. 2000;27:595–607.
    1. Leong T.Y., Anderson J.M. Adaptation of the thylakoid membranes of pea chloroplasts to light intensities. II. Regulation of electron transport capacities, electron carriers, coupling factor (CF1) activity and rates of photosynthesis. Photosynth. Res. 1984;5:117–128. doi: 10.1007/BF00028525. - DOI - PubMed

MeSH terms

Substances