

Reduced Percentage of CD14dimCD16+SLAN+ Monocytes Producing TNF and IL-12 as an Immunological Sign of CLL Progression
- PMID: 35328450
- PMCID: PMC8951649
- DOI: 10.3390/ijms23063029
Reduced Percentage of CD14dimCD16+SLAN+ Monocytes Producing TNF and IL-12 as an Immunological Sign of CLL Progression
Abstract
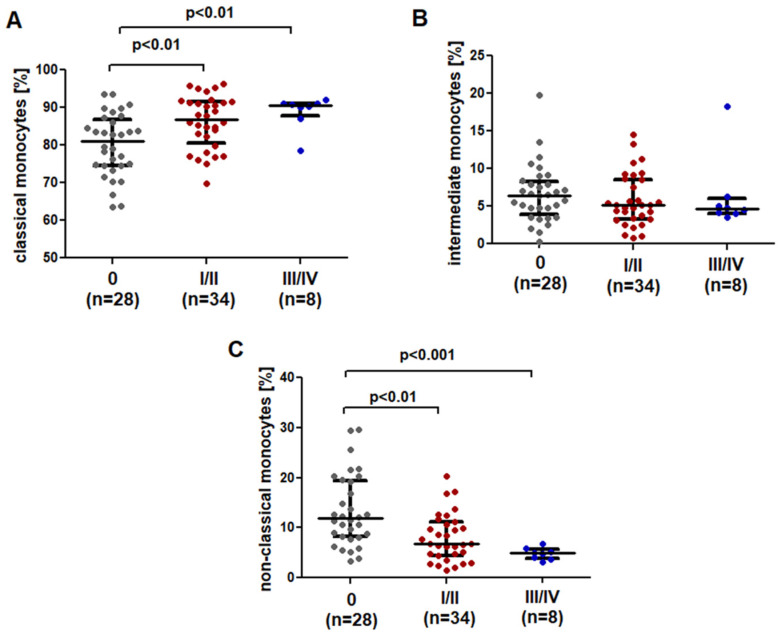
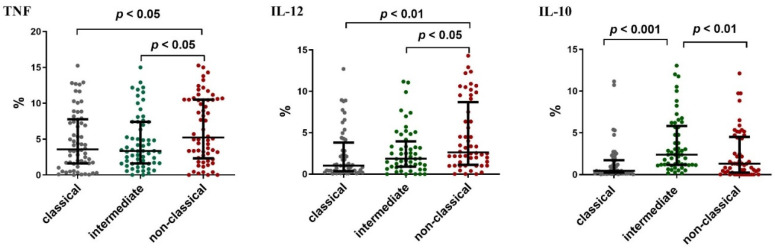
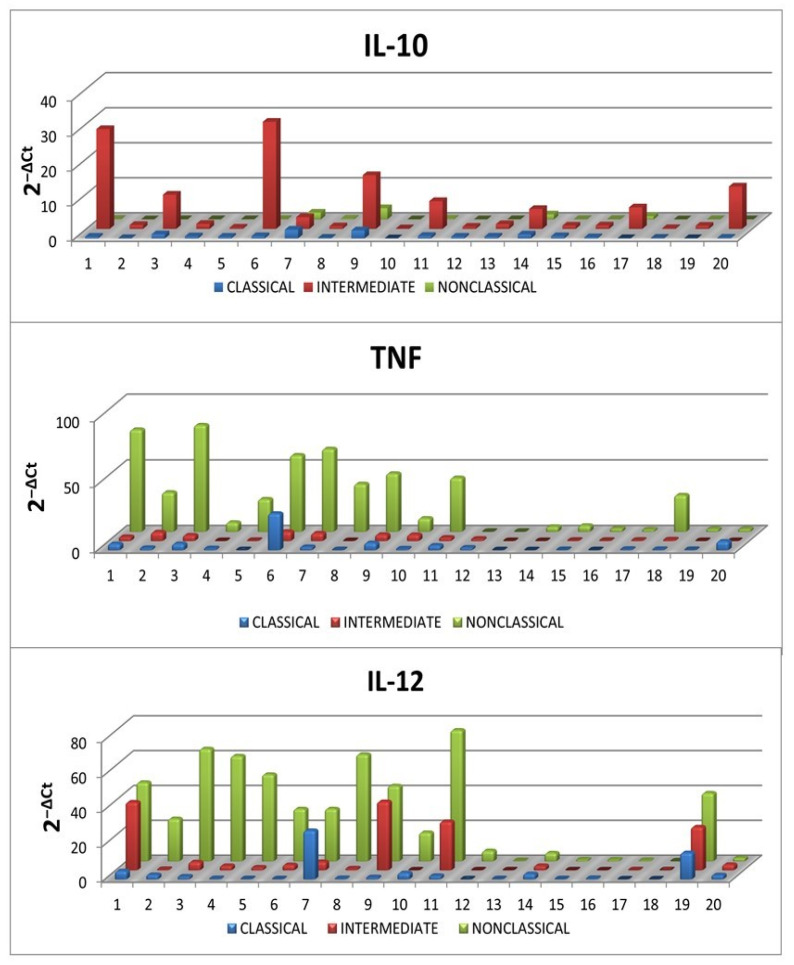
Monocytes are one of the least studied immune cells with a potentially important role in the pathogenesis of chronic lymphocytic leukemia (CLL). Nevertheless, data regarding the role of subpopulations of monocytes in the CLL microenvironment are still limited. For the very first time, this study presents an assessment of monocyte subsets divided according to SLAN and CD16 expression in CLL patients. The study involved 70 freshly diagnosed CLL patients and 35 healthy donors. Using flow cytometry, monocyte subpopulations were assessed among PBMCs. CD14+ monocytes can be divided into: "classical" (CD14+CD16-SLAN-), "intermediate" (CD14+CD16+SLAN-) and "non-classical" (CD14dimCD16+SLAN+). In our study, we noted an increased percentage of non-classical monocytes with intracellular expression of TNF and IL-12. On the other hand, among the intermediate monocytes, a significantly higher percentage of cells synthesizing anti-inflammatory IL-10 was detected. The percentage of CD14dimCD16+SLAN+ monocytes producing TNF and IL-12 decreased with the stage of CLL and inversely correlated with the expression of the prognostic factors ZAP-70 and CD38. Moreover, the percentage of CD14dimCD16+SLAN+ monocytes producing TNF and IL-12 was lower in CLL patients requiring treatment. This may indicate the beneficial effect of non-classical monocytes on the anti-tumor response.
Keywords: SLAN; chronic lymphocytic leukemia; monocytes.
Conflict of interest statement
The authors declare no conflict of interest.
Figures


Similar articles
-
Pro- vs. Anti-Inflammatory Features of Monocyte Subsets in Glioma Patients.Int J Mol Sci. 2023 Jan 18;24(3):1879. doi: 10.3390/ijms24031879. Int J Mol Sci. 2023. PMID: 36768201 Free PMC article.
-
Circulating classical CD14++CD16- monocytes predict shorter time to initial treatment in chronic lymphocytic leukemia patients: Differential effects of immune chemotherapy on monocyte-related membrane and soluble forms of CD163.Oncol Rep. 2015 Sep;34(3):1269-78. doi: 10.3892/or.2015.4088. Epub 2015 Jun 26. Oncol Rep. 2015. PMID: 26135617
-
Expression of CD163 and HLA-DR molecules on the monocytes in chronic lymphocytic leukemia patients.Folia Histochem Cytobiol. 2020;58(1):17-24. doi: 10.5603/FHC.a2020.0002. Epub 2020 Mar 16. Folia Histochem Cytobiol. 2020. PMID: 32176313
-
Maximal Exercise Alters the Inflammatory Phenotype and Response of Mononuclear Cells.Med Sci Sports Exerc. 2018 Apr;50(4):675-683. doi: 10.1249/MSS.0000000000001480. Med Sci Sports Exerc. 2018. PMID: 29112629
-
Lower HDL-C levels are associated with higher expressions of CD16 on monocyte subsets in coronary atherosclerosis.Int J Med Sci. 2020 Aug 1;17(14):2171-2179. doi: 10.7150/ijms.47998. eCollection 2020. Int J Med Sci. 2020. PMID: 32922178 Free PMC article.
Cited by
-
Spontaneous Regression Accompanied by Concomitant Immune Alterations in a Patient with Chronic Lymphocytic Leukemia.Ann Case Rep. 2024;9(1):1539. doi: 10.29011/2574-7754.101539. Epub 2024 Jan 4. Ann Case Rep. 2024. PMID: 38939045 Free PMC article.
-
A High Percentage of CD16+ Monocytes Correlates with the Extent of Bone Erosion in Chronic Lymphocytic Leukemia Patients: The Impact of Leukemic B Cells in Monocyte Differentiation and Osteoclast Maturation.Cancers (Basel). 2022 Dec 3;14(23):5979. doi: 10.3390/cancers14235979. Cancers (Basel). 2022. PMID: 36497460 Free PMC article.
-
Mapping the tumor microenvironment in clear cell renal carcinoma by single-cell transcriptome analysis.Front Genet. 2023 Jul 18;14:1207233. doi: 10.3389/fgene.2023.1207233. eCollection 2023. Front Genet. 2023. PMID: 37533434 Free PMC article.
-
Pro- vs. Anti-Inflammatory Features of Monocyte Subsets in Glioma Patients.Int J Mol Sci. 2023 Jan 18;24(3):1879. doi: 10.3390/ijms24031879. Int J Mol Sci. 2023. PMID: 36768201 Free PMC article.
-
MLR Corresponds to the Functional Status of Monocytes in Chronic Lymphocytic Leukemia.Int J Inflam. 2025 Aug 8;2025:4443773. doi: 10.1155/ijin/4443773. eCollection 2025. Int J Inflam. 2025. PMID: 40822140 Free PMC article.
References
MeSH terms
Substances
Grants and funding
LinkOut - more resources
Full Text Sources
Research Materials
