Sevoflurane Effects on Neuronal Energy Metabolism Correlate with Activity States While Mitochondrial Function Remains Intact
- PMID: 35328453
- PMCID: PMC8949020
- DOI: 10.3390/ijms23063037
Sevoflurane Effects on Neuronal Energy Metabolism Correlate with Activity States While Mitochondrial Function Remains Intact
Abstract
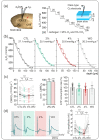
During general anesthesia, alterations in neuronal metabolism may induce neurotoxicity and/or neuroprotection depending on the dose and type of the applied anesthetic. In this study, we investigate the effects of clinically relevant concentrations of sevoflurane (2% and 4%, i.e., 1 and 2 MAC) on different activity states in hippocampal slices of young Wistar rats. We combine electrophysiological recordings, partial tissue oxygen (ptiO2) measurements, and flavin adenine dinucleotide (FAD) imaging with computational modeling. Sevoflurane minimally decreased the cerebral metabolic rate of oxygen (CMRO2) while decreasing synaptic transmission in naive slices. During pharmacologically induced gamma oscillations, sevoflurane impaired network activity, thereby decreasing CMRO2. During stimulus-induced neuronal activation, sevoflurane decreased CMRO2 and excitability while basal metabolism remained constant. In this line, stimulus-induced FAD transients decreased without changes in basal mitochondrial redox state. Integration of experimental data and computer modeling revealed no evidence for a direct effect of sevoflurane on key enzymes of the citric acid cycle or oxidative phosphorylation. Clinically relevant concentrations of sevoflurane generated a decent decrease in energy metabolism, which was proportional to the present neuronal activity. Mitochondrial function remained intact under sevoflurane, suggesting a better metabolic profile than isoflurane or propofol.
Keywords: metabolism; neuron; sevoflurane.
Conflict of interest statement
The authors declare no conflict of interest.
Figures


Similar articles
-
Isoflurane lowers the cerebral metabolic rate of oxygen and prevents hypoxia during cortical spreading depolarization in vitro: An integrative experimental and modeling study.J Cereb Blood Flow Metab. 2024 Jun;44(6):1000-1012. doi: 10.1177/0271678X231222306. Epub 2023 Dec 23. J Cereb Blood Flow Metab. 2024. PMID: 38140913 Free PMC article.
-
Possible neurotoxicity of the anesthetic propofol: evidence for the inhibition of complex II of the respiratory chain in area CA3 of rat hippocampal slices.Arch Toxicol. 2018 Oct;92(10):3191-3205. doi: 10.1007/s00204-018-2295-8. Epub 2018 Aug 24. Arch Toxicol. 2018. PMID: 30143847 Free PMC article.
-
Low neuronal metabolism during isoflurane-induced burst suppression is related to synaptic inhibition while neurovascular coupling and mitochondrial function remain intact.J Cereb Blood Flow Metab. 2021 Oct;41(10):2640-2655. doi: 10.1177/0271678X211010353. Epub 2021 Apr 25. J Cereb Blood Flow Metab. 2021. PMID: 33899556 Free PMC article.
-
Preservation of the ration of cerebral blood flow/metabolic rate for oxygen during prolonged anesthesia with isoflurane, sevoflurane, and halothane in humans.Anesthesiology. 1996 Mar;84(3):555-61. doi: 10.1097/00000542-199603000-00010. Anesthesiology. 1996. PMID: 8659783 Clinical Trial.
-
[Newer inhalation anaesthetics and neuro-anaesthesia: what is the place for sevoflurane or desflurane?].Ann Fr Anesth Reanim. 2004 Apr;23(4):367-74. doi: 10.1016/j.annfar.2004.01.012. Ann Fr Anesth Reanim. 2004. PMID: 15120783 Review. French.
Cited by
-
Isoflurane lowers the cerebral metabolic rate of oxygen and prevents hypoxia during cortical spreading depolarization in vitro: An integrative experimental and modeling study.J Cereb Blood Flow Metab. 2024 Jun;44(6):1000-1012. doi: 10.1177/0271678X231222306. Epub 2023 Dec 23. J Cereb Blood Flow Metab. 2024. PMID: 38140913 Free PMC article.
-
NDUFA10-Mediated ATP Reduction in Medial Prefrontal Cortex Exacerbates Burst Suppression in Aged Mice.CNS Neurosci Ther. 2025 May;31(5):e70453. doi: 10.1111/cns.70453. CNS Neurosci Ther. 2025. PMID: 40415484 Free PMC article.
-
lncRNA PART1 improves sevoflurane-induced impairments in learning and cognitive function by regulating miR-16-5p expression and reducing neuroinflammation.Toxicol Res (Camb). 2025 Jan 26;14(1):tfaf009. doi: 10.1093/toxres/tfaf009. eCollection 2025 Feb. Toxicol Res (Camb). 2025. PMID: 39872305
-
Substance specific EEG patterns in mice undergoing slow anesthesia induction.BMC Anesthesiol. 2024 May 3;24(1):167. doi: 10.1186/s12871-024-02552-3. BMC Anesthesiol. 2024. PMID: 38702608 Free PMC article.
-
The effects of general anesthetics on mitochondrial structure and function in the developing brain.Front Neurol. 2023 Jul 18;14:1179823. doi: 10.3389/fneur.2023.1179823. eCollection 2023. Front Neurol. 2023. PMID: 37533472 Free PMC article. Review.
References
-
- Soriano S.G., Vutskits L., Jevtovic-Todorovic V., Hemmings H.C., 2016 BJA Neurotoxicology and Neuroplasticity Study Group Thinking, fast and slow: Highlights from the 2016 BJA seminar on anaesthetic neurotoxicity and neuroplasticity. Br. J. Anaesth. 2017;119:443–447. doi: 10.1093/bja/aex238. - DOI - PMC - PubMed
-
- Hesse S., Kreuzer M., Hight D., Gaskell A., Devari P., Singh D., Taylor N.B., Whalin M.K., Lee S., Sleigh J.W., et al. Association of electroencephalogram trajectories during emergence from anaesthesia with delirium in the postanaesthesia care unit: An early sign of postoperative complications. Br. J. Anaesth. 2019;122:622–634. doi: 10.1016/j.bja.2018.09.016. - DOI - PMC - PubMed
-
- Soehle M., Dittmann A., Ellerkmann R.K., Baumgarten G., Putensen C., Guenther U. Intraoperative burst suppression is associated with postoperative delirium following cardiac surgery: A prospective, observational study. BMC Anesthesiol. 2015;15:61. doi: 10.1186/s12871-015-0051-7. - DOI - PMC - PubMed
MeSH terms
Substances
Grants and funding
LinkOut - more resources
Full Text Sources

