. 2022 Mar 12;23(6):3066.
doi: 10.3390/ijms23063066.

Dysfunctional cGMP Signaling Leads to Age-Related Retinal Vascular Alterations and Astrocyte Remodeling in Mice

Affiliations

Dysfunctional cGMP Signaling Leads to Age-Related Retinal Vascular Alterations and Astrocyte Remodeling in Mice

Joseph M Holden et al. Int J Mol Sci. .

Abstract

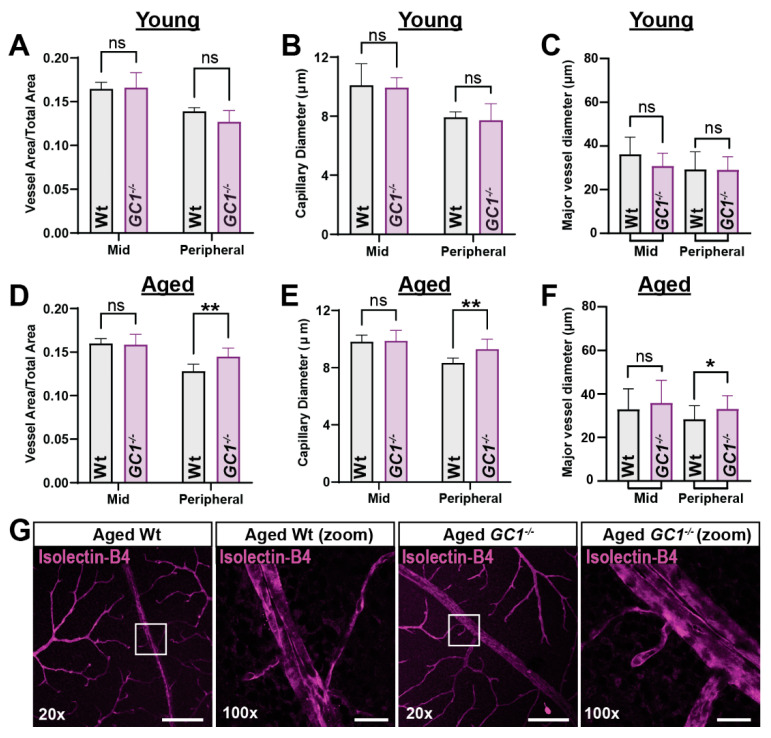
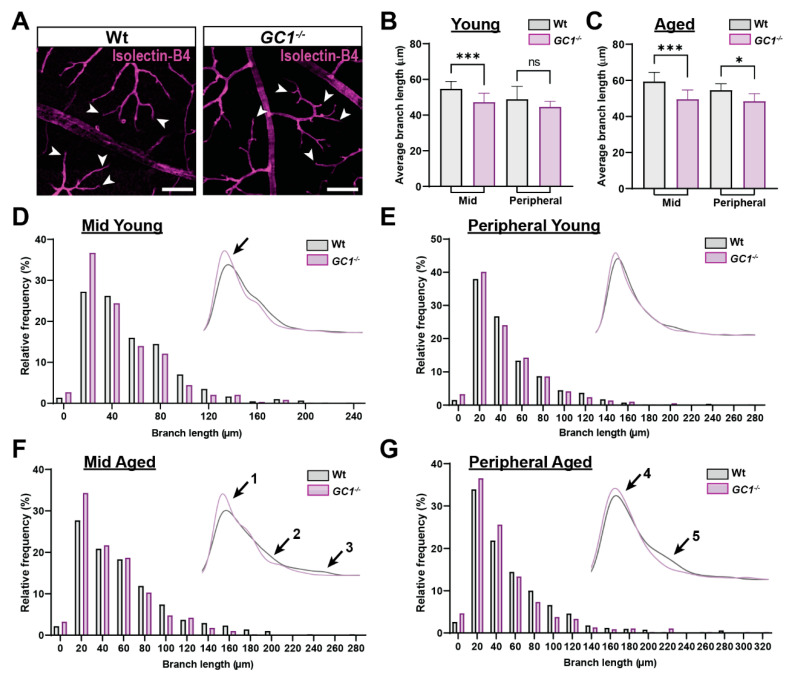
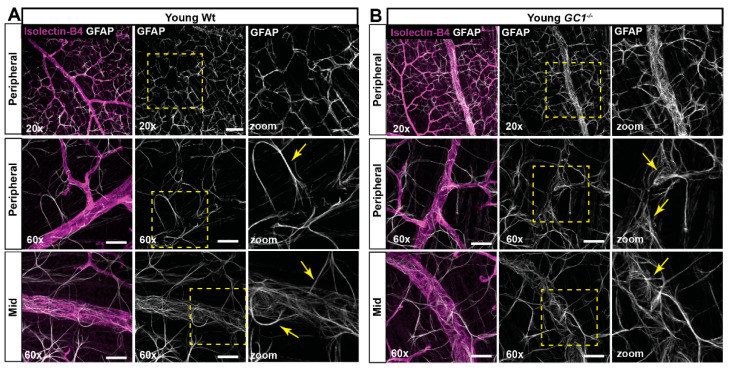
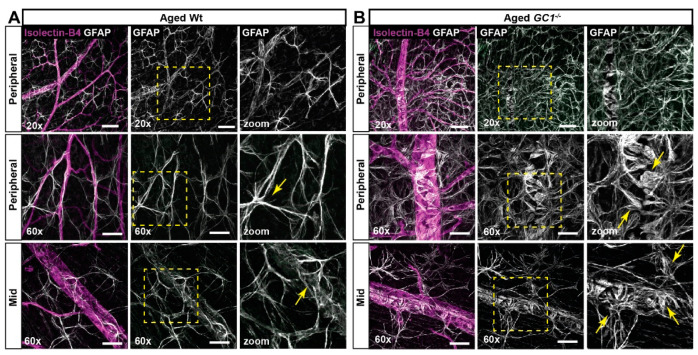
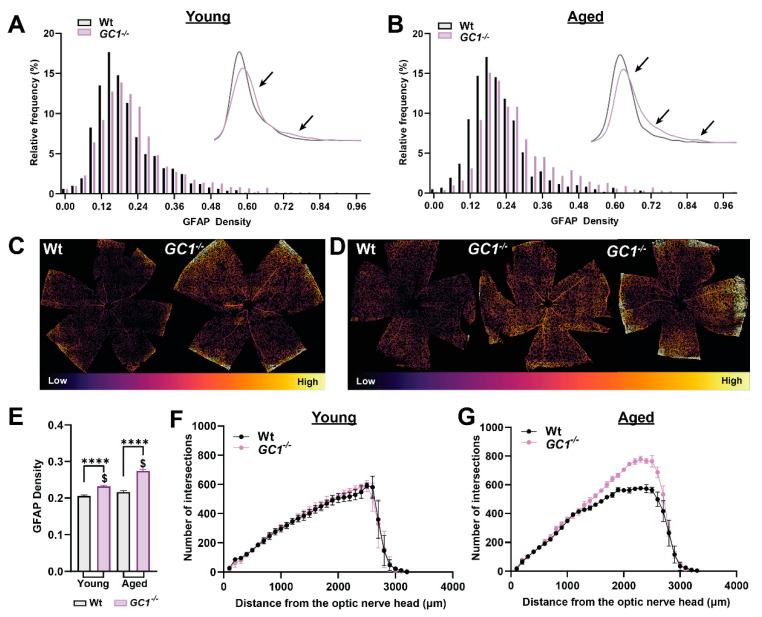
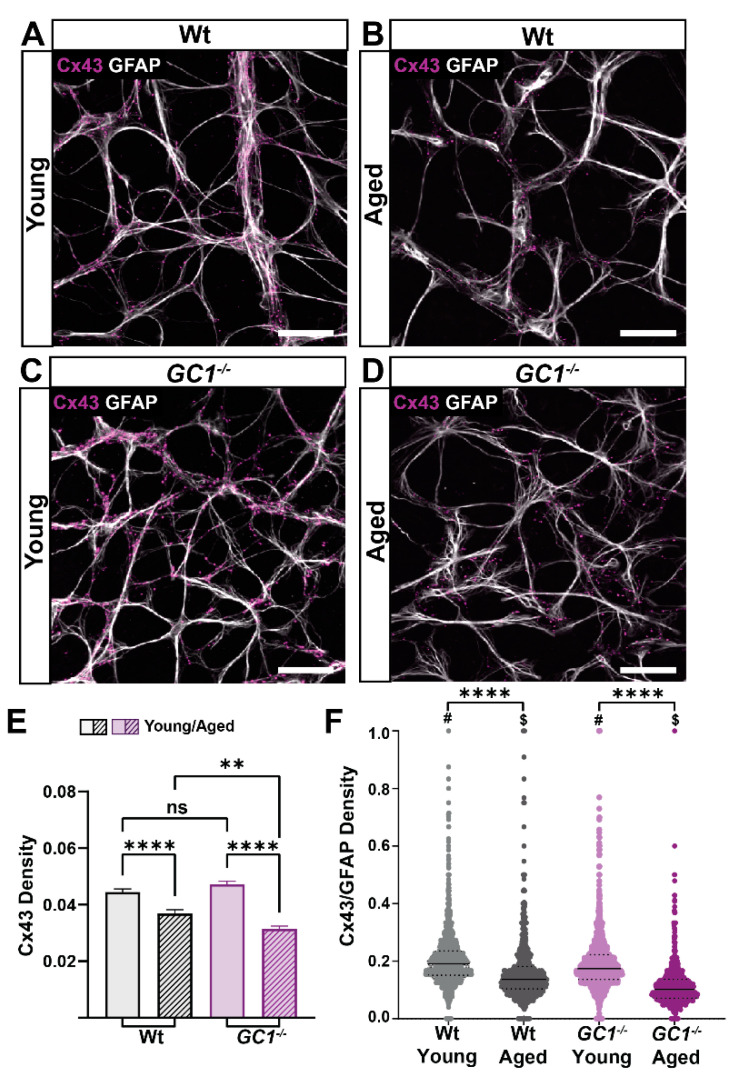
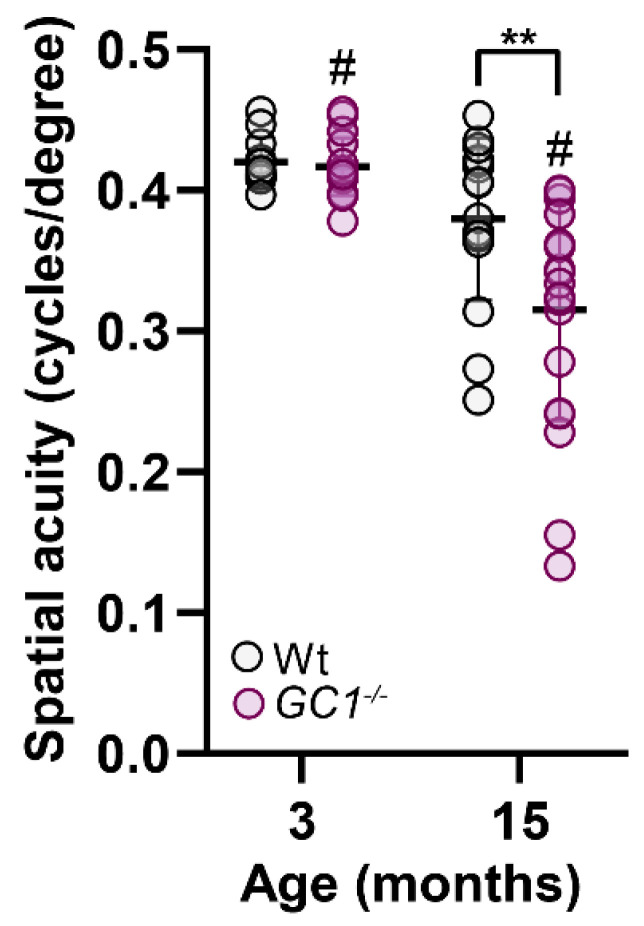
The nitric oxide-guanylyl cyclase-1-cyclic guanylate monophosphate (NO-GC-1-cGMP) pathway is integral to the control of vascular tone and morphology. Mice lacking the alpha catalytic domain of guanylate cyclase (GC1-/-) develop retinal ganglion cell (RGC) degeneration with age, with only modest fluctuations in intraocular pressure (IOP). Increasing the bioavailability of cGMP in GC1-/- mice prevents neurodegeneration independently of IOP, suggesting alternative mechanisms of retinal neurodegeneration. In continuation to these studies, we explored the hypothesis that dysfunctional cGMP signaling leads to changes in the neurovascular unit that may contribute to RGC degeneration. We assessed retinal vasculature and astrocyte morphology in young and aged GC1-/- and wild type mice. GC1-/- mice exhibit increased peripheral retinal vessel dilation and shorter retinal vessel branching with increasing age compared to Wt mice. Astrocyte cell morphology is aberrant, and glial fibrillary acidic protein (GFAP) density is increased in young and aged GC1-/- mice, with areas of dense astrocyte matting around blood vessels. Our results suggest that proper cGMP signaling is essential to retinal vessel morphology with increasing age. Vascular changed are preceded by alterations in astrocyte morphology which may together contribute to retinal neurodegeneration and loss of visual acuity observed in GC1-/- mice.

Keywords: astrocyte; blood retinal barrier; connexin; gap junctions; neurodegeneration; neurovascular unit; retinal ganglion cell; retinal vasculature.


Conflict of interest statement

The authors declare no conflict of interest.

Figures

Figure 1
Figure 1
Aged GC1−/− mice exhibit dilated vessel morphology in peripheral retina compared with Wt mice. (A) Vessel density is not significantly changed in the mid or peripheral retina of young GC1−/− mice (p = 0.979 and 0.307, n = 4 mice per genotype group). (B) Capillary diameter is not significantly changed in the mid or peripheral retina of young GC1−/− mice (p = 0.970 and 0.949; n = 4 mice per genotype group). (C) Major vessel diameters are not significantly changed in young GC1−/− mice compared to Wt (p = 0.45 and p > 0.99; n = 10–16; measurements from 4 to 5 mice per genotype group at mid = 1300 µm and peripheral = 2350 µm from the optic nerve head). (D) Vessel density is significantly increased in the peripheral retina of aged GC1−/− mice (+12.8%; 0.128 ± 0.004 vs. 0.145 ± 0.004; ** p = 0.005, n = 7–9 mice per genotype group). (E) Capillary diameter is significantly increased in the peripheral retina of GC1−/− mice (+11.5%; 9.296 ± 0.293 µm vs. 8.339 ± 0.293 µm; ** p = 0.004; n = 7–9 mice per genotype group). (F) Major vessels are significantly more dilated in the peripheral retina of aged GC1−/− mice (28.360 ± 6.250 µm vs. 33.070 ± 6.100 µm; * p = 0.015; n = 19–26 measurements from n = 3 mice per genotype group at mid = 1300 µm and peripheral = 2350 µm from the optic nerve head). (G) Representative fluorescence images of whole-mount retina labeled with isolectin-B4 showing dilated vessels in aged Wt and GC1−/− mice. Scale bar = 200 µm at 20× and 25 µm at 100×. Data are presented as means ± S.D. Statistical tests performed were two-way ANOVA and Sidak’s multiple comparisons test. Each n represents one retina from one animal. ns: not significant.
Figure 2
Figure 2
GC1−/− mice have an increased frequency of shorter capillary branches compared to Wt mice. (A) Representative fluorescent images of Wt and GC1−/− vessels stained with isolectin-B4. White arrows give example of a selection of terminal vessels, scale bar = 100 µm. (B) In mid retina of young mice, average branch length was significantly shorter in GC1−/− mice compared with age-matched Wt mice. No significant difference was observed in the peripheral retina between genotypes (n = 6 mice per genotype group; *** p = 0.0002 and p = 0.46). (C) In mid retina of aged mice, average branch length was significantly shorter in GC1−/− mice compared with age-matched Wt mice (n = 3 mice per genotype group; *** p = 0.0051). Average branch length in the peripheral retina of aged GC1−/− mice was significantly shorter than in aged Wt mice (n = 3 mice per genotype group; * p = 0.022). (D) Histogram showing normalized frequency of branch lengths in the mid retina of young Wt and GC1−/− mice; inset: Kernel density estimation (KDE) plot. (E) Histogram showing normalized frequency of branch lengths in the peripheral retina of young Wt and GC1−/− mice; inset: KDE plot. (F) Histogram showing normalized frequency of branch lengths in the mid retina of aged Wt and GC1−/− mice; inset: KDE plot. There is an increase in the frequency of shorter vessel lengths (arrow 1) and a decreased frequency of longer vessel lengths in GC1−/− mice (arrows 2 and 3). (G) Histogram showing normalized frequency of branch lengths in the peripheral retina of aged Wt and GC1−/− mice; inset: KDE plot. The frequency of shorter branch lengths was increased in GC1−/− mice (arrow 4) compared with Wt and a lower frequency of longer branch lengths was observed in GC1−/− mice (arrow 5). Data are presented as means ± S.D. Statistical analyses carried out were Kruskal–Wallis one-way ANOVA. ns: not significant.
Figure 3
Figure 3
Astrocyte morphology in young Wt and GC1−/− retina. (A) Representative confocal micrographs of astrocytes (GFAP; white) and blood vessels (isolectin B4; magenta) in peripheral and mid retina of young Wt mice. Astrocyte processes are long and striated (yellow arrows) with end feet wrapping the vessels. (B) Representative confocal micrographs of astrocytes (GFAP; white) and blood vessels (isolectin B4; magenta) in peripheral and mid retina of young GC1−/− mice. Astrocyte processes are long, but end feet are increasingly frayed proximal to vessels (yellow arrows). Scale bars at 20× = 100 µm and at 60× = 40 µm.
Figure 4
Figure 4
Astrocyte morphology in aged Wt and GC1−/− retina. (A) Representative confocal micrographs of astrocytes (GFAP; white) and blood vessels (isolectin B4; magenta) in peripheral and mid retina of aged Wt mice. Astrocyte processes are increasingly striated and frayed (yellow arrows) in proximity to vessels compared with young mice. (B) Representative confocal micrographs of astrocytes (GFAP; white) and blood vessels (isolectin B4; magenta) in peripheral and mid retina of aged GC1−/− mice. Dense patches of matted astrocytes are observed in proximity to blood vessels at the periphery. End feet appear increasingly bulbous and frayed (yellow arrows) compared to young GC1−/− animals and Wt mice. Scale bars at 20× = 100 µm and at 60× = 40 µm.
Figure 5
Figure 5
Astrocyte density is increased in GC1−/− retina. (A) Histogram plots of GFAP density across whole retinas of young Wt and GC1−/− animals (n = 8 Wt, n = 10 GC1−/−). The subplot shows a kernel density estimation plot for clarity; arrows signify differences in distributions between genotypes. (B) Histogram plots of GFAP density across whole retinas of aged Wt and GC1−/− animals (n = 3 Wt, n = 4 GC1−/−). The subplot shows a kernel density estimation plot for clarity; arrows signify differences in distributions between genotypes. (C) Representative retinas of young Wt and GC1−/− mice recolored according to relative GFAP density. (D) Representative retinas of aged Wt and GC1−/− mice pseudo-colored according to relative GFAP density; arrows point to areas of increased density. (E) Bar plot comparing GFAP densities between all groups. Data plotted as mean ± SEM. (**** p < 0.0001 and $ p < 0.0001). (F) Scholl analysis of binarized GFAP in young mice and (G) aged mice. Statistical analysis carried out was Kruskal–Wallis one-way ANOVA.
Figure 6
Figure 6
Connexin 43 (Cx43) density decreases significantly with age in Wt and GC1−/− mice. (A) Representative confocal micrographs of astrocytes (GFAP; white) and Cx43 (magenta) in retina of young Wt mice. (B) Representative confocal micrographs of astrocytes (GFAP; white) and Cx43 (magenta) in retina of aged Wt mice. (C) Representative confocal micrographs of astrocytes (GFAP; white) and Cx43 (magenta) in retina of young GC1−/− mice. (D) Representative confocal micrographs of astrocytes (GFAP; white) and Cx43 (magenta) in retina of aged GC1−/− mice. Scale bar = 40 µm. (E) Cx43 density across entire retinae of young and aged Wt and GC1−/− mice. Cx43 significantly decreases with age in Wt mice (n = 8 Wt, n = 10 GC1−/−; **** p < 0.0001) and significantly decreases with age in GC1−/− mice (n = 3 Wt, n = 4 GC1−/−; **** p < 0.0001). There is a significant difference between aged Wt and GC1−/− mice (n = 8 Wt and n = 4 GC1−/−; ** p = 0.005) (F) The ratio of Cx43 to GFAP density for each quadrant analyzed shows a significant difference between young and aged Wt mice (**** p < 0.0001) and young and aged GC1−/− mice (**** p < 0.0001). There is also a significant difference between genotypes in young (# p < 0.0001) and aged ($ < 0.0001) mice. All data expressed as means ± S.E.M. Statistical analyses carried out were Kruskall–Wallis one-way ANOVA. ns: not significant.
Figure 7
Figure 7
Visual acuity is decreased with age in GC1−/− mice. Visual acuity in Wt mice does not significantly decline with age (3 m; n = 6 and 15 m; n = 8), however, GC1−/− visual acuity significantly declines (3 m vs. 15 m, n = 10 and n = 8 # p < 0.0001; Kruskal–Wallis one-Way ANOVA). GC1−/− have similar acuity to Wt mice at 3 months (n = 10), which declines significantly at 15 months compared to Wt mice (n = 10; ** p = 0.02; Kruskal–Wallis one-Way ANOVA). Data points represent independent acuity readings in each naïve eye and are plotted as means ± S.D.

References

    1. Kemp-Harper B., Schmidt H.H. cGMP: Generators, Effectors and Therapeutic Implications. Springer; Berlin/Heidelberg, Germany: 2009. cGMP in the Vasculature; pp. 447–467. Handbook of Experimental Pharmacology 191.
    1. Kang J.H., Wiggs J.L., Rosner B.A., Hankinson S.E., Abdrabou W., Fan B.J., Haines J., Pasquale L.R. Endothelial nitric oxide synthase gene variants and primary open-angle glaucoma: Interactions with sex and postmenopausal hormone use. Investig. Ophthalmol. Vis. Sci. 2010;51:971–979. doi: 10.1167/iovs.09-4266. - DOI - PMC - PubMed
    1. Buys E.S., Ko Y.C., Alt C., Hayton S.R., Jones A., Tainsh L.T., Ren R., Giani A., Clerté M., Abernathy E., et al. Soluble Guanylate Cyclase alpha1-Deficient Mice: A Novel Murine Model for Primary Open Angle Glaucoma. PLoS ONE. 2013;8:e60156. doi: 10.1371/journal.pone.0060156. - DOI - PMC - PubMed
    1. Emam W.A., Zidan H.E., Abdulhalim B.E., Dabour S.A., Ghali M.A., Kamal A.T. Endothelial nitric oxide synthase polymorphisms and susceptibility to high-tension primary open-angle glaucoma in an Egyptian cohort. Mol. Vis. 2014;20:804–811. - PMC - PubMed
    1. Magalhaes da Silva T., Rocha A.V., Lacchini R., Marques C.R., Silva E.S., Tanus-Santos J.E., Rios-Santos F. Association of polymorphisms of endothelial nitric oxide synthase (eNOS) gene with the risk of primary open angle glaucoma in a Brazilian population. Gene. 2012;502:142–146. doi: 10.1016/j.gene.2012.04.047. - DOI - PubMed

LinkOut - more resources