. 2022 Mar 12;23(6):3069.
doi: 10.3390/ijms23063069.

Fluorescent Silica Nanoparticles Targeting Mitochondria: Trafficking in Myeloid Cells and Application as Doxorubicin Delivery System in Breast Cancer Cells

Affiliations

Fluorescent Silica Nanoparticles Targeting Mitochondria: Trafficking in Myeloid Cells and Application as Doxorubicin Delivery System in Breast Cancer Cells

Federica Sola et al. Int J Mol Sci. .

Abstract

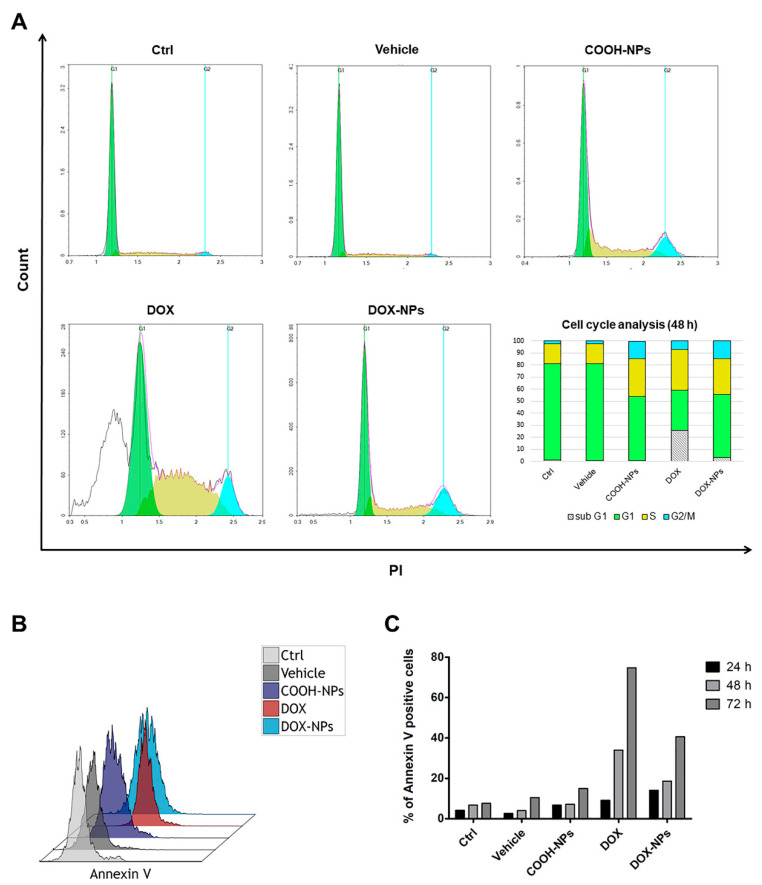
Fluorescent silica nanoparticles (SiNPs) appear to be a promising imaging platform, showing a specific subcellular localization. In the present study, we first investigated their preferential mitochondrial targeting in myeloid cells, by flow cytometry, confocal microscopy and TEM on both cells and isolated mitochondria, to acquire knowledge in imaging combined with therapeutic applications. Then, we conjugated SiNPs to one of the most used anticancer drugs, doxorubicin (DOX). As an anticancer agent, DOX has high efficacy but also an elevated systemic toxicity, causing multiple side effects. Nanostructures are usually employed to increase the drug circulation time and accumulation in target tissues, reducing undesired cytotoxicity. We tested these functionalized SiNPs (DOX-NPs) on breast cancer cell line MCF-7. We evaluated DOX-NP cytotoxicity, the effect on the cell cycle and on the expression of CD44 antigen, a molecule involved in adhesion and in tumor invasion, comparing DOX-NP to free DOX and stand-alone SiNPs. We found a specific ability to release a minor amount of CD44+ extracellular vesicles (EVs), from both CD81 negative and CD81 positive pools. Modulating the levels of CD44 at the cell surface in cancer cells is thus of great importance for disrupting the signaling pathways that favor tumor progression.

Keywords: EVs; anticancer tool; delivery system; doxorubicin; lysosomes; mitochondria; nanoparticles; theranostics.


Conflict of interest statement

Federica Sola, Chiara Barattini and Alfredo Ventola are/were employees of Aczon srl. Stefano Papa (Professor at University of Urbino) has a collaboration with Aczon srl, and Alfredo Ventola is the manager of Aczon srl. AcZon srl provided some materials needed for the study; however, AcZon srl had no influence on results generated in this work. The authors report no other potential conflicts of interest for this work.

Figures

Figure 1
Figure 1
Isolated mitochondria of U937 cells incubated for 1 or 24 h with SiNPs. (A) Representative brightfield images of isolated mitochondria from controls (1 h and 24 h, a and c) and NP-treated cells (1 h and 24 h, b and d). Scale bar = 10 µm. (B) Representative fluorescent merged confocal images of isolated mitochondria from control (a) and NP-treated cells (b) for 24 h and then stained with LTG (green) and TMRE (red). Yellow/green and violet indicate colocalization (highlighted in treated cells from violet arrows). Scale bars: 25 µm. (C) Histogram of flow cytometry data indicating percentage of SiNPs positive cells after 1 h and 24 h of incubation. (D) Histogram of flow cytometry data which illustrate mean fluorescence intensity (MFI) of SiNPs within isolated mitochondria of U937 cells after 1 h and 24 of treatment. At least 10,000 events were analyzed by flow cytometry for each experimental condition.
Figure 2
Figure 2
SiNPs uptake study of U937 isolated mitochondria and mitochondrial mass investigation. Sequence of analysis by flow cytometry of MTG staining of isolated mitochondria from controls and NP−incubated cells, respectively, and treated by CCCP at 24 h. Above: contour plots FSC vs. MTG (FITC); below: histograms of TMRE staining.
Figure 3
Figure 3
Assessment of mitochondrial features of isolated mitochondria from U937 cells incubated for short or long time with SiNPs. Quantification of mitochondrial mass with MTG staining (A) and mitochondrial membrane potential (MMP) △Ψm with TMRE (B) through flow cytometry analysis of control and treated cells for 1 and 24 h. Determination of cellular (C) and mitochondrial (D) glutathione (GSH) content in U937 cells incubated with NP for 1 h or 24 h by high performance liquid chromatography (HPLC). GSH content of untreated U937 cells was 35.0 ± 5 nmol/mg proteins in cells and 3.0 ± 0.55 nmol/mg proteins in mitochondria. Asterisks denote a statistically significant difference (** = p < 0.01, *** = p < 0.001) of treated compared to the relative control. At least 10,000 events were analyzed by flow cytometry for each experimental condition.
Figure 4
Figure 4
Ultrastructure of U937 cells incubated with SiNP. Electron-dense particles internalization in the mitochondria is present in (A,B). Small MDVs formation from mitochondria membranes is visible in (CE). Transient (F) and complete (G) formation of endolysosomes is observable. A,D,E, bar = 100 nm: B,C,F, bar = 200 nm; G, bar = 250 nm.
Figure 5
Figure 5
Schematic representation of SiNPs uptake in U937 cells and their intracellular trafficking, by highlighting the effects on mitochondria. Our previous data [1] showed a colocalization with both lysosomes and mitochondria in U937 cells, indicating intracellular endocytic rehashing of SiNPs once inside the cells and transport to other organelles. Confocal analysis depicted the peripheral distribution of SiNPs, located in the peri-mitochondrial space (as illustrated in the enlargement of the mitochondrion). Flow cytometric data of entire cells and isolated mitochondria suggested the mitophagic process to eliminate damaged mitochondria full of SiNPs or either mitochondrial fission and/or mitochondrial-derived vesicles (MDVs) budding from mitochondrial outer membranes to free mitochondria from SiNPs. Although an initial ROS overexpression was detected, mitochondrial respiration was not substantially impaired. After 1 h, cells maintain the ability to synthesize GSH in the cytosol and its transport to mitochondria is not compromised, as we observed a higher amount of GSH in comparison to controls. Nevertheless, after 24 h of incubation with SiNPs, while total GSH is still higher than control cells in order to buffer ROS, mitochondrial GSH is slightly reduced. Finally, cells are able to release SiNPs both with vesicle or non-vesicle related secretion. (Image created with BioRender.com, accessed on 31 December 2020).
Scheme 1
Scheme 1
Schematic pathway for the synthesis of doxorubicin-fluorescent silica nanoparticles in MES buffer, pH 5. (1) Fluorescent SiNPs (amine functionalization); (1a) Succinic anhydride; (2) Fluorescent silica NPs (carboxylic functionalization); (2a) N-Hydroxysuccinimide (NHS); (2b) 1-Ethyl-3-(3-dimethylaminopropyl)carbodiimide (EDC); (2c) Doxorubicin; (3) DOX-NPs.
Figure 6
Figure 6
Intracellular investigation of COOH-NPs and DOX-NPs in MCF-7 cells: colocalization with lysosomes and mitochondria (A) Representative confocal images of MCF-7 cells incubated for 4 h at 37 °C with medium (ctrl), COOH-NPs (diluted 1:50) or DOX-NPs (1 µg/mL of drug) and then stained with LysoTracker green (LTG) and tetramethylrhodamine ethyl ester perchlorate (TMRE), respectively for lysosomes and mitochondria. Figures show LTG (green), TMRE (red), SiNPs (blue) and merged images (last line at the bottom). Teal and violet colors indicate colocalization between, respectively, LTG/NPs and TMRE/NPs. Scale bar: 10 µm. (B) Merge of LTG and TMRE in MCF-7 with COOH-NPs and DOX-NPs. Magnification of inset regions are shown. White arrows display colocalization points. Scale bars, 10 μm. (C) Pearson’s colocalization coefficient (PCC) of LTG and TMRE with COOH-NPs and DOX-NPs in MCF-7 cells. PCCs were derived from two completely independent experiments with 8 fields per experiment contributing to the cumulative result. Each value is expressed as PCC ± sd; asterisks denote a statistically significant difference (*** = p < 0.001, ns = p > 0.05) between LTG and TMRE colocalization with COOH-NPs.
Figure 7
Figure 7
Intracellular accumulation and quantification of DOX in MCF-7 cells treated with DOX and DOX-NPs. MCF-7 cells were incubated with medium (Ctrl neg), DMSO (vehicle), COOH-NPs (diluted 1:50), free DOX (1 µg/mL) and DOX-NPs (1 µg/mL of DOX) for 24, 48 and 72 h at 37 °C. (A) Representative fluorescent microscopy images of MCF-7 cells incubated for 48 h at 37 °C with free DOX (1 µg/mL), mainly localized in the nucleus (i), and respective counter staining of nucleus with Hoechst (iii) or with DOX-NPs (1 µg/mL of drug), where red fluorescence indicates vesicles moved into the cytoplasm and perinuclear region (ii). Gray arrows highlight DOX filled vesicles, while small gray triangles indicate micronuclei containing DOX. Magnification 100× oil immersion. (B) Mean fluorescence intensity (MFI) of DOX from the flow cytometry data is shown as a function of time (n = 2). (C) Flow cytometry histogram overlay shows the NP fluorescence within MCF-7 cells after 48 h of incubation. At least 10,000 events were analyzed by flow cytometry for each experimental condition.
Figure 8
Figure 8
Investigation of cell death features on MCF-7 cells after treatment. MCF-7 were incubated with medium (Ctrl neg), DMSO (vehicle), COOH-NPs (diluted 1:50), free DOX (1 µg/mL) and DOX-NPs (1 µg/mL of DOX) for 24, 48 and 72 h at 37 °C. (A) Representative DNA histograms (obtained by PI staining) of MCF-7 cell cycle analysis after 48 h exposure. Bar graph indicates the percentages of cell distribution in different phases of cell cycle (sub-G1, G1, S and G2/M) for control and treated cells after 48 h. (B) Exemplifying flow cytometry histogram overlay for MCF-7 treated for 48 h and stained with Annexin V-FITC to investigate cell surface expression of phosphatidylserine, as marker of apoptosis. (C) The histogram presents the percentage of Annexin V positive cells detected through flow cytometry during time (n = 2).
Figure 9
Figure 9
CD44 expression on cell surface and its expression on extracellular vesicles after DOX treatment. (A) MCF-7 were incubated with medium (Ctrl neg), DMSO (vehicle), COOH-NPs (diluted 1:50), free DOX (1 µg/mL) and DOX-NPs (1 µg/mL of DOX) for 24, 48 and 72 h at 37 °C, washed and then stained with CD44 RPE. Mean fluorescence intensity (MFI) data were acquired by flow cytometry and normalized to control (n = 2). (B) Flow cytometry contouring plots (above: NPs channel vs. CD81 FITC; below: fluorescence of particles CD44 RPE vs. CD81 FITC) of supernatants, presenting in pink CD81− particles or violet CD81+ particles. (C) The histogram shows the quantification of extracellular vesicles (EVs), counted using Dako CytoCountTM beads, in Ctrl, COOH-NP, DOX and DOX-NP media containing CD44+/CD81− and CD44+/CD81+ particles (n = 2). The color scheme is the same as contouring plots. At least 10,000 events were analyzed by flow cytometry for cells and at least 30,000 events for EVs for each experimental condition.

Similar articles

Cited by

References

    1. Sola F., Canonico B., Montanari M., Volpe A., Barattini C., Pellegrino C., Cesarini E., Guescini M., Battistelli M., Ortolani C., et al. Uptake and intracellular trafficking studies of multiple dye-doped core-shell silica nanoparticles in lymphoid and myeloid cells. Nanotechnol. Sci. Appl. 2021;14:29–48. doi: 10.2147/NSA.S290867. - DOI - PMC - PubMed
    1. Shi M., Zhang J., Li X., Pan S., Li J., Yang C., Hu H., Qiao M., Chen D., Zhao X. Mitochondria-targeted delivery of doxorubicin to enhance antitumor activity with HER-2 peptide-mediated multifunctional pH-sensitive DQAsomes. Int. J. Nanomed. 2018;13:4209–4226. doi: 10.2147/IJN.S163858. - DOI - PMC - PubMed
    1. Solazzo M., Fantappiè O., Lasagna N., Sassoli C., Nosi D., Mazzanti R. P-gp localization in mitochondria and its functional characterization in multiple drug-resistant cell lines. Exp. Cell Res. 2006;312:4070–4078. doi: 10.1016/j.yexcr.2006.09.005. - DOI - PubMed
    1. Barot M., Gokulgandhi M.R., Pal D., Mitra A.K. Mitochondrial localization of P-glycoprotein and peptide transporters in corneal epithelial cells—Novel strategies for intracellular drug targeting. Exp. Eye Res. 2013;106:47–54. doi: 10.1016/j.exer.2012.10.006. - DOI - PMC - PubMed
    1. Abbasi E., Aval S.F., Akbarzadeh A., Milani M., Nasrabadi H.T., Joo S.W., Hanifehpour Y., Nejati-Koshki K., Pashaei-Asl R. Dendrimers: Synthesis, applications, and properties. Nanoscale Res. Lett. 2014;9:247. doi: 10.1186/1556-276X-9-247. - DOI - PMC - PubMed